Friedel oscillations in a two-band Hubbard model for CuO chains
Abstract
Friedel oscillations induced by open boundary conditions in a two-band Hubbard model for CuO chains are numerically studied. We find that for physically realistic parameters and close to quarter filling, these oscillations have a modulation according with experimental results on YBa2Cu3O7-δ. In addition, we predict that, for the same parameters, as hole doping is reduced from quarter filling to half filling, Friedel oscillations would acquire a modulation, typical of a strongly correlated electrons regime. The modulation dominates also in the electron doped region. The range of parameters varied is very broad, and hence the results reported could apply to other cuprates and other strongly correlated compounds with quasi-one dimensional structures. On a more theoretical side, we stress the fact that the copper and oxygen subsystems should be described by two different Luttinger liquid exponents.
pacs:
71.10.Fd, 71.10.Hf, 71.10.Pm, 71.10.-wI Introduction
The application of scanning tunneling spectroscopy (STM) techniques to the CuO chain planes in YBa2Cu3O7-δ (YBCO) has provided new insights on the physics of these quasi-one dimensional (1D) electronic structures. These experimental studies have shown in real space the presence of charge modulations along the chains at low temperature, inside the superconducting phase.derro ; maki These charge oscillations had been inferred earlier from neutron scattering experiments on the same compound.mook Taking together results from both band calculationspickett and angle-resolved photoemissionlu (ARPES) indicating a chain filling close to one quarter, it turns out that the observed charge modulations have a wavenumber.
Although earlier STM studiesedwards had given indications of the presence of charge oscillations on the chains, the present interest on these features comes from a more recent set of experiments exploring the interplay between the chain plane and the CuO2 plane in YBCO. On one side, the chains (running along the b direction) may contribute to the in-plane resistivity anisotropy in this compound.ando It is also important to notice that stripes in CuO2 planes also run along the b direction, may be not coincidentally. On the other side, there have been experimental indications of a superfluid density induced on the chains due to the proximity to the CuO2 planes.basov ; gagnon Although the interpretation of this last set of experiments is still controversialgrevin ; lu , one recent theoretical studymorr offers an explanation of STM resultsderro based on this scenario of proximity induced chain superconductivity (SC). In this model, the resonances in the chains arise from the interference between magnetic impurities in the chains.
Alternatively, we believe it is necessary to search for explanations of these experimental results based on models which capture the intrinsic electronic interactions on the chains. Eventually, in this kind of models, the SC on the CuO2 planes could modify at an effective level the coupling constants of the intrachain interactions. This approach connects the present study to the more general theoretical interest in various types of charge inhomogeneities appearing in strongly correlated electron systems in low spatial dimensions. In fact, in addition to the relevance of the presence of charge oscillations in the chains to the physics of the CuO2 planes, it has been emphasized that precisely the assumed strong Coulomb interactions in the cuprates would naively favour a instead of the observed wavenumber of the charge modulations.maki
Since CuO chains are cut by oxygen depletion, we will try to describe the charge modulations as generalized Friedel oscillations (FO) starting at the open end of the resulting fragments. A very recent numerical and analytical studywhite_friedel on the 1D one-band Hubbard model has indeed found a crossover from to FO as the strength of the onsite Coulomb interaction is increased. We are going to examine a two-band Hubbard model, appropriate for the CuO chains, where the situation is more complex due to different Coulomb repulsions on Cu and O ions, in addition to the charge transfer between them.pencmila It is interesting to notice that ARPES showslu a chain’s Fermi surface in agreement with band calculations and at the same time the dispersion along the chain direction agrees with the holon band predicted by strongly correlated theories.maekawa Hence, although the Coulomb repulsion on Cu ions is large, it does not automatically imply a strongly correlated behavior on any given physical quantity. In particular, we will show a complex dependence of and FO with respect to the Coulomb interactions and charge transfer parameter.
The model here studied does not include electron-lattice coupling which is another possibility of inducing instabilities. Experimentallymook , it has been suggested that standard lattice phonons are unlikely to reproduce the observed features. Finally, both in order to help the understanding of our results and in order to extend the scope of this study, we will consider a somewhat large variation of interaction parameters, and in addition to quarter-filling, dopings close to half-filling, and also electron doped chains will also be studied. Besides, we will consider open ends occupied with O ions and with Cu ions.
II / phase boundary
II.1 Model and method of calculation
The model studied is the 1D two-band Hubbard model defined as:
| (1) | |||||
where, creates a hole with spin at site , , . The sums run over , : number of unit cells, and Cu (O) ions occupy odd (even) sites. . All our results shown below correspond to , , and . The number of holes () is larger than for hole doped systems in which case the filling is computed as , or smaller than for electron doped systems in which case the filling is computed as . At half filling . The numerical technique employed in the present study is the density matrix renormalization group algorithm (DMRG).white-DMRG The most important quantity measured by this technique is the on-site charge density, . Most results were obtained with a truncation number . For several cases we examined also and with almost indistinguishable results.
In principle, we are interested in the effect of oxygen depletion which implies that CuO chains are cut at oxygen sites. These depleted oxygens could be modeled by just imposing open boundary conditions on chains with odd number of sites with the two end sites corresponding to Cu-ions. However, it is technically convenient to use chains with even number of sites which implies that one end is occupied by an oxygen ion and the other end site by a copper ion. The open end with an O ion would correspond to a nonmagnetic impurity, for example a Zn ion replacing a Cu ion.nonmagnetic If one assumes that the Friedel oscillations from both ends do not have nonlinear superposition, i.e. both oscillation are independent of each other, then the use of even number of sites allows us the simultaneous study of both types of impurities in a single chain.
Since, as said in the Introduction, Friedel oscillations appear due to oxygen depleted sites acting as impurity centers in an otherwise metallic chain, then they will follow a power law behavior predicted by Luttinger liquid theory,schulz
| (2) |
with the distance from the impurity. This expression can be derived from the asymptotic form of the charge correlations and is the interaction dependent correlation exponent.fabrizio Numerical studies have verified that FO follow this form for the one-band Hubbard and - models on chains and ladderswhite_friedel and for the Kondo lattice model on chains.kondofriedel In the following, we will fit our data using Eq. (2). The complete fitting procedure is detailed in the Appendix. The key point of this procedure is that we simultaneously fit the FO starting from the left chain end (Cu site) and the one which starts from the right chain end (O site).
II.2 Quarter filling
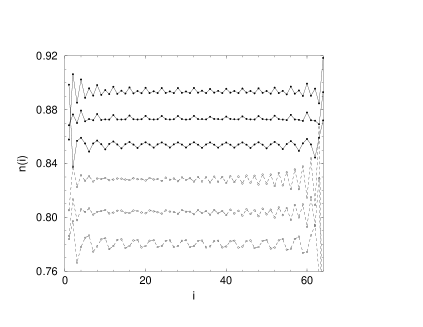
We start by examining the electron density as a function of the position obtained by DMRG for , , which corresponds to quarter filling, , as a function of and . At this filling, the density modulation has period of four unit cell spacings for the component. This period can be clearly seen in the Friedel oscillations shown in Fig. 1, () in both Cu and O ions, at . These density oscillations extend appreciably over the whole chain. For , the density oscillations on both type of ions present a period of two which corresponds to a wave. Also shown are the oscillations for , close to the crossover between both regimes.
By applying the fitting procedure previously discussed, we are able to obtain the mean amplitudes for the and components of the Friedel oscillations on Cu or on O ions starting at site 1 (occupied by a Cu ion), corresponding to an impurity on an O ion, and the one starting at site 64 (occupied by an O ion), corresponding to an impurity on a Cu ion. These mean amplitudes are defined by Eqs. (9) and (10). The inclusion of the density oscillation close to the ends introduces somewhat large numerical errors so we discarded the first three points near the ends. The results are depicted in Fig. 2. The error bars are about the size of the symbols used. By discarding different number of initial sites of course the amplitudes vary. However, their crossing point does not change appreciably. Various features can be rapidly appreciated: a larger amplitude on O sites than on Cu sites for the dominant component; the suppression of the amplitude with increasing for O-site oscillations; larger (smaller) O (Cu) amplitudes for Cu-impurity than for O-impurity.
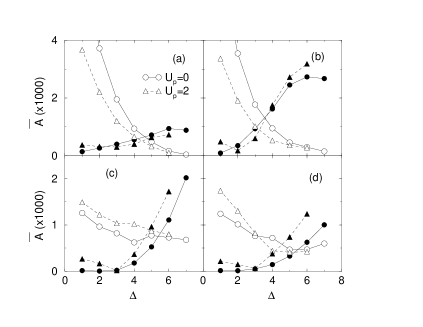
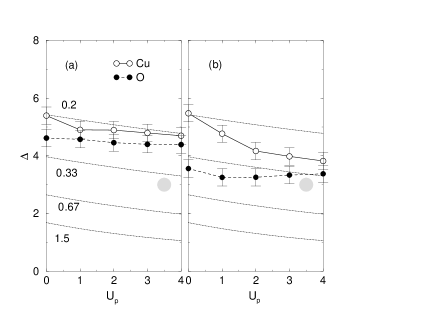
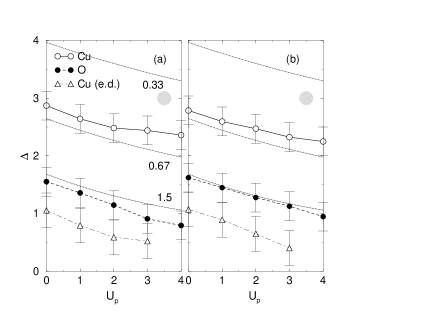
The crossing of these mean amplitudes as is increased for a given value of is adopted as the crossing of the -dominated regime to the -dominated regime. Other criteria could be eventually adopted but we found that this criterion faithfully reproduces the change of oscillation period which is the quantity measured in STM experiments. The results can be summarized in the “phase” diagram shown in Fig. 3. The region of below the crossover corresponds to the -dominated regime while the region of above it corresponds to the -dominated regime. The first remarkable feature is that the crossover in the O-ions oscillations takes place at lower values of than the crossover in the Cu-ions oscillations.
To help the interpretation of these results, we have overimposed on this figure lines of constant of an effective one-band - model with,brenig
| (3) |
and
| (4) |
We have fixed the proportionality constant in such a way that the physical point for the CuO chains corresponds to , taking into account some dispersion on the values reported for the Coulomb interactions which are approximately, (the value adopted in the present study), , (in units of ). At a fixed hole density, each line of constant (indicated in Fig. 3) corresponds in the effective 1D - model to a line of constant , which have been previously estimated.ogata Then, it can be appreciated in Fig. 3 that the / boundaries are roughly parallel to these lines with the largest deviation corresponding to the O oscillations, Cu impurity. In addition, as it can be seen in Fig. 3(a), for the physical region corresponding to the CuO chains (indicated with a gray circle), the FO generated by oxygen depletion have modulation in agreement to experimental results near quarter filling.maki In the case of Cu impurity (Fig. 3(b)), although the / boundary is shifted to lower values of , the FO are predicted to have also a character in the physical region.
II.3 filling
While in the undoped compound, YBa2Cu3O7, the chain filling is , upon oxygen depletion it increases toward half-filling, which is reached at (Ref. cava, ). Hence, in this subsection we consider the case of . Although increased O depletion would produce on average shorter CuO segments, in order to reduce the number of varying parameters and to facilitate the comparison, we study the same chain length as in the previous subsection, i.e. . The filling then corresponds to holes. In this case, and .
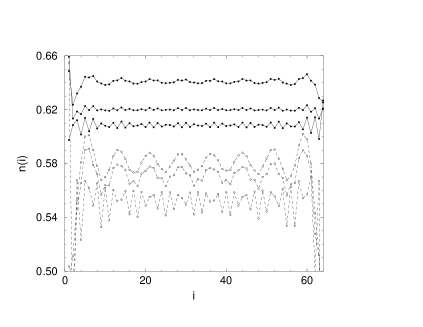
Let us start by examining in real space density oscillations corresponding to this filling. They are illustrated in Fig. 4. The oscillations for small , corresponding to can be regarded as period 2 oscillations with kinks, while the oscillations at large , corresponding to have a well defined period 8 unit cell spacings.
As we did in the previous subsection, we have fitted the density oscillations for both Cu and O ions and the results for the mean amplitudes of the and components are shown in Fig. 5. By comparing with the previous results at quarter filling, it can be concluded that the amplitudes of the dominant component are in general much larger in this case of . Again O oscillations have in general larger amplitudes than the Cu ones. It can be also observed that the effect of is relatively small in the present case. Also there are virtually no differences between the cases of O-impurity and Cu-impurity.
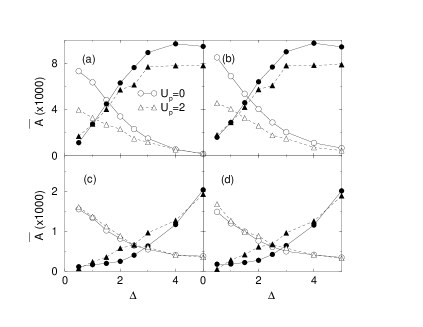
Again, the crossing points between and components of the mean amplitudes lead to the “phase” diagram shown in Fig. 6. As anticipated by the previous figure, the boundary between the (low ) and the (high ) regions has been considerably shifted to lower values of with respect to the quarter filled case. As for , these boundaries also follow approximately the lines of constant of the effective 1D - model. However, in contrast with that case, there is much less difference between the boundaries for O depletion-induced FO (Fig. 6(a)) and the boundaries for the FO induced by nonmagnetic substitution of Cu ions (Fig. 6(b)). In any case, as in the quarter filled case, the most remarkable feature is again that the to crossover for oxygen FO takes place at smaller values of than the one for Cu FO. Notice that for this filling the physical region of parameters (gray circles) falls now on the side of the diagram.
Finally, by further oxygen depletion, , the chain would formally go into the electron doped region. The / boundary between Friedel oscillations on Cu ions in the electron doped, , system is also included in Fig. 6. This result confirms the trend suggested by the cases and , that by reducing the number of holes this boundary shifts to lower values of for a fixed . On the other hand, the occupancy on O sites is very low and we observed oscillations for all the values of parameters examined. It is reasonable to speculate that by further reducing the number of holes the presence of oscillations on Cu ions will eventually disappear as well, i.e. the effects of strong electron correlations are expected to be more important close to half-filling.
II.4 Global properties
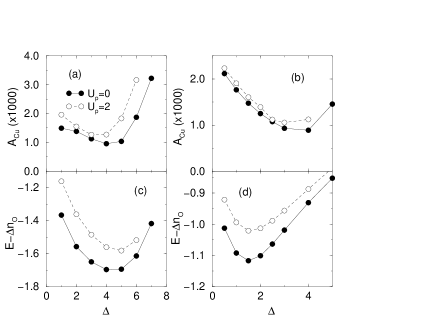
Let us examine some global properties like the total ground state energy and the average amplitude of FO. Since this energy is monotonically increasing with , for all the other parameters fixed, it is more meaningful to analyze the quantity obtained by subtracting from the quantity where is the average filling on O sites. The average of the amplitude of the FO on Cu sites is defined as,
| (5) |
where the sum runs over Cu sites and is the average filling on Cu sites. To be consistent with the fitting procedure and hence to allow comparison with Figs. 2 and 5 we discarded the first three sites close to both chain ends. The resulting quantity is shown in Fig. 7(a),(b) for and respectively. It can be noticed that it presents a minimum at a value of close to the / boundary of Cu FO at a given value of . As it can be seen in Fig. 7(c),(d), the corrected energy, also presents a minimum at approximately the same values of for . At , the minimum of this quantity is located at a lower value, closer to the / boundary of oxygen FO.
III Discussions and conclusions
The two most important results of the present study, which can be deduced from Figs. 3 and 6 are: (i) the to crossover takes place at smaller values of for given as doping is reduced from quarter filling to half filling, and (ii) for hole doped chains this crossover takes place at smaller for the density oscillations on O ions than for the ones on Cu ions. Let us discuss these two features in detail.
In the first place, the fact that the / boundaries quite likely correspond to lines of constant of an effective 1D - model suggests that both the approximate mapping to this model and the whole fitting procedure are physically correct. One should notice that this effective one band model is obtained essentially by projecting out the oxygen sites, i.e. is a model valid mostly for Cu ions. Besides, it becomes less valid as one moves away from half filling. It is not obvious then that also the boundaries for oxygen oscillations follow approximately the lines of constant although with some important deviations, specially at quarter filling. The dependence of with and hole density for the 1D - modelogata , is consistent with the shifting of the Cu / boundary to lower values of as hole density , and in turn this is consistent with the intuitive notion that strongly correlated electrons regimes become more important close to half-filling.
However, this mapping does not explain by itself why in the case of hole doping, the / boundaries for O oscillation occur at smaller values of for any given , i.e. why the O-subsystem enters in the strong correlation regime at smaller interactions than the Cu-subsystem. To understand this feature, it would be necessary to analyze effective models obtained by projecting out Cu sites and retaining O sites. These effective models, the so-called “spin-fermion” or Kondo-Heisenberg models,brenig are considerably more complicated and related available results are limited.sikkema For hole doped cuprates, i.e. with holes in excess of the number of Cu ions, it can be assumed that Cu ions are mostly single occupied, and in this case our results suggest that the to crossover is “driven” by the oxygen oscillations. That is, the O subsystem is more susceptible to strong correlations than the Cu subsystem. On the other hand, for the case of electron doped chains, i.e. with fewer holes than Cu ions, the to crossover takes place at small for Cu density oscillations while for O FO have in the range of parameters studied, and in this sense, the crossover seems “driven” by the Cu ions. Hence, the nearly empty O band in electron doped chains is symmetric to the half-filled Cu band in hole doped cuprates.
There are two factors affecting the magnitude of the mean amplitudes of the and components: their amplitude at the origin, and their power law exponents. The amplitudes at the origin (, , , , in Eqs. (6) and (7)) may depend on the formation of bound states between holes and impurities. With respect to the power law exponents, one could assume that the FO on Cu and on O sites are determined by two different since they obey different effective models in addition of having different hole densities. Unfortunately, although the fitting to the oscillations using Eqs. (6), (7), (8) are very good, the determination of from the fitted values is very noisy to allow reliable conclusions. In this sense, an independent study of periodic chains, with a careful study of finite size effects, would be necessary to confirm this possibility.
Order of the crossover. It seems to be a first order in the sense that there are no other oscillation wavenumber between to . The evidence for this is rather indirect since our method of fitting does not make room for variable wavenumber, and a Fourier (or windowed Fourier) transform would mix the Friedel oscillations starting form the left and right ends of the open chain. The indication of a first order type of crossover comes from the fact that the overall average amplitude of the density oscillations are minimum at the crossing point (Figs. 1, 4 and 7(a),(b)). This suggests that the system becomes “frustrated” at the crossing point due to the competition of and modulations being unable to develop a modulation at another wavenumber. The behavior of the corrected ground state energy, , (Fig. 7(c),(d)) is consistent with this interpretation: its minimum is located close to the point where is also minimum presumably because it gains energy due to delocalization. Hence, this quantity also suggests that there are no FO with a modulation intermediate between and .
Predictions. The main prediction of the present study is that CuO chains in YBa2Cu3O7-δ would undergo a to crossover in the Friedel oscillations induced by oxygen depletion or by nonmagnetic substitution of Cu ions as doping moves from quarter to half filling and eventually into the electron doped region. Additionally we predict that experiments like STM, probing O sites, would detect a modulation while experiments such as neutron scattering would still see a modulation on Cu sites. More generally, the modulation of FO can be considered as a sensible tool to detect the sometimes subtle presence of strong electron correlations in quasi-1D systems. Finally, if the observed modulations in CuO chains are essentially Friedel oscillations and the presence of superconductivity on the planes plays a minor role, then similar modulations should be observed in the non-superconducting compound PrBa2Cu3O7 (Ref. mizokawa, ).
Acknowledgements.
This work was supported by a Grand-in-Aid for Scientific Research on Priority Areas and the NAREGI Nanoscience Project from MEXT and CREST. One of authors (M. M.) acknowledges support of 21st. Century COE program. The use of supercomputers and friendly technical assistance at the Center for Computational Materials Science, IMR, Tohoku University, is also gratefully acknowledged.Appendix A Fitting procedure
In general, the oscillation starting from the Cu-edge is different to that from the O-edge. The total oscillation, as obtained numerically, is the superposition of both oscillations. Assuming these oscillation follow the Luttinger power law expressions,
| (6) |
and
| (7) | |||||
where is the system size, then our fitting function will be,
| (8) |
with . is the number of sites from each edge that are cut out to avoid wild oscillations. Below, the constant terms, and , are neglected, since a uniform component is subtracted before the fitting process.
The mean amplitudes of the and components of the Friedel oscillations starting from the left and from the right edges of the chain are defined as,
| (9) |
and
| (10) |
respectively.
In the fitting process, Eq. (8) is rewritten as,
| (11) | |||||
References
- (1) D. J. Derro, E. W. Hudson, K. M. Lang, S. H. Pan, J. C. Davis, J. T. Markert, and A. L. de Lozanne, Phys. Rev. Lett. 88, 097002 (2002).
- (2) M. Maki, T. Nishizaki, K. Shibata, and N. Kobayashi, Phys. Rev. B 65, 140511 (2002).
- (3) H. A. Mook, P. Dai, K. Salama, D. Lee, F. Dogan, G. Aeppli, A. T. Boothroyd, and M. E. Mostoller, Phys. Rev. Lett. 77, 370 (1996).
- (4) W. E. Pickett, R. E. Cohen, and H. Krakauer, Phys. Rev. B 42, 8764 (1990).
- (5) D. H. Lu, D. L. Feng, N. P. Armitage, K. M. Shen, A. Damascelli, C. Kim, F. Ronning, Z.-X. Shen, D. A. Bonn, R. Liang, W. N. Hardy, A. I. Rykov, and S. Tajima, Phys. Rev. Lett. 86, 4370 (2001).
- (6) H. L. Edwards, A. L. Barr, J. T. Markert, and A. L. de Lozanne, Phys. Rev. Lett. 73, 1154 (1994).
- (7) Y. Ando, K. Segawa, S. Komiya, and A. N. Lavrov, Phys. Rev. Lett. 88, 137005 (2002).
- (8) D. N. Basov, R. Liang, D. A. Bonn, W. N. Hardy, B. Dabrowski, M. Quijada, D. B. Tanner, J. P. Rice, D. M. Ginsberg, and T. Timusk, Phys. Rev. Lett. 74, 598 (1995).
- (9) R. Gagnon, S. Pu, B. Ellman, and L. Taillefer, Phys. Rev. Lett. 78, 1976 (1997).
- (10) B. Grévin, Y. Berthier, and G. Collin, Phys. Rev. Lett. 85, 1310 (2000).
- (11) Dirk K. Morr and Alexander V. Balatsky, Phys. Rev. Lett. 90, 067005 (2003).
- (12) S. R. White, I. Affleck, and D. J. Scalapino, Phys. Rev. B 65, 165122 (2002).
- (13) A study of Hubbard chains with alternating on-site energy has been done by K. Penc, and F. Mila, Phys. Rev. B 50, 11429 (1994).
- (14) S. Maekawa and T. Tohyama, Rep. Prog. Phys. 64, 383 (2001).
- (15) S. R. White, Phys. Rev. Lett. 69, 2863 (1992); Phys. Rev. B 48, 10345 (1993).
- (16) Y. Itoh, T. Machi, C. Kasai, S. Adachi, N. Watanabe, N. Koshizuka, and M. Murakami, Phys. Rev. B 67, 064516 (2003), and references therein.
- (17) H. J. Schulz, Physica 235 C, 217 (1994), and references therein.
- (18) See for example, M. Fabrizio and A. O. Gogolin, Phys. Rev. B 51, 17827 (1995).
- (19) N. Shibata, K. Ueda, T. Nishino, and C. Ishii, Phys. Rev. B 54, 13495 (1996).
- (20) W. Brenig, Phys. Rep. 251, 253 (1995) and references therein.
- (21) R. J. Cava, A. W. Hewat, E. A. Hewat, B. Batlogg, M. Marezio, K. M. Rabe, J. J. Krajewski, W. F. Peck, Jr. and L. W. Rupp, Jr., Physica C 165, 419 (1990).
- (22) M. Ogata, M. U. Luchini, S. Sorella, and F. F. Assaad, Phys. Rev. Lett. 66, 2388 (1991).
- (23) A. E. Sikkema, I. Affleck, and S. R. White, Phys. Rev. Lett. 79, 929 (1997); O. Zachar, Phys. Rev. B 63, 205104 (2001).
- (24) T. Mizokawa, C. Kim, Z.-X. Shen, A. Ino, A. Fujimori, M. Goto, H. Eisaki, S. Uchida, M. Tagami, K. Yoshida, A. I. Rykov, Y. Siohara, K. Tomimoto, and S. Tajima, Phys. Rev. B 60, 12335 (1999).