Supremacy distribution in evolving networks
Abstract
We study a supremacy distribution in evolving Barabasi-Albert networks. The supremacy of a node is defined as a total number of all nodes that are younger than and can be connected to it by a directed path. For a network with a characteristic parameter the supremacy of an individual node increases with the network age as in an appropriate scaling region. It follows that there is a relation between a node degree and its supremacy and the supremacy distribution scales as . Analytic calculations basing on a continuum theory of supremacy evolution and on a corresponding rate equation have been confirmed by numerical simulations.
pacs:
89.75.-k, 02.50.-rI Introduction
During the last few years there has been a large interest in modeling of networks BAa ; BAb ; 0a ; 0b ; Oc and several parameters describing the network structure have been considered. The examples are: degree distribution BAb ; Ka , mean path length 7a ; 8 ; 9a ; Agata2 , betweenness centrality (load) 9a ; b or first and higher order clustering coefficients c1 ; ffh1 ; Agata1 . Universal scaling has been observed for some of these parameters in computer simulations and in real data describing such objects as the Internet, WWW, scientific collaboration networks or food webs 0a ; 0b ; Oc . Here we introduce a new parameter that can play an important role for description of a class of directed networks. We name the parameter a supremacy since it describes the number of nodes that are subordinated to a certain node. In the next Section we define our parameter and show its relevance for different problems of complex networks, Sec. III includes a continuum theory for the supremacy time evolution and the supremacy probability distribution in the Barabasi-Albert (BA) model with , in Sec. IV we find and solve a corresponding rate equation while in Sec. V a generalization of our problem for the BA model with is presented.
II The model
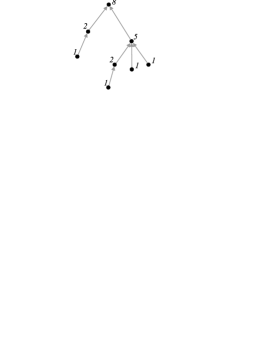
Let us consider the BA network with the characteristic parameter BAa ; BAb . At the moment a node is created and it attaches to some older node in the network according to the preferential attachment rule (PAR). Then in the next time steps other nodes are created and are attached to the node or to other nodes of the network following PAR. As a result at the moment there is a subgraph in a form of tree beginning in the node and containing all nodes that are younger than the node and that are connected to by directed paths as in Fig. 1. If we assume that the node represents a scientist who wrote an important paper or a politician who created an influential party jsp96 ; PhysA we can consider all nodes belonging to the tree as his/her successors. If the tree contains nodes then the number is the measure of the supremacy or the predominance of the node at time . The subgraph can be also interpreted as a cluster of connected sites in the directed percolation problem grass1 ; Cohen1 ; Cohen2 ; Agata3 ; n ; d and the supremacy of a node is just the size of such a cluster starting from the site . Since the evolution of the network is governed by PAR and all properties of the network are described by some probability distributions we are interested in the supremacy distribution in the network.
III Continuum theory of supremacy evolution and distribution for
To find the supremacy distribution we follow the method that was introduced in BAb for calculation of degree distribution in evolving networks. We start from determining the time dependence of assuming that it is a continuous real variable. The supremacy of the node increases in time because new nodes can be attached to any node of the tree . Let nodes belonging to the tree possess degrees .
Using the PAR we can write the following equation for changes of
| (1) |
where and we used the fact that at the moment the sum of all nodes degrees in the whole network equals to . On the other hand taking into account the tree structure of the considered subgraph we can write the supremacy as
| (2) |
thus and we have a simple equation
| (3) |
with the solution
| (4) |
where we took into account the initial condition . The solution (4) means that the node supremacy increases linearly in time comparing to the square root dependence of the node degree BAb , i.e. . Combining the last two results we get a simple relation between the node supremacy and the node degree
| (5) |
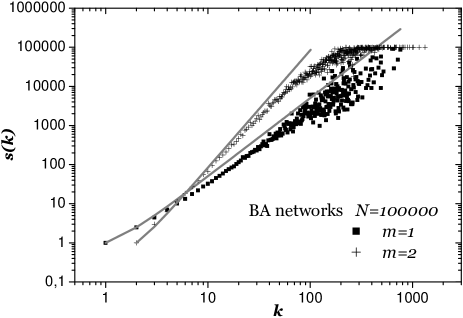
In the region this formula fits well to numerical simulations presented in Fig.2 while for larger differences between the analytic theory and the numerical simulations are observed.
The probability density for the supremacy distribution in the network follows from the relation
| (6) |
where is the distribution of nodes attachment times for a network of age . After a simple algebra we get
| (7) |
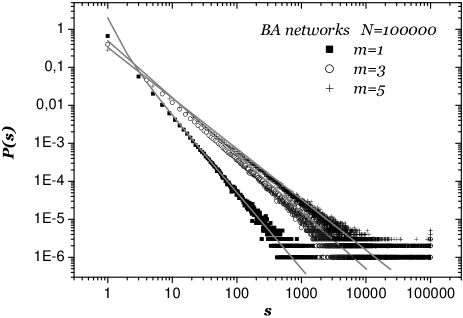
One can see that the supremacy distribution is a time independent function. Fig.3 shows the comparison of the last equation to numerical data. Let us stress that for the supremacy distribution scales as while the degree distribution for BA model BAa ; BAb scales as .
IV Rate-equation for supremacy distribution for
Now we show how to get the supremacy distribution using the rate-equation approach that was introduced by Krapivsky, Redner and Leyvraz Ka to study networks degree distribution . Let is the number of nodes possessing the supremacy at time . The rate equation for is
| (8) |
The first term on the right-hand side of Eq. (8) corresponds to creation of a new node with the supremacy . The process is proportional to the number of nodes with the supremacy and the corresponding transition probability that follows from the PAR and Eq. (2). The second term corresponds to creation of a node with a supremacy , i.e. to destruction of a node with a supremacy while the last term describes creation of a node with a supremacy . Writing where corresponds to the total number of nodes at time and is the probability of a node with the supremacy value we get the recursive equation
| (9) |
where . The solution of Eq. (9) is
| (10) |
Note that for the solution (10) coincides with the solution (7) that has been received in the limit of the continuum theory.
V Scaling of supremacy distribution for
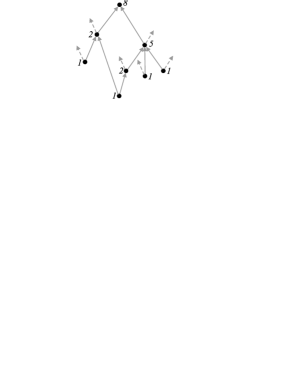
The peculiar feature of the BA model is the independence of the scaling exponent characterizing the degree distribution from the model parameter describing the number of links that are created by every new node. Below we show that the scaling exponent of supremacy distribution depends on the parameter . If we neglect all loops existing in the BA network with the characteristic parameter then we can easy repeat our considerations from Sec.III and IV. Instead of Eq. (2) we get
| (11) |
and time evolution of the supremacy is described by
| (12) |
thus the relation between the degree and the supremacy is
| (13) |
It follows that for dense networks with the supremacy increases in time much faster than the node degree . Fig. 2 shows a comparison of the result (13) to numerical data for . One can see that the predicted scaling of breaks down completely for large values of where the plot saturate. The reason is the presence of loops that for appear in the network and that have been neglected in our approach. If the result (13) is valid mainly for vertices with a small degree (and a small supremacy ) since loops are sparse in small clusters starting from such nodes. The saturation effect does not appear for the BA model with the parameter where loops are absent.
Taking into account (12) we get the supremacy distribution in the form
| (14) |
We see that the scaling exponent for the supremacy distribution equals to and in contrast to the scaling exponent of degree distribution it depends on the parameter . The result (14) is in a good agreement with numerical simulation for BA networks, see Fig. 3.
VI Conclusions
In conclusion, we introduced a universal parameter (a supremacy) that describes vertices in directed networks. The parameter equals to the size of a cluster starting from the site in a directed percolation model. We have shown that for Barabasi-Albert model there is a relation between the supremacy and the vertex degree. It follows that there are universal scaling laws describing the time evolution of the supremacy and corresponding supremacy distributions in BA models. On the contrary to the scaling results for nodes degree the corresponding scaling exponents of supremacy depend on the characteristic model parameter . Numerical simulations are in good agreement with analytical estimations for node with a small and medium supremacy especially for the case where no loops are present in the system.
VII Acknowledgments
The paper was supported by the special program of the Warsaw University of Technology Dynamics of Complex Systems.
References
- (1) A.L. Barabási and R. Albert, Science 286, 509 (1999).
- (2) A.L. Barabási, R. Albert and H. Jeong, Physica A 272, 173 (1999).
- (3) Handbook of Graphs and Networks, edited by S. Bornholdt and H.G. Schuster (Wiley-Vch, Weinheim, 2002).
- (4) S.N. Dorogovtsev and J.F.F. Mendes, Evolution of Networks, Oxford Univ.Press (2003).
- (5) R. Albert and A.L. Barabasi, Review of Modern Physics 74, 47 (2002).
- (6) P.L. Krapivsky, S. Redner and F. Leyvraz, Phys. Rev. Lett. 85, 4629 (2000).
- (7) M.E.J.Newman, C.Moore and D.J.Watts, Phys. Rev. Lett. 84 3201 (2000).
- (8) M.E.J.Newman, S.H.Strogatz and D.J.Watts, Phys. Rev. E 64, 026118 (2001).
- (9) G.Szabó, M.Alava and J.Kertész, Phys. Rev. E 66 026101 (2002).
- (10) A. Fronczak, P. Fronczak and J.A. Hołyst, cond-mat/0212230.
- (11) K.-I. Goh, B. Kahng, and D. Kim , Phys. Rev. Lett. 87, 278701 (2001).
- (12) D.J.Watts and S.H.Strogatz, Nature 393, 440 (1998).
- (13) A. Fronczak, P. Fronczak and J.A. Hołyst, cond-mat/0306255, Phys. Rev. E (in print).
- (14) A. Fronczak, J.A. Hołyst, M. Jedynak and J. Sienkiewicz, Physica A 316, 688 (2002).
- (15) K. Kacperski and J.A. Hołyst, J. Stat. Phys. 84, 169 (1996).
- (16) K. Kacperski and J.A. Hołyst, Physica A 269, 511 (1999); Physica A 287, 631 (2000).
- (17) P. Grassberger, Journ. Phys. A - Math. General 22, 3673 (1989); Journ. Stat. Phys. 79, 13 (1995).
- (18) A. Bunde and S. Havlin, in Fractals and Disordered Systems, edited by A. Bunde and S. Havlin (Springer, Heidelberg, 1996), 2nd ed.
- (19) R. Cohen, S. Havlin, and D. ben-Avraham, in Handbook of Graphs and networks, edited by S. Bornholdt and H.G. Schuster (Wiley-Vch, Weinheim, 2002).
- (20) A. Aleksiejuk and J.A. Hołyst, Physica A 299, 198 (2001).
- (21) M. E. J. Newman, S. H. Strogatz and D. J. Watts, Phys. Rev. E 64, 026118 (2001).
- (22) S. N. Dorogovtsev, J. F. F. Mendes and A. N. Samukhin, Phys. Rev. E 64, 025101(R) (2001).