Stress transmission through three-dimensional granular crystals with stacking faults
Abstract
We explore the effect of stacking fault defects on the transmission of forces in three-dimensional face-centered-cubic granular crystals. An external force is applied to a small area at the top surface of a crystalline packing of granular beads containing one or two stacking faults at various depths. The response forces at the bottom surface are measured and found to correspond to predictions based on vector force balance within the geometry of the defects. We identify the elementary stacking fault as a boundary between two pure face-centered-cubic crystals with different stacking orders. Other stacking faults produce response force patterns that can be viewed as resulting from repetitions of this basic defect. As the number of stacking faults increases, the intensity pattern evolves toward that of an hexagonal-close-packed crystal. This leads to the conclusion that the force pattern of that crystal structure crystal can be viewed as the extreme limit of a face-centered-cubic crystal with a stacking fault at every layer.
pacs:
PACS numbers: 81.05.Rm, 83.80.Fg, 45.70.CcI Introduction
Static packings of granular particles support stress in a nontrivial manner [1]. The forces on any given particle from all neighboring particles and from gravity must balance vectorally. Stress on a random granular pack is supported by a disordered network of these interparticle contacts in local force balance with each other [2, 3]. It has been suggested that elastic theory is capable of accounting for these inhomogenaities [4, 5]. However, the indeterminacy when the particles are infinitely hard, so that particle distortions are not allowed, has led to a search for alternative descriptions of the mechanical properties of granular materials in the hard-sphere limit [6, 7, 8, 9].
The proposed alternatives have had varying degrees of success. Coppersmith et al. proposed a diffusive q-model for the transmission of force through granular packings [2, 10], and a hyperbolic model was created by Cates et al. [11]. Experimentally it has been difficult to rule out any of these descriptions conclusively, but recently progress has been made in studying the conditions under which these models apply.
Much understanding and additional surprises have been gained from experiments studying the response to a localized external force, similar to a Green’s function. DaSilva and Rajchenbach [12] studied a two dimensional packing of rectangular photoelastic bricks. When applying an external force at the top of the packing they measured the response forces between neighboring bricks within the pack. The results showed that at a given depth the maximum interparticle force was located directly below the position of the applied force. Deeper in the packing (farther from the applied force) they found the width of this peak of maximum force to broaden as the square root of the depth. Similar results were found by Moukarzel et al. in recent displacement response experiments [13]. Such findings support diffusive models. However, a cross-over to a linear widening of the response peak cannot be ruled out for deeper packings. Reydellet and Clément looked at the response forces at the bottom surface of an amorphous three-dimensional packing of spheres [14]. Again they found the maximum force situated directly beneath the applied force, but now the width of the peak grew linearly with depth from the surface. This linear growth lends credence to the elastic theories. Similar elastic-type behavior was found in two-dimensional packings by Geng et al.. In addition those researchers also found a strong dependence on the spatial ordering of the particles [15, 16].
The importance of spatial ordering was further shown in three dimensional granular crystals in Ref. [17]. Within face-centered-cubic (FCC) crystals, the force was found to be supported along straight lines of contacts between beads, resulting in three areas of large force at the bottom surface in response to a locally applied external load at the top surface. In contrast, an hexagonal-close-packed (HCP) arrangement resulted in a ring of large force at the bottom surface. In both cases there was a local minimum of force directly beneath the point of application. Such patterns are reminiscent of the hyperbolic models, which predict straight-line propagation of forces. Bouchaud et al. have extended these hyperbolic models to include the splitting of force chains at defects within a granular packing [18]. Such splittings are predicted to lead to the elastic-like behavior that has been observed in amorphous packings.
It is, therefore, of interest to explore the regime between perfectly-ordered crystalline bead packs and completely amorphous arrangements. As a first step in this direction, we present an experimental study of the effect on the force propagation of a small number of stacking fault defects within otherwise perfectly ordered FCC crystals.
II Experimental Methods
Employing the triangular acrylic cell described by Blair et al. [20] and Mueggenburg et al. [17] and a ’by hand’ construction technique, we produced large FCC crystals of approximately soda lime glass spheres of diameter mm with an extremely low number of defects (estimated to be fewer than ten beads significantly out of place in the entire pack) oriented as horizontal planes of triangular order. Furthermore, we carefully controlled the stacking of the planes in order to create true three-dimensional crystals and to introduce stacking faults at specific locations.
In this manner, we constructed five different granular FCC crystals, each having one or two defects in the stacking order. We then applied an impulsive force to a small region, approximately two beads in diameter, centered on the top of the crystal [17]. Using a carbon paper technique, we characterized the normal forces on the top and bottom surfaces of the crystal in response to this force [2, 3, 17, 19, 20]. A piece of carbon paper was sandwiched between the crystal and a piece of white paper on both the top and bottom surfaces of the crystal. The applied force caused individual beads to press into the carbon paper and leave marks on the white paper. These marks were then digitized and image analysis software was used to calculate the area and intensity of each mark [17].
We conducted twenty experimental runs on each crystal. For each run the resultant carbon marks were aligned with the expected triangular lattice. The areas and intensities were averaged over experimental runs and, in order to improve statistics, were averaged over symmetries of the crystal (one reflection and two rotations) when such averaging did not qualitatively alter the intensitiy patterns.
III Results
A pure FCC crystal consists of layers of triangular order stacked in such a way that every third layer lies on top of the first. We annotate this stacking as A stacking fault corresponds to a disruption of this order and may be considered to be a boundary between two pure FCC crystals with different stacking orders.
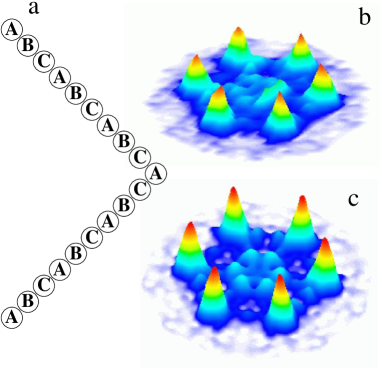
We constructed a layer crystal with a stacking fault centered at the tenth layer. This stacking is represented as The underline represents one pure FCC crystal, while the overline corresponds to a second pure FCC crystal with a different orientation. At the boundary between the two crystals there exists an layer which correctly matches both stacking orders and can thus be considered to be in both crystals. Note that, by necessity, the three layers centered around the stacking fault follow an hexgonal-close-packed stacking order. When applying a quick impulse to a small area at the center of the top of this crystal, the bottom surface displayed six regions of large force at the vertices of a regular hexagon as shown in figure 1. The regions of large force are approximately the same size as the area over which the impulse was applied on the top surface. We observed another region of larger than background force inside the hexagon, but closer to one face. At other symmetric places of the pattern, areas of larger than background force are present, but with much lower intensity. It is not clear if this area of heightened force is a real feature of the crystal with stacking fault or if this is merely an extreme fluctuation. Averaging over crystal symmetries would accentuate such fluctuations, and thus we also show the intensity pattern without this averaging.
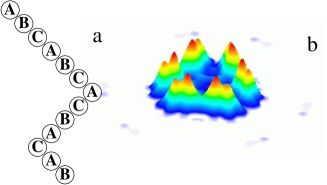
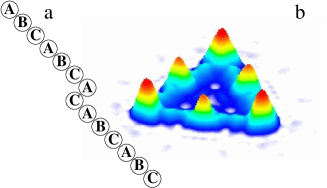
Additionally, we explored possible assemblies of crystals with two stacking faults. Figure 2 represents a layer FCC crystal with stacking faults at the seventh and eleventh layers. The stacking order (from top to bottom) was as shown schematically in figure 2(a). We found that this crystal produced a twelve-peaked intensity plot (Figure 2b). The plot shows two pairs of peaks of nearly equal height aligned along the faces of an equilateral triangle. Each pair of peaks is approximately four beads wide and the separation between pairs is approximately three beads.
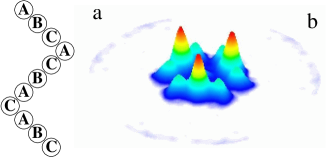
Another crystal with two stacking faults consisted of eleven layers with faults centered at the fourth and eighth layers (). For this crystal, we found three tall peaks flanked by peaks half the height of the taller ones arranged along the faces of an equilateral triangle (Figure 3). The width of each of the taller peaks was slightly larger than that of the smaller flanking peaks which correspond to the width of the area over which the force was applied at the top surface.
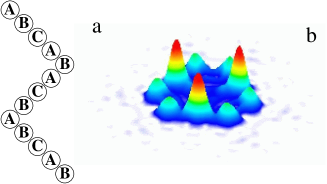
The next crystal we built contained thirteen layers with faults at the fifth and ninth layers. The stacking order was . We found an intensity pattern (Figure 4) similar to that of the previous crystal with two faults. This crystal produced three tall peaks flanked by peaks about one third the height of the taller peaks arranged along the faces of an equilateral triangle. The taller peaks were approximately three beads wide and the shorter peaks were approximately two beads wide. In contrast to figure 3, which corresponds to a crystal with fewer layers above and below the stacking faults, the flanking peaks are now farther away from the taller peaks.
Another possible type of stacking fault involves the omission of one plane from a large FCC crystal. This fault maintains the orientation of the crystal above and below the fault and thus might be considered a more basic defect than the grain boundary described above. However, this fault could be described as a special case of two grain-boundary faults. Figure 5 shows the results for a crystal with layer stacking . Although one might suppose that this crystal exhibited the least amount of stacking disorder, we found that the force intensity pattern consisted of six approximately equal-height peaks, one at each of the vertices of an equilateral triangle and one at each of the midpoints of the sides (Figure 5). The peaks at the vertices of the triangular pattern are four beads in width while those on the sides are three beads wide. We describe this pattern below as a special case of the nine or twelve peaks shown in the crystal packings with two faults.
IV Discussion
As in the experiments performed on pure FCC crystals by Mueggenburg et al. [17], we can reconstruct the force chain paths through the crystal based on the force intensity plots from the experiments. More importantly, the simple force balance model used to explain the force patterns in that study, also explains the present results.
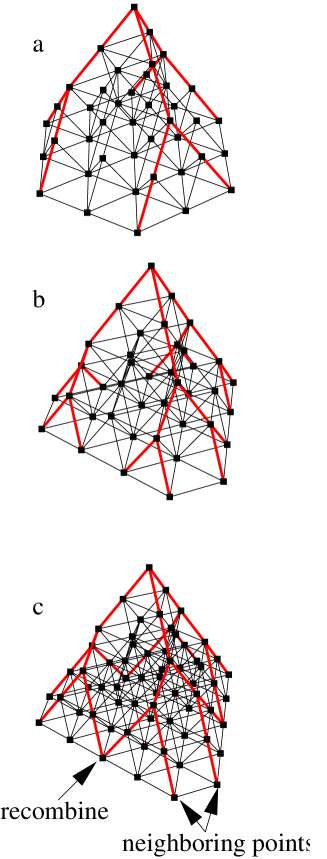
Forces will travel through pure FCC sections of the crystal, along the spines of a tetrahedron. Thus, to understand an elementary stacking fault, all we need to determine is what happens at the interface between two FCC crystals with different orientations. Again, the force balance model can be applied. In order to maintain force balance at the interface, the force chain must split. Note that locally this is the same geometry as an HCP crystal. Below the stacking fault each of the new forces will travel through the lower portion of the crystal in straight line paths. Figure 6(a) illustrates this force splitting at a grain boundary.
We found a regular hexagonal pattern of force in our first crystal because the fault was placed in the middle of the packing. In general, we would expect a six-peaked pattern in which two peaks reside along each side of a triangle. As the defect is moved higher or lower in the crystal, these pairs of peaks would move towards or away from each other.
It is simple to extend this idea to crystals containing two stacking faults. The crystal can be thought of as three pure FCC crystals with top and bottom sections having the same stacking order and the middle section having a different stacking order. At each interface the force splitting process is repeated resulting in twelve peaks in the intensity pattern (3 split into 6 and then split into 12). Figure 6(b) illustrates this multiple splitting process. However, most of our results do not demonstrate the expected twelve-peaked pattern. This can be explained by force recombination.
For certain combinations of stacking faults, the forces will converge upon the same lattice point on the bottom of the crystal. In other cases, two forces could travel along parallel lines through the crystal and arrive at neighboring lattice points on the bottom surface. In the former scenario, the force intensity at the convergence point should be twice the intensity of a lattice point with only one line of force. In the latter scenario, the forces should produce a wider than normal peak (the exact width would depend upon the width of the applied impulse and the separation of the force chains within the packing). These two effects account for our observed force patterns from crystals with two faults.
In the second and third crystals with two stacking faults (Figures 3 and 4), the taller central peaks are places where forces have recombined and the smaller flanking peaks correspond to single force chains. The widths of the peaks corroborate this explanation in both cases. The fourth example, where one plane of the lattice has been removed, can be categorized as a crystal with two stacking faults in which the twelve peaks have been reduced to six due to this recombination. The corner peaks in the intensity plot (Figure 5) are caused by parallel forces terminating at adjacent lattice points and the side peaks are caused by two forces terminating at the same lattice point as shown in figure 6(c). The widths of the peaks support this explanation. This is the extreme case of the trend from figure 3 to figure 4 where the flanking peaks moved towards the corners of the triangular pattern as the spacing between defects relative to the overall crystal height decreased. In the case, where the two defects occur at successive layers, the flanking peaks are positioned very near the corners and thus overlap with each other.
V conclusions
In this study, we have established how stacking faults affect the transmission of stress through an FCC crystalline granular assembly. We have observed that the force chains split into two equal components at the boundary between different FCC crystal orientations. However, we note that the forces are transmitted as in a pure FCC crystal before and after splitting. Our findings reinforce those in reference [17] and the force balance model proposed therein.
We have identified the elementary stacking fault defect as the boundary between two pure FCC crystals of different stacking orders. All further stacking faults can be described as repetitions of this basic defect. Alternately, we can express the stacking faults as sections of HCP crystals within the overall FCC crystal. Although we find the grain-boundary description the most lucid, this other interpretation is geometrically equivalent.
As the number of stacking faults increases, the intensity pattern looks increasingly like that of an HCP crystal, and indeed the local stacking order around a fault is HCP. This leads to the conclusion that the force pattern of an HCP crystal can be viewed as the extreme limit of an FCC crystal with a stacking fault at every layer.
VI Acknowledgments
This work was supported by NSF-CTS 0090490 and by the NSF MRSEC Program under DMR-0213745. MJS acknowledges support by the University of Chicago MRSEC Summer 2002 REU program.
REFERENCES
- [1] H. M. Jaeger, S. R. Nagel, and R. P. Behringer, Physics Today 49, 32 (1996); Rev. Mod. Phys. 68, 1259 (1996).
- [2] C.-h. Liu, S. R. Nagel, D. A. Schecter, S. N. Coppersmith, S. Majumdar, O. Narayan, and T. A. Witten, Science 269, 513 (1995).
- [3] D. M. Mueth, H. M. Jaeger, and S. R. Nagel, Phys. Rev. E57, 3164 (1998).
- [4] C. Goldenberg and I. Goldhirsch, Phys. Rev. Lett.89, 084302 (2002).
- [5] I. Goldhirsch and C. Goldenberg, European Physical Journal A 9 245 (2002).
- [6] J. -P. Bouchaud, M. E. Cates, and P. Claudin, J. Phys. (France) I 5, 639 (1995).
- [7] J. P. Wittmer, P. Claudin, M. E. Cates, and J. -P. Bouchaud, Nature (London) 382, 336 (1996); J. P. Wittmer, P. Claudin, M. E. Cates, J. Phys. (France) I 7, 39 (1997).
- [8] S. F. Edwards, Physica A 249, 226 (1998).
- [9] D. A. Head, A. V. Tkachenko, and T. A. Witten Eur. Phys. J. E 6, 99 (2001).
- [10] S. N. Coppersmith, C. Liu, S. Majumdar, O. Narayan, and T. A. Witten, Phys. Rev. E53, 4673 (1996).
- [11] M. E. Cates, J. P. Wittmer, J. -P. Bouchaud and P. Claudin, Phys. Rev. Lett.81, 1841 (1998).
- [12] M. DaSilva and J. Rajchenbach, Nature (London) 406, 6797 (2000).
- [13] C. Moukarzel, H. Pacheco-Martínez, J. Ruiz-Suarez, and A. Vidales, eprint: cond-mat:0308240 (2003).
- [14] G. Reydellet and E. Clément, Phys. Rev. Lett.86, 3308 (2001).
- [15] J. Geng, D. Howell, E. Longhi, R. Behringer, G. Reydellet, L. Vanel, E. Clement, and S. Luding, Phys. Rev. Lett.87, 035506 (2001).
- [16] J. Geng, G. Reydellet, E. Clément, R. Behringer, Physica D 182 274 (2003).
- [17] N. W. Mueggenburg, H. M. Jaeger, S. R. Nagel, Phys. Rev. E66, 031304 (2002).
- [18] J. Bouchaud, P. Claudin, D. Levine, and M. Otto, Eur. Phys. J. E 4, 4 (2001).
- [19] F. Delyon, D. Dufresne, and Y.-E. Lévy, Ann. Ponts Chaussees 22 (1990).
- [20] D. L. Blair, N. W. Mueggenburg, A. H. Marshall, H. M. Jaeger, and S. R. Nagel, Phys. Rev. E63, 041304 (2001).