2Department of Material Physics, University of the Basque Country, Centro Mixto CSIC-UPV/EHU, and Donostia International Physics Center (DIPC), Paseo Manuel de Lardizabal 4, 20018 San Sebastián, Spain
Optical absorption and electron energy loss spectra of carbon and boron nitride nanotubes: a first principles approach.
Abstract
We present results for the optical absorption spectra of small-diameter single-wall carbon and boron nitride nanotubes obtained by ab initio calculations in the framework of time-dependent density functional theory. We compare the results with those obtained for the corresponding layered structures, i.e. the graphene and hexagonal BN sheets. In particular, we focus on the role of depolarization effects, anisotropies and interactions in the excited states. We show that already the random phase approximation reproduces well the main features of the spectra when crystal local field effects are correctly included, and discuss to which extent the calculations can be further simplified by extrapolating results obtained for the layered systems to results expected for the tubes. The present results are relevant for the interpretation of data obtained by recent experimental tools for nanotube characterization such as optical and fluorescence spectroscopies as well as polarized resonant Raman scattering spectroscopy. We also address electron energy loss spectra in the small-q momentum transfer limit. In this case, the interlayer and intertube interactions play an enhanced role with respect to optical spectroscopy.
Pacs71.45.Gm,77.22.Ej,78.20.Bh,78.67.Ch
1 Introduction
The science of nanostructures is one of the fields of growing interest in materials science. Nanotubes, in particular, are of both fundamental and technological importance; being quasi-one-dimensional (1D) structures, they possess a number of exceptional properties. While the peculiar electronic structure – metallic versus semiconducting behavior – of carbon nanotubes depends sensitively on the diameter and the chirality, i.e., on the way the graphene sheet is wrapped up into a tube dressbook , boron nitride (BN) tubes display a more uniform behavior with a wide band-gap (larger than 4 eV), almost independent of diameter and chirality bnrubio ; bnblase . The potential applications of nanotubes in nanodevices are numerous Nano : super-tough nanotube fibres Dal , gas sensors Modi , field effect displays field , and electromechanical devices Fenni , to name only a few. One of the most spectacular examples is the realization of field effect transistors both with carbon nanotubes Tan ; Mar and with BN-nanotubes Rado .
Since carbon and BN nanotubes are routinely produced in gram quantities, the challenge now consists in having fast experimental tools for characterization of nanotube samples and, if possible, single isolated nanotubes. Optical spectroscopic techniques provide us with this tool optical ; STS ; resraman ; bac03 ; hagen ; lefebvre . The final goal is to find a unique mapping of the measured electronic and vibrational properties onto the tube indices . To that end, the electronic structure and dielectric properties of the tubes are two key areas to study. One possible spectroscopic method is optical absorption spectroscopy with direct excitations from occupied to unoccupied states. For carbon tubes, the energy difference between corresponding occupied and unoccupied van Hove singularities (VHSs) in the 1-dimensional electronic density of states (DOS) is approximately inversely proportional to the tube diameter . In resonant Raman spectroscopy resraman and scanning tunneling spectroscopy STS , this scaling is employed for the determination of tube diameters (and indexes in resonant Raman jorio ). A recent example is the fluorescence spectroscopy of single carbon tubes in aqueous solution, where is probed through the frequency of the excitation laser and is probed simultaneously through the frequency of the emitted fluorescent light bac03 . Also optical absorption spectroscopy of nanotubes in aqueous solution hagen allows for the spectral resolution of peaks that can be associated with distinct types of nanotubes. For the distance between the first VHSs in semiconducting carbon tubes, a simple -electron tight-binding fit yields the relation , where is the distance between nearest-neighbor carbon atoms. The value for the hopping matrix element varies between 2.4 eV and 2.9 eV, depending on the experimental context in which it is used. This fact is a clear indication that the above relation gives only qualitative and not quantitative information on the tube diameter and/or chirality. Furthermore, for small-diameter tubes the band structure completely changes with respect to the band structure of large diameter tubes, including a reordering of the VHSs in the density of states and displaying fine structure beyond the first and second VHSs tube_prl ; kirchberg . This structure sensitively depends on the tube indices and may be probed by optical absorption spectroscopy over a wider energy range, possibly extending into the UV regime.
The spectroscopical characterization of macroscopic tube samples is made difficult by the fact that in the bulk solid and even in bundles the tubes are not perfectly aligned and do not have a well defined diameter and helicity, rendering, in the case of carbon tubes, a random mixture of semiconducting and metallic tubes exp . Additionally, the role of intertube interaction in the spectra needs to be addressed since the tubes are close packed and could interact with each other via long-range forces induced by the excitations. Only very recently optical absorption spectra were reported for aligned single-wall carbon tubes of a very narrow diameter distribution (40.2 Å) grown inside the channels of a zeolite matrix Li01 . Geometric arguments predict three possible tubular helicities for the range of diameters around 4 Å: the armchair (3,3), the zig-zag (5,0) and the chiral (4,2) configuration. Therefore, this particular case serves as an important case study where a direct comparison between experimental data and theoretical calculations becomes possible. Indeed in Ref. tube_prl we have shown the relevance of a first-principles calculation for these small-diameter carbon nanotubes by reproducing the polarization dependence of the measured optical spectra.
At present, the dielectric response of tubes in the frequency range of the electronic interband transitions and the collective excitations (plasmons) of the valence electrons (up to 50 eV) is not well understood since previous studies focused on the low-energy regime and excitations And ; lowE . For higher frequencies, up to now, the majority of the theoretical studies of the response, besides model calculations mode , are mostly limited to summing over independent band-to-band transitions obtained within the semi-empirical tight-binding method Lin or the density-functional theory (DFT) framework Li01 ; DFT1 ; DFT2 , or to calculations of the joint density of states (JDOS) jdos which use the bandstructure with no explicit evaluation of the transition matrix elements. As we will show below, these approximations are not sufficient for a full interpretation of the experiments. This shortcoming is not due to the quality of the bandstructure calculation itself but instead due to the neglect of the induced microscopic components in the response to the external field, the local field effects (LFE) tube_prl . These effects strongly modify the total response for certain polarizations of the external perturbation. Also, induced exchange and correlation (XC) components obtained beyond the random-phase approximation (RPA) might contribute And ; REV . Therefore, important questions concerning the electron interaction, excitations and screening still remain unanswered. Our approach here is to determine the spectra by ab-initio calculations incorporating important ingredients of the electron response as in previous works tube_prl ; kirchberg .
The present paper is organized as follows: after an exposition of the theoretical framework in section 2, we present in section 3 ab initio calculations of optical spectra of small single-wall carbon and boron nitride nanotubes. We identify the influence of crystal LFE, XC effects and intertube interaction in the spectra. We also point out the similarities and differences between carbon and BN structures which are related to similarities and differences in the respective electronic band structures. A certain number of comparisons with experiment allows us to verify that the chosen ab initio approach is an important improvement and well suited for the description of the spectra of these systems. In section 4, we analyse the spectra of the building blocks of the tubes, i.e. the graphene and hexagonal BN sheets (layers) including the optical spectrum of graphite. This gives information about the the interaction between objects (sheet-sheet) in the excited state, even when these objects can be considered to be isolated in the ground state. We also discuss to which extent the dielectric response of the tubes can be understood in terms of the response of the sheets. This will help to understand whether some aspects of the response of the tubes are inherent to the sheets, and if so, they could also be observed in other systems of more practical interest, e.g. samples comprising a mixture of tubes with different diameters and orientation or multiwall tubes. In section 5, we present results for electron energy loss in order to have some additional validation from existing experimental data, and because a comparison between optical and loss spectra allows a deeper discussion and understanding of interaction effects. Finally, we conclude with section 6, with an overall discussion of the results.
2 Theoretical Framework
Ab initio calculations in the framework of Density Functional Theory (DFT) have yielded high-quality results for a large variety of systems: from molecules to periodic solids and structural defects dft_book . These results are however mostly limited to quantities related to the electronic ground state, whereas additional phenomena that occur in the excited state are not correctly described self . In particular, the self-consistency between the total perturbing potential and the charge response induces Hartree and exchange-correlation potentials that have to be dealt with. The former give rise to the so-called local field effects, whereas the latter can lead, for example, to excitonic effects. Today, in the solid state ab initio framework two main approaches can include both LFE and XC effects REV and can be therefore suitable for the description of electronic excitations in nanostructures. First, Green’s functions approaches within many-body perturbation theory: here one adds self-energy corrections to the DFT Kohn-Sham bandstructure and the electron-hole interaction is included via the solution of the Bethe-Salpeter equation REV . This approach has given excellent results for various bulk and finite systems, but it is computationally very cumbersome and not ready yet to be applied systematically to more complex systems. The time-dependent Hartree-Fock (TDHF) method represents a certain level of approximation within this approach, where correlation (i.e. screening) in the self energy is neglected. LFE, on the other hand, are still retained. TDHF has been employed, up to now in a semi-empirical way, to calculate optical spectra, including excitons, of carbon nanotubes And and also for the 4 Å-diameter ones TDHF . However, the obtained absorption peak assignments in the latter case were in disagreement with predictions based on the operative dipole selection rules for the specific tubular space groups Li01 ; DFT1 . This suggests that in such systems with important metallic character a neglect of screening may lead to problems.
The second way to calculate spectra is given by the time-dependent DFT (TDDFT) RGK , where all manybody effects are embodied in the exchange-correlation potential and kernel. It is in practice an approximate way but always treats the variations of the Hartree potential exactly (right as in both the Green’s functions and TDHF approaches). This approach, using the (static) adiabatic local density approximation (TDLDA) for the XC effects, or even completely neglecting the density variations of the XC potential (RPA, on the basis of an LDA bandstructure) has been applied successfully to many finite and infinite systems REV . In particular, excellent results for the loss spectra of graphite have been obtained using this approximation gra1 . This is the approach we follow in the present work.
As a first step in our TDDFT approach, we determined the electronic ground state of the systems. The Kohn-Sham single-particle equations were solved self-consistently in the LDA for exchange and correlation HOKS . For the description of the valence-core interaction we have used norm-conserving pseudopotentials which were generated from free-atom all-electron calculations TM . For the “isolated” geometries of the tubes and of the sheets we calculated periodic arrays with a large distance between the building blocks in a supercell geometry, in order to minimize the mutual interaction. The crystalline valence-electron wavefunctions were expanded using a plane-wave basis set (with an energy cutoff of 62 Rydberg for carbon systems, and 50 Rydberg for BN systems). A part of the calculations was carried out using the ABINIT code abinit .
The next step is the linear response calculation of the independent particle polarizability EHR59 ; notechi . It involves a sum over excitations from occupied bands to unoccupied bands:
| (1) |
where means that the indices and of the first term are exchanged. The result is checked for convergence with respect to the number of bands nvalues and the discrete sampling of k-points within the first Brillouin zone.
Within TDLDA, the full polarizability is connected to viaPet96
| (2) |
where VC is the bare Coulomb interaction and , the so-called exchange-correlation kernel, is the functional derivative of the LDA exchange-correlation potential with respect to the electron density. By setting to zero, exchange and correlation effects in the electron response are neglected and one obtains the Random-Phase Approximation (RPA). We have carried out our calculations in the RPA and also in the TDLDA for certain cases. The inverse dielectric function for a periodic system and momentum transfer is obtained from:
| (3) |
with in the first Brillouin zone and , are reciprocal lattice vectors. The absorption spectrum is obtained as the imaginary part of the macroscopic dielectric function
| (4) |
whereas the loss function for a transferred momentum is given by . In inhomogeneous systems, e.g. periodic solids, clusters and structural imperfections the inhomogeneity in the electron response gives rise to local field effects (LFE) and the cannot be considered as being purely a diagonal matrix. Therefore, its off-diagonal elements have to be included in the matrix inversion. Making the approximation corresponds to neglecting the inhomogeneity of the response, i.e. to neglecting the LFE. When these effects are neglected and, moreover, all transition matrix elements in are supposed to be constant, one arrives at the widely used approximation that the absorption spectrum is proportional to the JDOS, i.e. proportional to the sum over interband transitions from occupied () to empty () states over the Brillouin zone points , .
3 Optical Absorption Spectrum for carbon and BN tubes
Let us first look at the optical absorption spectra of small-diameter carbon nanotubes (all three possible helicities), for which experimental results have recently become available. The calculations of the spectra calcc were done for the tubes arranged in a hexagonal lattice with an intertube distance (distance between tube walls), equal to 5.5 Å which leads to nearly isolated tubes. Additionally, for the (3,3) armchair ones we repeated the calculations for a solid with a smaller intertube distance, 3.2 Å, which is close to the interlayer distance in graphite ( 3.4 Å).
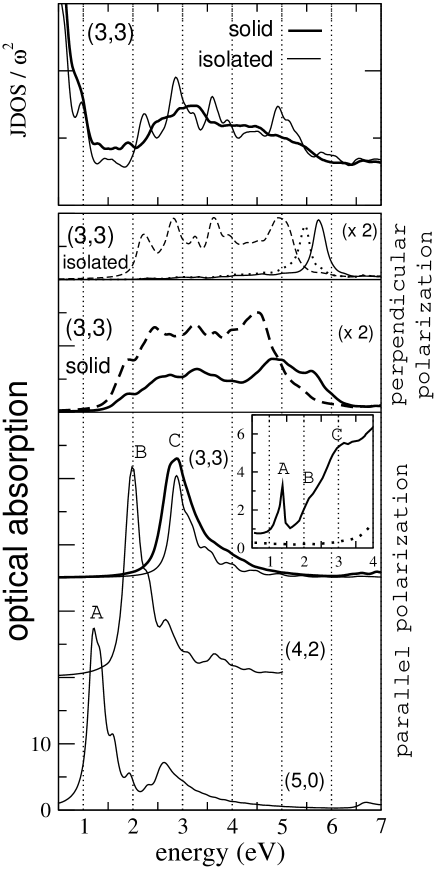
The optical absorption spectra for the small diameter tubes are diplayed in Fig. 1 (as well as JDOS curves for two cases). In the upper panel of the Figure, the JDOS divided by the square of the excitation energy, for the (3,3) nearly isolated (thin line) and interacting (in the solid) (thick line) tubes are shown. It can be seen that after an initial very steep decrease ( 1 eV), in both JDOS curves there is a gradual increase starting from 2 eV. In the case of isolated tubes a sequence of pronounced peak structures up to 5 eV is observed: this can be explained from the occurrence of direct interband transitions between the van Hove singularities of the density of states (DOS). These peaks are smeared out in the JDOS of the solid where the tubes are strongly interacting ANGEL . In the lower panels of Fig. 1 the calculated absorption spectra for light polarizations perpendicular and parallel to the tube axis are displayed (as well as the experimental data plotted in the inset). The dashed lines denote results in the RPA neglecting LFE, continuous lines including LFE. For parallel polarization both LFE and LDA-XC effects were found to be negligible and, therefore, in this case only the RPA results without LFE are presented. The fact that both these effects turned out to be negligible can explain why the peak positions (A, B and C) predicted here for the parallel polarization match very well the ones found in two recent DFT-RPA studies DFT1 , which completely neglected LFE and XC effects in the response. Our calculated peak positions (A, B and C) in Fig. 1 are in good agreement (to within 0.2 eV) with the experimentally observed peak structures for the parallel polarization (inset).
It is also important to note that the present results support the same peak-to-helicity assignment as in previous works Li01 ; DFT1 . Namely, the three observed peaks – A, B and C – are due to the (5,0), (4,2) and (3,3) tubes, respectively. Such an assignment is also in accordance with the dipole selection rules for these tubular space groups Li01 ; DFT1 .
Concerning the effect of intertube interaction in the absorption we found that it is rather small for this polarization: tube-tube interaction leads only to a broadening of the main absorption peak (thick solid curve for the (3,3) tubes). This can be explained from an increase of the energy range of the possible interband transitions brought about by the interaction.
All the discussion of the results up to now seems to indicate that LFE may not be needed. Nonetheless, for light polarizations perpendicular to the tube axis – due to the presence of depolarization – LFE play an important role which cannot be ignored. More specifically, for this polarization the experimental spectrum displays vanishing intensity for frequencies up to 4 eV Li01 (see inset in Fig. 1, dotted curve). Clearly, neither the JDOS calculation nor the calculated spectrum without LFE can capture this effect. Instead, they both predict a series of peaks from 2 to 5 eV. The reason that RPA-without-LFE fails here is due to the depolarization effect tube_prl ; And ; BENE which is created by the induced polarization charges. The depolarization is only accounted for if LFE are included: as it can be seen in Fig. 1 (second panel; continuous curve) LFE suppress the low-energy absorption peaks and render the tubes almost transparent below 5 eV in agreement with the experiment. It should not come, therefore, as a surprise that the recent DFT-RPA studies DFT1 (which did not consider LFE) did not reproduce this transparency for the perpendicular polarization.
The TDLDA result, displayed as the dotted curve in the second panel, turned out to be qualitatively similar to the RPA-with-LFE result: again the low-energy absorption peaks are suppressed. This shows that the main effect comes from fluctuations of the Hartree-, and not from those of the XC-potential (as also obtained for the case of graphite gra1 ). LDA-XC effects only cause a small (0.3 eV) redshift of the remaining absorption peak to 5.5 eV, with respect to RPA-with-LFE. This is a characteristic behavior of finite systems REV . Still there is an open question about the role of electron-hole interaction in the case of the small band-gap (4,2) tube excilou , however the good agreement with experiment indicates that its contribution should be small for the parallel polarization.
LFE also have a similar drastic impact for the system of isolated zig-zag (5,0) tubes (not shown). The manner according to which LFE operate may be understood as follows: for perpendicular polarization the tubes form an assembly of almost isolated, but highly polarizable, objects. An applied external field induces hence a local, i.e. microscopic, response - the LFE - which strongly weakens the total perturbation (i.e. it is a “depolarization”). The macroscopic response to this weak perturbation is only very moderate, because the electrons are localized on the tubes. This is totally different from the screening in a bulk metal or small-gap semiconductor, where even a very weak total perturbation still leads to a strong response at low frequencies. For polarization parallel to the tube axis, the situation resembles rather this latter case, something which explains the absence of LFE for this polarization. On the other hand – for the perpendicular polarization – when the tubes are interacting in the solid (third panel) the depolarization is much weaker: the tubes start to absorb (they are no longer transparent) because the electronic states start to delocalize and the system is now more similar to a bulk metal. This different behavior of the response depending on the intertube distance leads to a very important consequence: it suggests that the inter-tube interaction can be detected experimentally in a qualitative study of the absorption spectra for perpendicular light polarizations.
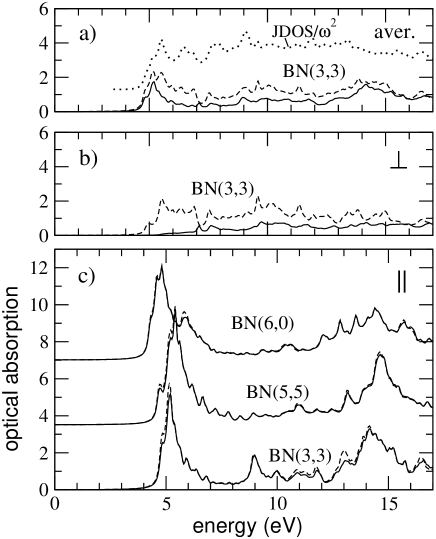
In Fig. 2 we present optical absorption spectra for three different BN nanotubes. First, we compare for the case of the BN(3,3) tube the spatially averaged spectrum with the joint density of states (JDOS), divided by the square of the transition energy. If local field efffects are neglected, most peaks of the JDOS are visible in the averaged absorption spectra while some peaks are suppressed due to small or vanishing oscillator strength in Eq. (1). This demonstrates that the fine structure in the spectra is not an artifact of low k-point sampling but is due to the presence of van-Hove singularities in the 1-dimensional density of states of the tubes. Proper inclusion of LFE leads to a smoothing of the spectrum. However, some fine structure survives and may be discernible in high-resolution optical absorption experiments. The spectrum with perpendicular polarization demonstrates that for BN nanotubes, depolarization effects play a similarly important role as for carbon tubes: Neglecting LFE, the onset of absorption would be around 4.5 eV. LFE, however, lead to a redistribution of the oscillator strength to higher energies and render the tubes almost transparent up to 8 eV. The band gap of BN nanotubes in DFT-LDA is 4 eV and is only weakly dependent on radius and chirality bnrubio ; bnblase . Accordingly, the absorption spectra for polarization parallel to the tube axis are very similar for the (3,3), (5,5), and (6,0) tubes which all display a strong absorption peak around 5 eV and a second high peak around 14 eV. We expect these structures to be stable also for tubes with larger diameters. Only the fine structure of the spectra (e.g., the absorption peak at 9 eV for the (3,3) tube) depends on the details of the band-structure and varies for the different diameters and chiralities kirchberg . For the (6,0) tube, the first high absorption peak is split and the dominant peak shifted towards lower energy. This is a curvature effect which leads to a reduction of the band-gap for small zigzag BN tubes.
In the next section we will see to which extent the above findings for carbon and BN nanotubes can be understood by an analysis based on results for graphene and BN sheets and graphite.
4 Optical Absorption Spectrum for graphite and the graphene and BN sheets
Hexagonal graphite has the ABA Bernal stacking sequence of the graphene sheets. In the present work we assumed the experimental lattice parameter ahex and (c/a)hex ratio (2.46 Å and 2.73, respectively latt ).
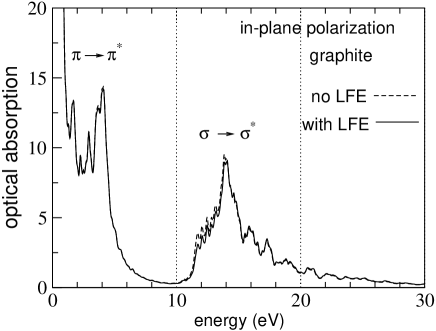
The calculated RPA optical absorption spectra footcalc , with and without LFE, are shown in Fig. 3 for in-plane light polarization (E c) and in Fig. 4 (a) for polarization parallel to the c axis (E c). The in-plane spectrum is dominated by a very intense peak structure at low frequencies (up to 5 eV) and also another peak structure of broader frequency range which sets in beyond 10 eV and has a pronounced peak at 14 eV. The origin of these peak structures is due to and interband transitions, respectively, according to the earlier interpretations by Bassani and Paravicini BAS67 who assumed a two-dimensional approximation – no interaction between the graphene sheets – and the operative dipole selection rules for this polarization. Our calculations of the oscillator strength for specific transitions between bands in the Brillouin zone (BZ) are in agreement with their interpretation.
LFE are found to be nearly negligible for this polarization. This is not surprising since for in-plane polarizations graphite is homogeneous in the long-wavelength limit (). The general aspects of the spectrum – peak positions, their intensity and lineshape – are in close agreement with the existing experimental results exp2 and the previous all-electron calculation of Ahuja et al. AHU97 who neglected LFE.
The absorption spectrum of graphite for the light polarization parallel to the c axis is shown in Fig. 4 (a). It is characterized by a weak intensity in the low frequency range (0-5 eV) and important peaks in the frequency range beyond 10 eV. For this polarization the bandstructure does not play the exclusive direct role in defining the absorption spectrum. Now LFE are very important. When LFE are not considered the peak positions for this polarization are at 11 and 14 eV as in the earlier DFT-RPA calculation AHU97 . However, when LFE are included transitions are mixed and the absorption spectrum is appreciably modified. The main effect of local fields is to shift the oscillator strength at 10-15 eV to higher frequencies. They decrease the intensity of the 11 eV peak and are responsible for the appearance of the 16 eV peak in the spectrum. The latter peak is seen in experiments as a shoulder suggesting that the inclusion of LFE is necessary.

The non-zero oscillator strength found below 5 eV is attributed to the inter-layer interaction which is present in the solid. It is also observed experimentally. The dipole selection rules BAS67 for an isolated graphene sheet (i.e. complete two-dimensionality) lead to vanishing matrix elements and oscillator strength at this frequency range. LFE do not have any influence on the lower part of the spectrum (less than 10 eV).
The existing experimental evidence is not conclusive for the dielectric function in the 11 eV frequency region. The frequency-dependent Im[] obtained from electron energy loss data Zep-th ; ToBa ; Veng displays a very sharp and intense peak (Im[]=10) at 11 eV. On the other hand, on the basis of optical measurements KLU74 the observed maximum at this frequency is of considerably smaller intensity. The earlier interpretations band were based on semi-empirical tight-binding bandstructure calculations in the two-dimensional approximation (i.e. isolated graphene layers) and they predicted peak structure between 13.5 and 16.5 eV.
It is therefore also important to understand the effect of the inter-layer interaction in the optical response and if this interaction is primarily responsible for the occurrence of the intense peak at 11 eV. For this purpose, we progressively increased the inter-layer spacing (doublying and tripling the (c/a)hex ratio). This yields stackings of graphene layers in the unit cell with much weaker mutual interaction. The absorption spectra for these graphene-sheet geometries are displayed in Fig. 4 (b,c). The first observation is that the oscillator strength vanishes completely in the frequency region below 10 eV in complete accordance with the predictions based on the dipole-selection rules for an isolated graphene layer. Therefore, the double inter-layer spacing leads to non-interacting graphene layers as far as the RPA absorption spectrum (at this frequency range) is concerned. When LFE are neglected, the peak structure in the 10-15 eV range stays intact, now with a smaller intensity due to the larger volume. With increasing interlayer separation, LFE become progressively more important. The shift of oscillator strength induced by LFE is so big that the absorption peaks at 10-15 eV are almost completely suppressed. These findings demonstrate that both inter-layer interaction and LFE influence considerably the intensity of the absorption peak at 11 eV. Qualitatively, the depolarization effects found in the tubes can hence be explained by the local field effects observed in the graphitic response perpendicular to the graphene sheets. Likewise, the effect of intertube interaction in the spectra for polarizations perpendicular to the tube axis is also consistent with the increased propensity of LFE to shift oscillator strength at higher frequencies when the intersheet distance progressively increases (see Fig. 4).
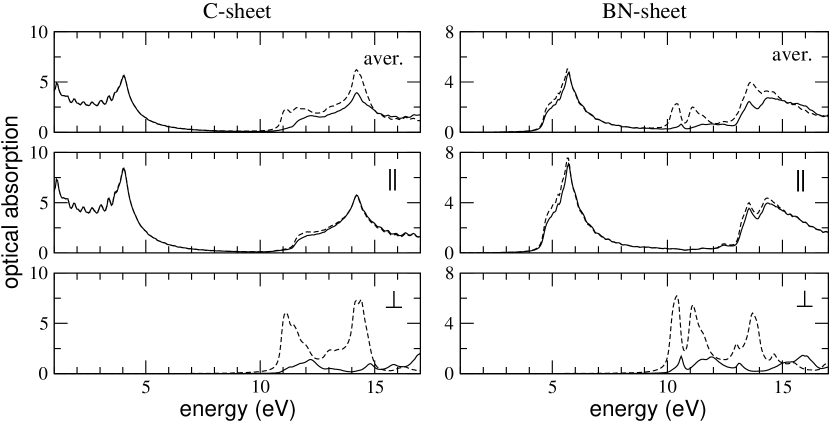
We conclude this section with a comparative presentation of the absorption spectra of the graphene and BN sheets using the same inter-sheet distance for both cases, shown in Fig. 5. Also we make comparisons with the spectra of the corresponding tubes. The spectrum of the graphene sheet for the in-plane polarization resembles closely the in-plane polarization spectrum of graphite (Fig. 3) (except for a scaling due to the change in the volume), confirming once more, as in the case of the tubes for the polarization parallel to the tube axis, that the position of the absorption peaks and their lineshape is only weakly influenced by the distance and inter-sheet interaction in this case. The main difference between the graphene and BN-sheet spectra for the in-plane polarization is the complete absence of any feature below 4 eV in the BN spectrum. This is clearly related to the 4 eV LDA-band gap of BN. The out-of-plane polarization spectra of the graphene and BN sheets are remarkably similar. Most importantly, both display a transparency up to 10 eV and both demonstrate a strong depolarization effect with shift of oscillator strength to higher energies kirchberg .
We compare now the calculated sheet-absorption spectra for in-plane polarization with the corresponding tube-absorption spectra for polarization parallel to the tube axis (Fig. 1 for carbon and Fig. 2 for BN). In the carbon case, the strong absorption feature of the sheet between 0 and 4 eV maps onto one or several absorption peaks of the tubes in this energy range. The details of this mapping are, however, sensitively dependent on the diameter and the chirality of the tubes, since dipole selection rules play a strong role in these highly symmetric systems. In particular, for tubes with larger diameter than the ones calculated in this article, the distance of the first van Hove singularities strongly depends on whether the tube is metallic or semiconducting. Therefore, calculations on graphite or graphene alone will not be sufficient to predict absorption spectra of small-diameter carbon nanotubes. For BN, in contrast, the first high absorption peak at 5.5 eV maps directly onto a corresponding peak in the tubes. Also the high energy absorption feature around 14 eV is very similar for the BN sheet and the BN tubes. Due to the large band gap of BN, the comparison between sheet and tube spectra is much more favourable for BN than for carbon tubes.
On the other hand, in the case of carbon, the extrapolation of results from graphite and graphene to the tubes is much more straightforward for the electron energy loss spectra as discussed in the following section.
5 EELS spectra in the limit of small q: tubes versus the layered structures
Having seen the strong interaction effects that occur in optical spectra for a polarization perpendicular to the planes or tube axis, it is interesting to make an excursion to a different type of spectroscopy, namely electron energy loss (EELS) fink . Although also in this case one can measure, like in the absorption experiment, a momentum transfer close to zero, there is a substantial difference in the definition of the response function: in the absorption measurement, one detects the response to the total macroscopic field, whereas in EELS the response to the external field is reported. Therefore, as pointed out above, absorption is linked to the imaginary part of the macroscopic dielectric function, but EELS is linked to the imaginary part of the inverse of the latter. Mathematically this translates into the fact that the crucial response function for EELS is governed by equation (2), whereas in the case of absorption one can use slightly different quantity: the macroscopic dielectric function can in fact be rewritten as
| (5) |
where V is the long-range component of the Coulomb potential, and it has a divergence for vanishing and the quantity obeys an equation similar to (2): , but setting the component of to zero () REV . Therefore, this seemingly tiny difference is responsible for the difference between, e.g., the position of the main absorption peaks and that of the valence plasmons in solids, and one can also expect that it will be crucial when interaction effects on the spectra are discussed. In particular, EELS spectra should show, due to the presence of this long-range term, stronger interaction effects than absorption spectra.
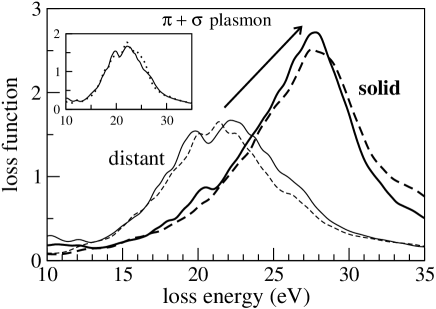
This is in fact the case, as we will illustrate in the following for the total plasmon in graphite. This plasmon represents the collective excitation mode of all the valence electrons in graphite. Before discussing the results we stress here that the tubes cannot be considered as completely isolated objects in this calculation of the loss function with the 5.5 Å intertube distance. We refer to the tubes in the latter geometry as distant. Fig. 6 shows the RPA loss function, , for the (3,3) tube, in the range 15-35 eV and for a vanishing momentum transfer q parallel to the tube axis. For this orientation LFE are negligible. A strong shift of the plasmon from 22 to 28 eV due to intertube interactions in the solid can be seen Gumb . The magnitude of this shift reveals a strong dependence of the plasmon position upon the intertube distance (hence the average valence electron density) essentially following the plasmon-frequency dependence in the case of the homogeneous electron gas Gas .
This shows that the tubes respond as homogeneous and highly polarizable objects for parallel q in the long-wavelength limit (). A direct consequence would then be that the atomic arrangement, orientation of bonds and helicity may play a secondary role in the response in this frequency and q range. Therefore, the result for the plasmon (shown in Fig. 6) would be representative of either of the three tubes since all of them – being of nearly the same diameter – possess the same average electron density. This is indeed the case as it can be seen in the inset of Fig. 6 where an almost indistinguishable plasmon was also obtained for the (5,0) tube. Hence, in contrast to an optical absorption experiment, small-q loss measurements of the plasmon cannot determine tubular helicities for a given tube diameter.
The governing factor for the plasmon must be traced to the in-layer graphitic response as it can be seen in Fig. 6 where the loss function for graphite and graphene is also shown (for in-layer q orientation) at comparable (to the tubes) average electron densities (to within 10 %) gra1 (dashed curves in Fig. 6). This shows that the loss function of the tubes for parallel q in this frequency range is governed by the average-density-dependent part of the in-layer graphitic response. Similar plasmon shifts, therefore, can also be expected in other carbon systems with graphene-based structural blocks e.g. multiwalled tubes. The present results outline the significance of the plasmon as a key measurable spectroscopic quantity which could gauge the intertube distances and interactions in real samples of carbon nanotubes.
In order to gain a more complete understanding of the in-layer graphitic response at small q’s and how the latter is influenced by the inter-layer interaction we determined both the loss and dielectric function for various graphene-like geometries i.e. varying the interlayer spacing or, equivalently, the (c/a)hex ratio. In these calculations we also looked at the lower-frequency plasmon. Bearing in mind the discussion in the previous paragraph, these calculations could then serve as benchmarks for predicting the position of the plasmon in nanotubes as a function of the intertube distances for low q’s.
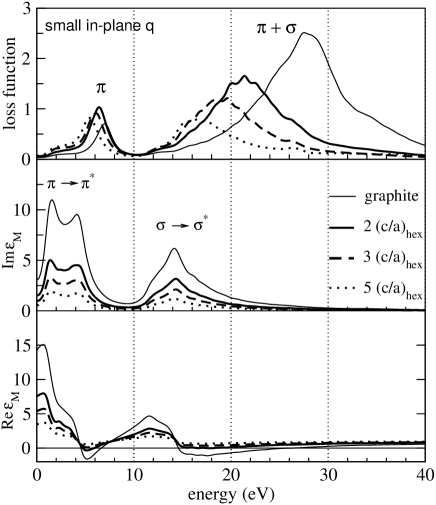
The loss and dielectric function for small in-plane q (0.22 Å-1) is shown in Fig. 7 for graphite and the graphene geometries with multiple (c/a)hex ratios. It can be seen that the peak positions of both plasmons have shifted to lower frequencies when the inter-layer separation is increased. This effect is very pronounced for the plasmon position. These results reaffirm that the total () plasmon is extremely sensitive to the inter-layer interaction for small in-plane q’s. This can be explained as follows: with increasing (c/a)hex, i.e. interlayer spacing, the system becomes an assembly of nearly isolated graphene sheets. This leads to a decrease of screening (Re[; see Fig. 7) with the effect that , namely a coincidence of the loss and absorption functions. Since for the in-plane polarization the positions of the absorption peaks do not change with increasing (c/a)hex (see Im[] in Fig. 7), then the loss function undergoes important changes, in particular the plasmon. The latter is displaced at a much faster rate to lower frequencies towards the 14 eV peak of the absorption spectrum whereas the plasmon peak is rather insensitive to (c/a)hex since it is already located very close to the 0-5 eV peak structure of the transitions in .
At present, existing measurements Kuz ; PIC98 of the loss spectra of samples of single-wall carbon nanotubes have given a plasmon in the frequency range 21–24 eV for small momentum transfer q. Our predicted frequency of the plasmon for the case of the distant tubes is within this frequency range (Fig.6). However, a direct comparison of the present results for the loss function of (3,3) and (5,0) tubes with the measured loss data is not straightforward. The difficulty stems from two factors, tube diameter and alignment, which have a competing effect on the plasmon position: a) Bulk samples of single-wall tube material possess a mean diameter of 14 Å PIC98 , which is considerably larger to the range of 4 Å studied in the present work. Assuming a common intertube spacing, then larger diameters would give rise to a displacement of the plasmon towards lower frequencies since the diametrically-opposed wall parts of the same tube are facing each other at larger distances, i.e. a situation resembling a stacking of graphene sheets with larger (c/a)hex ratios (see Fig. 7). For instance, the 5 (c/a)hex ratio corresponds to an intersheet separation of 16.8 Å and the corresponding plasmon peak is at 16 eV. b) The alignment of the tubes in the samples is not perfect; therefore it is to be expected that also out-of-plane excitations of graphitic origin will contribute to the response. These excitations gra1 should tend to produce a more diffuse shape for the loss spectrum, heavily dampening the plasmon and shifting the observed peak towards higher frequencies.
The type of response described just above can be clearly seen in Fig. 8 which shows the loss function of the distant (3,3) tubes for q orientation perpendicular to the tube axis. For this orientation in-plane as well as out-of-plane graphene excitations contribute to the tube response. The latter cause the diffuse shape of the loss function (see inset of Fig. 8). LFE are now very important and the peak position of the plasmon is at 28 eV.

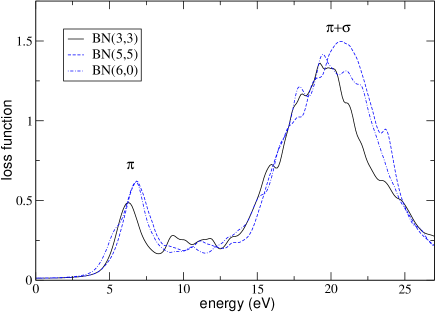
For completeness, we show in Fig. 9 also the calculated EELS spectra for small BN nanotubes with momentum transfer along the tube axis. As in the case of carbon tubes, two main features are clearly pronounced: the -plasmon at 6-7 eV and the high energy collective oscillation ( plasmon) around 20 eV. The exact position of the peaks depends on the radius and chirality of the tubes and on the intertube distance. In order to compare with experimental EELS-spectra on multi-wall BN tubes fuentes , an extrapolation to larger-diameter tubes is needed and the inter-wall interactions have to be taken into account.
6 Discussion and Conclusions
In this closing section we should like first to comment on the validity of RPA and TDLDA for the description of the optical spectra of the tubes. It is well known that RPA and TDLDA often give excellent results for loss spectra REV . However, in this work we have seen that also very good absorption spectra were obtained for the carbon tubes, even at the RPA level, despite the fact that both RPA and TDLDA are known to fail badly in the description of absorption spectra of many bulk materials (silicon and argon being two representative cases) REV . Our explanation in this regard is the following: for the light polarization parallel to the tube axis, the ensuing screening is significant and, therefore, XC effects are damped. For the perpendicular polarization and for the larger inter-wall distance ( 5.5 Å) the tubes behave essentially like isolated systems, where strong cancellations are known to occur between self-energy corrections and the electron-hole interaction, i.e. between XC effects (see Ref.REV ). The experimental precision is then not high enough (also due to the almost vanished absorption intensity in the relevant frequency range) to discern to which extent XC effects should be better described by approximations beyond the TDLDA. In view of these considerations, we can be confident regarding the quality of the calculations. On the other hand, the results for the strongly interacting tubes (smaller intertube distance) should be regarded as qualitative since the system becomes then more similar to a solid where the cancellations may be more incomplete, and since no direct comparison to experiment is possible, at present, in this case.
Still, excitonic effects are not included in the calculations. They could play a role in both carbon and BN nanotubes, leading to redistribution of oscillator strength and/or appearence of new peaks in the bandgap (bound excitons). They might be the reason for the anomalous ratio mele measured recently for carbon tubes bac03 . We expect a stronger deviation of measured optical spectra from theoretical ones in the case of BN nanotubes. For this large band gap material, two effects will most likely play an important role: Quasi-particle corrections will widen the band gap as in the case of hexagonal BN, where a GW calculation has demonstrated a band-gap increase from 4 eV to 5.5 eV bnblase . Excitonic effects, in contrast, will lead to isolated states in the band gap or to an overall reduction of the band-gap. To which extent quasi-particle corrections and excitonic effects cancel each other is presently not clear. Work along these lines is in progress ludger . For the role of quasi-particle corrections and excitonic effects in carbon tubes, we refer the reader to Ref. excilou .
In conclusion, the present ab initio calculations of the optical absorption of small-diameter carbon and BN nanotubes give good agreement with the available experimental data. The inclusion of local field effects in the response to a perturbation with perpendicular polarization is necessary for a proper description of the depolarization effect leading to a suppression of the low-energy absorption peaks for both types of tubes. This suppression can also explain recent findings in near-field Raman microscopy of single-wall carbon nanotubes achim . The proper analysis of the polarization dependence of the absorption cross section is very important in order to describe the surface enhanced Raman scattering experiments in isolated carbon nanotubes jorio ; duesberg . In carbon tubes the position of the first absorption peak strongly varies with the tube indices while in BN tubes the first peak is determined by the band gap of BN and is therefore mostly independent of . For the BN tubes some of the fine-structure which distinguishes tubes of different chirality is only visible in the UV region which gives rise to the hope that this energy regime will be probed in the future.
The intertube interaction was also found to be very important. For the carbon tubes this interaction is the governing factor which determines the position of the higher-frequency plasmon. This plasmon, hence, may prove to be a very useful spectroscopic quantity probing intertube interactions and distances in real samples. Finally, the corresponding results for the layered constituents — graphene and BN sheets — revealed that some aspects of the tubular dielectric response can be explained even at a quantitative level from the in-layer and interlayer response of the sheets.
7 Acknowledgments
This work was supported by the European Community Research Training Networks NANOPHASE (HPRN-CT-2000-00167) and COMELCAN (HPRN-CT-2000-00128), by Spanish MCyT(MAT2001-0946) and University of the Basque Country (9/UPV 00206.215-13639/2001). The computer time was granted by IDRIS (Project No. 544), DIPC and CEPBA (Barcelona). The authors also gratefully acknowledge fruitful discussions with Thomas Pichler and Nathalie Vast.
References
- (1) R. Saito, G. Dresselhaus, and M. S. Dresselhaus, Physical Properties of Carbon Nanotubes (Imperial College Press, London, 1998).
- (2) A. Rubio, J. L. Corkill, and M. L. Cohen, Phys. Rev. B 49, 5081 (1994).
- (3) X. Blase et al., Europhys. Lett 28, 335 (1994); Phys. Rev. B 51, 6868 (1995).
- (4) R. H. Baughman, A. A. Zakhidov, W. A. de Heer, Science 297, 787 (2002) and references therein.
- (5) A. B. Dalton, S. Collins, E. Munõz, J. M. Razal, V. H. Ebron, J. P. Ferraris, J. N. Colemean, B. G. Kim, and R. H. Baughman, Nature 423, 708 (2003).
- (6) A. Modi, N. Koratkar, E. Lass, B. Wei, and P. M. Ajayan, Nature 424, 171 (2003).
- (7) J.-M. Bonard et al, Phys. Rev. Lett. 81, 1441 (1998).
- (8) A. M. Fennimore, T. D. Yuzvinsky, W.-Q. Han, M. S. Fuhrer, J. Cumings, and A. Zettl, Nature 424, 408 (2003).
- (9) S. Tans et al., Nature 393, 49 (1998).
- (10) R. Martel, V. Derycke, C. Lavoie, J. Appenzeller, K. K. Chan, J. Tersoff, and Ph. Avouris, Phys. Rev. Lett. 87, 256805 (2001).
- (11) M. Radosavljević, J. Appenzeller, V. Derycke, R. Martel, Ph. Avouris, A. Loiseau, J.-L. Cochon, and D. Pigache, Appl. Phys. Lett. 82, 4131 (2003).
- (12) Combined scanning-tunneling microscopy and spectroscopy (STM/STS) is a very reliable tool for local tube characterization STS , however it cannot be used for routine tube mapping.
- (13) e.g. J.W.G. Wildöer, et al. Nature 391, 59 (1998); T.W. Odom, et al. Nature 391, 62 (1998).
- (14) For an overview over the numerous works on resonant Raman spectroscopy of carbon nanotubes see, e.g., R. Saito and H. Kataura in Carbon Nanotubes: Synthesis, Structure, Properties, and Applications, M.S. Dresselhaus, G. Dresselhaus, and Ph. Avouris (editors), Springer Verlag (2001).
- (15) S. M. Bachilo et al., Science 298, 261 (2003).
- (16) A. Hagen and T. Hertel, Nano Lett. 3, 383 (2003).
- (17) J. Lefebvre, Y. Homma and P. Finnie, Phys. Rev. Lett. 90, 217401 (2003).
- (18) A. Jorio et al, Phys. Rev. Lett. 90, 107403 (2003); A. Jorio et al, Phys. Rev. Lett. 86, 1118 (2001); K. Kneipp et al., Phys. Rev. Lett. 84, 3470 (2000)
- (19) A.G. Marinopoulos, L. Reining, A. Rubio, and N. Vast, Phys. Rev. Lett. 91, 046402 (2003).
- (20) L. Wirtz, V. Olevano, A.G. Marinopoulos, L. Reining and A. Rubio, in Proceedings of Electronic Properties of Novel Materials: XVIIth International Winterschool, Ed. H. Kuzmany, J. Fink, M. Mehring and S. Roth, World Scientific, Singapore (2003); and unpublished results.
- (21) W.A. de Heer et al., Science 268, 845 (1995); T. Pichler, et al. Phys. Rev. Lett. 80, 4729 (1998); H. Kataura et al. Synth. Met. 103, 2555 (1999); M. Ichida et al. J. Phys. Soc. Jpn 68, 3131 (1999); X. Liu et al. Phys. Rev. B 66, 045411 (2002).
- (22) Z. M. Li et al., Phys. Rev. Lett. 87, 127401 (2001); N. Wang et al. Nature 408, 50 (2000).
- (23) H. Ajiki and T. Ando, Physica B 201, 349 (1994); T. Ando, J. Phys. Soc. Japan 66, 1066 (1997).
- (24) C.L. Kane and E.J. Mele, Phys. Rev. Lett. 78, 1932 (1997); R. Egger and A.O. Gogolin, ibid., 79, 5082 (1997); C.L. Kane, L. Balents and M.P.A. Fisher, ibid., 79, 5086 (1997); R. Egger, ibid., 83, 5547 (1999).
- (25) e.g. C. Yannouleas, E.N. Bogachek and U. Landman, Phys. Rev. B 53, 10225 (1996); F.J. Garcia-Vidal, J.M. Pitarke and J.B. Pendry, Phys. Rev. Lett. 78, 4289 (1997).
- (26) M.F. Lin and K.W.K. Shung, Phys. Rev. B 50, 17744 (1994); S. Tasaki, et al., ibid. 57, 9301 (1998); M.F. Lin, et al., ibid. 61, 14114 (2000); F.L. Shyu and M.F. Lin, ibid. 62, 8508 (2000).
- (27) H.J. Liu and C.T. Chan, Phys. Rev. B 66, 115416 (2002); M. Machón et al., Phys. Rev. B 66, 155410 (2002).
- (28) J.W. Mintmire and C.T. White, Synth. Met. 77, 231 (1996).
- (29) I. Bozović, N. Bozović and M. Damnjanović, Phys. Rev. B 62, 6971 (2000); M. Ichida et al., ibid. 65, 241407 (2002); L. Wirtz et al., ibid. (2003) in press.
- (30) G. Onida, L. Reining and A. Rubio, Rev. Mod. Physics, 74, 601 (2002).
- (31) See for example, W. Kohn, Rev. Mod. Phys. 71, 1253 (1999); C. Fiolhais, F. Nogueira, M. Marques (Eds.), A Primer in Density Functional Theory (Springer, Berlin, 2003); Reviews in Modern Quantum Chemistry: A Celebration of the Contributions of R.G. Parr, K.D. Sen, ed(s), (World Scientific, 2002); and references therein.
- (32) L. Hedin and S. Lundqvist, in Solid State Physics, edited by F. Seitz, D. Turnbull and H. Ehrenreich (Academic, New York, 1969), Vol. 23, p. 1; M.S. Hybertsen and S.G. Louie, Phys. Rev. Lett. 55, 1418 (1985); Phys. Rev. B 34, 5390 (1986); R.W. Godby, M. Schlüter and L.J. Sham, Phys. Rev. Lett. 56, 2415 (1986); Phys. Rev. B 37, 10159 (1988).
- (33) W. Z. Liang et al., Applied Phys. Lett. 80, 3415 (2002).
- (34) E. Runge and E. K. U. Gross, Phys. Rev. Lett. 52, 997 (1984); E. K. U. Gross, F. J. Dobson, and M. Petersilka, Density Functional Theory (Springer, New York, 1996).
- (35) A.G. Marinopoulos, L. Reining, V. Olevano, A. Rubio, T. Pichler, X. Liu, M. Knupfer and J. Fink , Phys. Rev. Lett. 89, 076402 (2002).
- (36) P. Hohenberg and W. Kohn, Phys. Rev. 136, B864 (1964); W. Kohn and L. J. Sham, Phys. Rev. 140, A1133 (1965).
- (37) N. Troullier and J.L. Martins, Phys. Rev. B 43, 1993 (1991).
- (38) The ABINIT code is a common project of the Université Catholique de Louvain, Corning Incorporated, and other contributors (URL http://www.abinit.org).
- (39) H. Ehrenreich and M.H. Cohen, Phys. Rev. 115, 786 (1959); S.L. Adler, Phys. Rev. 126, 413 (1962); N. Wiser, Phys. Rev. 129, 62 (1963).
- (40) is expanded in reciprocal lattice vectors and depends on and on the momentum transfer . It describes the change of the density in response to the change of the total potential (which in turn is composed of the Hartree, the exchange-correlation and the external potentials): .
- (41) Typically, for the systems and excitation energies treated in this work, it was sufficient to compute bands up to , where is the number of occupied bands. In certain cases, especially for evaluating the loss function, we included more unoccupied bands in the summations.
- (42) M. Petersilka, U. J. Gossmann and E. K. U. Gross, Phys. Rev. Lett. 76, 1212 (1996).
- (43) In the irreducible wedges of the Brillouin zones of the tubes we used up to 22 k-points along the tube axis and sufficient number of k-points along the circumferential directions.
- (44) See e.g. also A. Rubio, Appl. Phys. A 68, 275 (1999).
- (45) L.X. Benedict, S.G. Louie and M.L. Cohen, Phys. Rev. B 52, 8541 (1995).
- (46) S. G. Louie et al., (to be published); and in Proceedings of Electronic Properties of Novel Materials: XVIIth International Winterschool, Ed. H. Kuzmany, J. Fink, M. Mehring and S. Roth, World Scientific, Singapore (2003).
- (47) Calculations are performed for a periodic array of nanotubes with an intertube distance of 14 a.u. The absolute value of scales with the dimension of the employed super-cell, but we are interested only in the relative absorption cross section in arbitrary units. The quasi-one dimensional Brillouin zones of the tube are sampled by 20 irreducible k-points along the tube axis.
- (48) Y.X. Zhao and I.L. Spain, Phys. Rev. B 40, 993 (1989).
- (49) A.G. Marinopoulos, L. Reining, A. Rubio and V. Olevano (to be submitted). We have used up to 16464 k-points for the Brillouin-zone sums, and 121 G-vectors in the matrices. Our results are fully converged with respect to the Brillouin zone sampling for frequencies above 1 eV. A proper evaluation of the spectra at lower frequencies for this semi-metal would require an improved treatment of intraband transitions, and is beyond the scope of the present work.
- (50) F. Bassani, and G. Pastori Parravicini, Il Nuovo Cimento 50, 95 (1967).
- (51) See Ref. KLU74 for comparisons of the dielectric function obtained from different experiments.
- (52) R. Klucker, M. Skibowski, and W. Steinmann, Phys. Stat. Sol. (b) 65, 703 (1974).
- (53) R. Ahuja, et al. Phys. Rev. B 55, 4999 (1997).
- (54) K. Zeppenfeld, Thesis, Univ. Hamburg (1969); J. Daniels et al., Springer Tracts Mod. Phys. 54, 77 (1970).
- (55) E. Tosatti and F. Bassani, Il Nuovo Cimento 65B, 161, (1970).
- (56) H. Venghaus, phys. stat. sol. (b) 71, 609, (1975).
- (57) D. L. Greenaway et al., Phys. Rev. 178, 1340 (1969); G.S. Painter and D.E. Ellis, Phys. Rev. B , 4747 (1970).
- (58) For the 2-dim. Brillouin zone of the C-sheet, we use a sampling of k-points, for the BN-sheet .
- (59) J. Fink, Adv. Electron. Electron Phys. 75, 121 (1989); and references therein.
- (60) Model calculations for a linear array of carbon tubes also show an important shift of the higher-frequency plasmon due to intertube interaction: G. Gumbs and G.R. Aizin, Phys. Rev. B 65, 195407 (2002).
- (61) See e.g. W. Jones and N.H. March, Theoretical Solid State Physics: Vol. 1, Wiley-Interscience (1973).
- (62) R. Kuzuo, M. Terauchi and M. Tanaka, Jpn. J. Appl. Phys. 31, L 1484 (1992).
- (63) T. Pichler, et al., Phys. Rev. Lett. 80, 4729 (1998).
- (64) G. G. Fuentes, E. Borowiak-Palen, T. Pichler, X. Liu, A. Graff, G. Behr, R. J. Kalenczuk, M. Knupfer, and J. Fink, Phys. Rev. B 67, 035429 (2003).
- (65) C. L. Kane and E. J. Mele, Phys. Rev. Lett. 90, 207401 (2003).
- (66) L. Wirtz, A. Marini, V. Olevano, A.G. Marinopoulos, L. Reining and A. Rubio (work in progress).
- (67) A. Hartschuh, E.J. Sánchez, X.S. Xie and L. Novotny, Phys. Rev. Lett. 90, 095503 (2003).
- (68) G.S. Duesberg, I. Loa, M. Burghard, K. Syassen and S. Roth, Phys. Rev. Lett. 85, 5436 (2000).