Two-step melting of the vortex solid in layered superconductors with random columnar pins
Abstract
We consider the melting of the vortex solid in highly anisotropic layered superconductors with a small concentration of random columnar pinning centers. Using large-scale numerical minimization of a free-energy functional, we find that melting of the low-temperature, nearly crystalline vortex solid (Bragg glass) into a vortex liquid occurs in two steps as the temperature increases: the Bragg glass and liquid phases are separated by an intermediate Bose glass phase. A suitably defined local melting temperature exhibits spatial variation similar to that observed in experiments.
pacs:
74.25.Qt,74.72.Hs,,74.25.Ha,74.78.BzThe mixed phase of type-II superconductors with random pinning constitutes an excellent test system for studies of the effects of quenched disorder on the structure and melting of crystalline solids. In systems with weak random point pinning, the existence of a low-temperature topologically ordered Bragg glass (BrG) phase with quasi-long-range translational order is now well established brg1 ; brg2 . A variety of fascinating “glassy” behavior has been experimentally observed tifr near the first-order melting transition of the BrG phase in both conventional and high- superconductors. It has been suggested tifr ; menon that these observations can be understood if it is assumed that the melting of the BrG phase occurs in two steps: the BrG first transforms into a “multidomain” glassy phase which melts into the usual vortex liquid at a slightly higher temperature.
In the presence of random columnar pinning, a “strong” Bose glass (BoG) phase nelson without quasi-long-range translational order occurs at low temperatures if the concentration of pins is larger than that of vortex lines. In the opposite limit of dilute pins, one expects radz a “weak” BoG phase at low temperatures which would melt into an interstitial liquid (IL) as the temperature is increased. In the IL phase, some of the vortices remain pinned at the strong pinning centers, while the other, interstitial ones form a liquid. A recent numerical study bbrgl suggests that a topologically ordered BrG phase is also possible in such systems if the pin concentration is sufficiently small. It is also found experimentally, for both point expt1 and columnar expt2 pinning, that the melting of the solid phase is “broadened”: the local transition temperature, measured by a discontinuity of the local magnetization, is different in different regions of the sample.
Here we report results of a numerical study that provides insights and explanations for some of the observations described above. From minimization of an appropriate free energy functional, we find that the vortex system in an extremely anisotropic, layered, superconductor with a random dilute array of strong columnar pins (with both pins and magnetic field perpendicular to the layers) forms a BrG phase at low temperatures. As is increased, this phase undergoes a first order transition into a glassy phase which we identify as a polycrystalline BoG. This phase then transforms, at a slightly higher , into the IL phase via a second, more strongly first order transition. We also show that the local transition temperatures, obtained from the temperature-dependence of a quantity that measures the degree of localization of the vortices in a small region of the sample, exhibit substantial spatial variation correlated with the local arrangement of the pinning centers.
The model and methods we use are similar to those in our earlier work cdotv for a periodic array of columnar pins: the main difference is that the pin array here is taken to be random. Thus, we study a layered superconductor with vanishingly small Josephson interlayer coupling (vortices on different layers are coupled via the electromagnetic interaction only). In this limit, appropriate gautam for extremely anisotropic Bi- and Tl-based high- materials, the energy of a system of “pancake” vortices residing on the superconducting layers may be written as a sum of anisotropic two-body interactions. We use the Ramakrishnan-Yussouff (RY) free energy functional ry . Since the potential produced by a set of straight columnar pins perpendicular to the layers is the same on every layer, , the time-averaged local areal density of vortices at point on a layer, must be the same on all layers. The free energy per layer may then be written as:
| (1) | |||||
Here, , is the free energy of the uniform liquid of areal density (= where is the magnetic induction and the flux quantum), , is the pinning potential, and , where is the direct pair correlation function of a layered liquid of pancake vortices ( is the layer separation and is the separation in the layer plane). We use the results for obtained gautam from a hypernetted chain calculation. The RY functional yields cdotv ; gautam a correct quantitative description of the melting transition in the absence of pinning. The potential at due to a pinning center at the origin is assumed to have the form for and if . Here, , is the layer spacing, is the penetration depth in the layer plane, is a range parameter and is a strength parameter. The net pinning potential is the sum of the potentials due to randomly placed pinning centers. We use parameter values appropriate to BSCCO i.e. and , and assume a two-fluid -dependence of with K. Defining (which we will use as our unit of length) via the relation , we set and . For these values, each pinning center traps one vortex cdotv in the temperature range of interest.
We discretize space by defining density variables at the sites of a triangular grid of size with periodic boundary conditions. The grid spacing is taken to be where is the equilibrium spacing cdotv of the pure vortex lattice at melting for the value of the magnetic field ( = 2kG) used here. The pinning centers are randomly put on computational lattice sites. Local minima of the discretized Eq.(1), written as a function of the , are then obtained numerically using a methodology quite similar to that in Ref. cdotv . We report here primarily results for = 1024 (corresponding, for the chosen value of , to including = 4096 vortices in the calculation), and relative pin concentration (the ratio of the number of pins to ) = 1/64. A larger pin concentration, =1/32, and samples of size = 512 (1024 vortices) were also studied prep . Results for the glassy phases depend somewhat, see below, on the placement of the random pins. Over twenty different random pin configurations were studied and averages taken where appropriate.
Different local minima of the discretized , corresponding to the several possible phases of the system, are reached when the numerical minimization is performed starting from different initial states cdotv . The free energies of these different minima at a given determine the (mean-field) phase diagram. A great advantage of our method in identifying minima representing different phases is that at each minimum the values of the full set are available. We can then calculate e.g. the structure factor . We can further characterize the structure of a minimum by analyzing additional information prep contained in the full set . In particular, we have calculated the local peak densities, defined as the values of the density at local peaks. The density is considered to locally peak at a mesh point if is higher than those at all other mesh points within a distance from . At low-temperature minima with localized vortices, these local density peaks lie where the vortices are localized: their number matches the number of vortices . Thus, the positions of these peaks define a “vortex lattice”. To elucidate the degree of order in this “vortex lattice”, we have found it particularly useful to carry out a Voronoi construction, thereby determining the number of nearest neighbors of each vortex and hence the defect structure of the minimum. To address questions about orientational order, we have obtained the bond-orientational vortex correlation function , defined as the correlation function of the field , where is the angle that the bond connecting a vortex at to its th neighbor makes with a fixed reference direction, and is the number of neighbors of the vortex at .
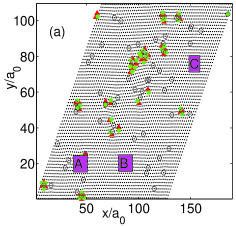
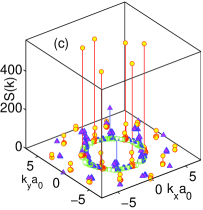
We find three different kinds of local minima of . The simplest kind is found by quenching the system, starting from uniform initial conditions, to temperatures somewhat higher than the equilibrium melting temperature of the pure vortex lattice (K cdotv ). The minimum can then be slowly cooled to below until it becomes unstable. This phase has local vortex densities close to the uniform liquid density everywhere except near the pinning centers, each of which traps one vortex. These minima clearly correspond to the interstitial liquid (IL) state with very small () peak values of (see panel (c) of Fig.1).
The second kind of local minima are obtained by quenching to temperatures below with initial conditions corresponding to a perfectly crystalline initial state (we use the crystalline state for which the pinning energy is minimum). They can then be cooled down, or warmed up to above . This phase is nearly crystalline: the densities at local peaks turn out to be large (5-10 times ) nearly everywhere, except at the pins where they are much higher. There are also a few small regions of lower peak density, indicating weakly localized vortices. The Voronoi plots for such minima (see panel (a) in Fig. 1) clearly illustrate the defect structure. A pair of adjacent 5- and 7-coordinated sites, shown as (red) triangles and large (green) dots respectively, corresponds to a dislocation. These dislocations form tightly bound clusters in this case. These clusters are located near pinning sites, shown by black circles in panels (a) and (b) of Fig.1. The local peak densities near the defect clusters are lower, indicating weaker localization of the vortices. The structure factor plot, shown in panel (c), exhibits six sharp Bragg peaks for these minima. The “crystalline order parameter” extracted from the peak value of is large at low temperatures ( at 17K for ) and decreases very slowly with sample size (by 6% as the sample size is doubled). The vortex bond-orientational correlation function for such minima (see Fig. 2, upper inset) saturates to a large value for large . Thus, these minima exhibit all the characteristics brg1 of a BrG phase and we conclude that they can be so identified. However, our numerical study can not rule out the occurrence of unpaired dislocations at much longer length scales. If this happens, then these minima may correspond to a “hexatic glass” hexatic phase. In any case, it is clear that these minima represent a phase that is distinct from the polycrystalline one described below.
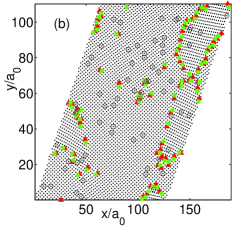
The third kind of minima are obtained either by slowly cooling a liquid-like minimum to below the temperature where it becomes unstable, or by quenching with a uniform initial density to a temperature well below . The Voronoi construction results for this case (panel (b) of Fig. 1) clearly show a polycrystalline structure with the dislocations lining up along grain boundaries, which lie mainly in regions without any pinning center. As a liquid-like initial state is cooled from relatively high , the vortices arrange themselves in triangular crystalline patches around the pins. The orientation of a crystalline patch depends on the local pin arrangement. As the temperature is lowered further, misaligned patches join each other at grain boundaries to form a new minimum of this kind. The local peak density is substantially lower near the grain boundaries. As these minima are warmed upprep , the regions near the grain boundaries begin to “melt” before the other parts of the sample. As shown in panel (c) of Fig.1, the structure factor for these minima exhibits several (typically more than six) peaks of height much lower than that of the six Bragg peaks found for the BrG minimum. The function for such minima goes to zero at large (see Fig. 2, upper inset). We conclude, therefore, by considering all the evidence, that such minima correspond to polycrystalline BoG states. While for any given pin configuration the IL and BrG states reached upon the minimization are, within numerical uncertainty, unique, different BoG type states can be reached using different starting states and cooling rates. This is characteristic of a glassy phase. When more than one BoG minima are found at a given , we consider the one with the lowest free energy. The polycrystalline nature of the BoG minima is consistent with the results of experiments expt3 and simulations nandini of the Bose glass phase in the dilute-pin regime.
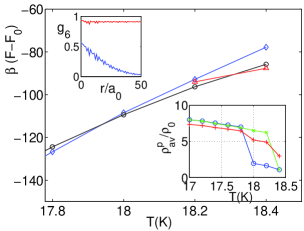
Fig. 2 illustrates the main result of our study. There we show the temperature dependence of of the BrG, IL and BoG minima for the same pin configuration at =1/64. The BrG minimum has the lowest free energy at low temperatures. Its free energy crosses that of the BoG minimum near 17.9K, indicating a first-order BrG-BoG transition at this temperature. The BoG phase then melts into the IL phase at a slightly higher temperature, near 18.3K, as indicated by the crossing of the free energies of these two minima. Thus, the melting of the low-temperature BrG phase with increasing temperature occurs in two steps, with a small region of BoG phase separating the BrG and IL phases. The grain boundaries in the BoG minima survive thermal cycling expt3 across the BoG-IL transition temperature, whereas similar thermal cycling produces grain boundaries in the BrG minima, indicating that the BoG phase is thermodynamically stable near the BoG-IL transition.
For samples with , the average value of the temperature interval in which the BoG is the equilibrium state is 0.42 K. This width varies from sample to sample between less than 0.1 in one single case, to 1.2K. Thus, the two-step transition is a generic feature. The entropy jump at the BrG-BoG (lower) transition ( per vortex) is smaller than that at the BoG-IL transition ( per vortex). These values do not depend significantly on the system size and their sum is slightly smaller than the value () at the single melting transition in the pure system. The size of these jumps makes it very unlikely that fluctuations would change the nature of the transitions in our 3D system. The value of the upper transition temperature is between 18.2K and 18.3K for all samples at = 1/64. These values are close to the first-order melting temperature of the pure system cdotv . The weak dependence of the transition temperatures on is consistent with experiments expt2 ; expt3 . Also, a first-order freezing transition of the IL to a polycrystalline solid has been observed expt3 in experiments on BSCCO with a small concentration of columnar pins. A narrow “two-phase” region found near the BrG melting transition in Ref.bbrgl may correspond to an intermediate BoG phase. Alternatively, the sample size ( vortex lines) in Ref. bbrgl may be too small for the detection of an intermediate BoG phase with large crystalline domains.
The BrG-BoG transition occurs as a result of a competition between elastic and pinning parts of the free energy. The BrG minimum has a lower elastic (free) energy than the BoG minimum, but a higher pinning energy: the vortices adjust better to the pinning potential in the BoG minimum. The softening of the lattice near melting decreases the relative importance of the elastic component, thus causing a crossing of the two free energies.
We have also calculated a space-dependent “local transition temperature” by monitoring the temperature-dependence of , the average of the local peak density in small regions containing 100 vortices. Vortices localized at pinning centers are not included in the calculation of . Values of much larger than indicate a solid-like local structure, while values close to indicate liquid-like behavior. In Fig.2, lower inset, we show the -dependence of for three regions centered at points A, B and C in panel (a) of Fig.1. The local transition temperature, defined as the temperature at which crosses cdotv , is different in the three regions. The lowest local corresponds to the BrG-BoG transition and reflects the local melting near a grain boundary of the BoG minimum (point C). The highest local is higher than the BoG-IL transition temperature, reflecting solid-like local structure near a cluster of pinning sites in the IL minimum (point A). The range of variation of the local ’s is comparable to that found in experiments expt1 ; expt2 .
Thus, we have shown that a layered superconductor with a small concentration of columnar pins exhibits a two-step melting transition from a low- BrG phase to a high- IL phase via an intermediate BoG phase. A suitably defined local transition temperature exhibits spatial variations correlated with the local arrangement of pinning centers. Our results are consistent with experiment, and support the suggestion tifr ; menon of similar behavior in systems with point pinning.
References
- (1) T. Nattermann, Phys. Rev. Lett. 64, 2454 (1990); T. Giamarchi and P. Le Doussal, Phys. Rev. B 52, 1242 (1995).
- (2) T. Klein et al., Nature 413, 404 (2001).
- (3) S. S. Banerjee et al., Physica C 355, 39 (2001), and references therein.
- (4) G. I. Menon, Phys. Rev. B 65, 104527 (2002).
- (5) D. R. Nelson and V. M. Vinokur, Phys. Rev. B 48, 13060 (1993).
- (6) L. Radzihovsky, Phys. Rev. Lett. 74, 4923 (1995).
- (7) Y. Nonomura and X. Hu, cond-mat/0212609.
- (8) A Soibel et al., Phys. Rev. Lett. 87, 167001 (2001).
- (9) S. S. Banerjee et al., Phys. Rev. Lett. 90, 087004 (2003).
- (10) C. Dasgupta and O. T. Valls, Phys. Rev. Lett. 87, 257002 (2001); Phys. Rev. B 66, 064518 (2002).
- (11) S. Sengupta et. al., Phys. Rev. Lett. 67, 3444 (1991); G. I. Menon et. al., Phys. Rev. B 54, 16192 (1996).
- (12) T. V. Ramakrishnan and M. Yussouff, Phys. Rev. B 19, 2775, (1979).
- (13) C. Dasgupta and O.T. Valls, in preparation.
- (14) E. M. Chudnovsky, Phys. Rev. B 43, 7831 (1991).
- (15) M. Menghini et al., Phys. Rev. Lett. 90, 147001 (2003).
- (16) P. Sen et al., Phys. Rev. Lett. 86, 4092 (2001).