Photoelasticity of crystalline and amorphous silica from first principles
Abstract
Based on density-functional perturbation theory we have computed from first principles the photoelastic tensor of few crystalline phases of silica at normal conditions and high pressure (quartz, -cristobalite, -cristobalite) and of models of amorphous silica (containig up to 162 atoms), obtained by quenching from the melt in combined classical and Car-Parrinello molecular dynamics simulations. The computational framework has also been checked on the photoelastic tensor of crystalline silicon and MgO as prototypes of covalent and ionic systems. The agreement with available experimental data is good. A phenomenological model suitable to describe the photoelastic properties of different silica polymorphs is devised by fitting on the ab-initio data.
I Introduction
The dependence of the refractive index versus strain in silica glass, namely the photoelasticity, is of interest from the fundamental point of view as well as for several technological applications in optics and microelectronics. For instance, photoelasticity in a-SiO2 is known to cause a reduction of fiber Bragg gratings efficiency Limberger et al. (1996) and to produce a loss of resolution of pure silica lenses used in photolytography Schenker and Oldman (1997). Despite its widespread interest, a microscopic and quantitative modeling of photoelasticity in amorphous silica is still lacking.
In this paper, we have computed the photoelastic tensor of crystalline and amorphous silica by first principles within density functional perturbation theory (DFPT) Baroni et al. (2001) aiming at identifying the microscopic properties which rule the photoelastic response in silica systems. Models of amorphous silica containing up to 162 atoms have been generated by quenching from the melt in combined classical and Car-Parrinello molecular dynamics simulations. Photoelastic coefficients of quartz have been computed previously within DFPT by Detraux and Gonze Detraux and Gonze (2001), who found good agreement with experimental data. From the change of effective charges of oxygen upon strain, the latter authors have suggested that an important contribution to photoelasticity in quartz comes from the dependence of oxygen polarizability on the deformation of the SiOSi angles upon strain.
In this paper we have enlarged the scope of the previous work by Detraux and Gonze Detraux and Gonze (2001) by computing the photoelastic coefficients of a-SiO2 and of several crystalline phases (quartz, -cristobalite, -cristobalite) at normal conditions and at high pressure from first principles. Comparison with available experimental data and with calculations including a scissor correction to the electronic band gap, let us conclude that the simple local density approximation to DFPT is suitable to well reproduce the experimental photoelastic tensor, despite a large error (10 ) in the dielectric constants. The ab-initio photoelastic coefficients of the crystalline phases of silica provided us with a database over which a phenomenological model of the dielectric response has been fitted. This model aided us in the interpretation of the ab-initio results on the photoelastic properties of amorphous silica. As described below, we have confirmed on a quantitative basis that the dependence of the anisotropic oxygen polarizability on the SiÔSi angle is the key parameter for modeling the dielectric and photoelastic properties of silica. The paper is organized as follows. In section II we describe our computational framework. In section III we report on a preliminary test of our framework on the photoelastic tensor of Si and MgO as prototypes of covalent and ionic materials. In section IV we report our results on the photoelastic coefficients and structural response to strains of several crystalline phases of silica: quartz at ambient conditions and high pressure, -cristobalite, and -cristobalite. In section V, we first report the details of the protocols used to generate the models of a-SiO2. Analysis of their structural and elastic properties are given. Then the calculated photoelastic tensor for a-SiO2 is discussed and compared with experimental data. In section VI we present a phenomenological model of the dielectric properties of silica that we have fitted on the dielectric tensor of -cristobalite at different densities. Its transferability was proven by comparison with the ab-initio database on the dielectric and photoelastic tensors of the crystalline and amorphous systems presented in the preceding sections. Finally, section VII is devoted to discussion and conclusions.
II Computational details
We have used density functional theory in the local density approximation (LDA) Perdew and Zunger (1981), norm conserving pseudopotentials for oxygen Troullier and Martins (1991) and silicon Gonze et al. (1991) and plane-waves expansion of the Kohn-Sham (KS) orbitals up to a kinetic cutoff of 70 Ry, if not specified otherwise. The structure of the crystalline phases has been determined by optimizing all the structural parameters. Monkhorst-Pack (MP) Monkhorst and Pack (1976) meshes have been used in the integration of the Brillouin Zone (BZ). The calculations on the crystalline phases have been performed by using the code PWSCF Baroni et al. . Models of a-SiO2 have been generated by quenching from the melt in classical molecular dynamics simulations using the empirical potential by van Beest et al. van Beest et al. (1990) which has been shown to properly describe the structural and dynamical properties of amorphous silica Tse and Klug (1992). We have slightly modified the interatomic potential of ref. van Beest et al. (1990) for short Si-O and O-O separations by adding a term of the form with and for Si-O interactions and and for O-O interactions. The modified potential turned out to be necessary to describe the high-temperature liquid (above 5000 K) where ions with opposite charges may approach each other very closely and fall in the well of the Coulomb potential in the absence of the additional repulsion here introduced. This new term does not change the structural properties of crystalline and amorphous phases. The simulations have been performed at constant volume. Ab-initio annealing of the models at 600 for 0.75 ps has been then performed by Car-Parrinello Car and Parrinello (1985) molecular dynamics simulation as implemented in the code CPMD CPM . We have generated two amorphous models containing 81 and 162 atoms. Different quenching and annealing protocols have been used as discussed in section V. Integration of the BZ has been restricted to the point only in the Car-Parrinello simulations. A fictitious electronic mass of 800 and a time step of 0.15 fs have been used. In the dynamical Car-Parrinello simulations we have used an ultrasoft pseudopotential Vanderbilt (1990) for oxygen and a lower cutoff of 27 Ry. The structures generated by Car-Parrinello simulations have been then optimized with norm-conserving pseudopotentials to study the dielectric properties. We have computed the dielectric and photoelastic tensors within density functional perturbation theory Baroni et al. (2001). The photoelastic tensor is defined by
| (1) |
where is the optical dielectric tensor and is the strain tensor. Only the electronic contribution is included in , also indicated as . Experimentally, it corresponds to the dielectric response measured for frequencies of the applied field much higher than lattice vibrational frequencies, but lower than the frequencies of the electronic transitions. The photoelastic coefficients have been calculated by finite differences from the dielectric tensor of systems with strains from -2 to +2 . The independent components of (21 in general) can be reduced by the symmetry of the system. In quartz for instance there are only eight independent coefficients which can be determined by applying three types of strain , and . The components of the photoelastic tensor will be expressed hereafter in the compressed Voigt notation.
The dielectric tensor for the different strained configurations has been calculated within DFPT Baroni et al. (2001), as implemented in the code PWSCF and PHONONS Baroni et al. . However, the largest amorphous model considered here which contains 162 atoms turned out intractable within the latter framework. Therefore, we have also computed the dielectric tensor within the Berry phase (BP) approach to the electronic polarization King-Smith and Vanderbilt (1993); Resta (1994) as developed by Putrino et al. Putrino et al. (2001). In these latter calculations we have restricted the BZ integration to the -point only. This latter technique converges to the correct DFPT result in the limit of large simulation cells or equivalent k-points mesh, although with a different pace with respect to standard DFPT. How large should the system be to reproduce the correct result within the BP approach has been investigated for -cristobalite in section IVc below. It turns out that for system size of the order of 192 atoms and the -point only, the error in the photoelastic coefficients of -cristobalite are of the same order of the errors introduced by the LDA. Photoelasticity of the largest model of a-SiO2 in section V has been addressed within the BP approach as implemented in the code CPMD CPM .
The exchange-correlation functionals available in literature (LDA and generalized gradient approximation (GGA)) usually underestimate the electronic band gap and overestimate the electronic dielectric tensor up to 10-15 Detraux and Gonze (2001). This discrepancy can be corrected semi-empirically by applying a self-energy correction, also referred to as a scissor correction, which consists of a rigid shift of the conduction bands with respect to the valence bands Levine and Allan (1991). This procedure has been used successfully to reproduce the photoelasticity of Si Levine et al. (1992), GaAs Reynolds et al. (1995) and quartz Detraux and Gonze (2001). However, as shown in section III and IV, it turns out that even within simple LDA, the error in the photoelastic coefficients is smaller than what expected on the basis of the error in the dielectric constant itself. The scissor correction has thus been neglected in the calculations on amorphous silica and on crystalline phases at high pressure. The calculations with the scissor corrections have been performed with the code ABINIT abi .
III Test cases: silicon and MgO
As test cases of our theoretical framework, prior to the application to silica, we have computed the photoelastic coefficients of crystalline silicon and MgO as prototypes of covalent and ionic systems, respectively.
III.1 Silicon
We have computed the photoelastic tensor for the conventional cubic supercell containing eight atoms. The dielectric tensor has only one component and there are three photoelastic coefficients, , and independent by symmetry. A 8x8x8 MP mesh over the BZ corresponding to 20 k-points in the irreducible wedge is used. The KS states are expanded in plane waves up to a kinetic cutoff of 20 Ry. The photoelastic coefficients, computed at the theoretical equilibrium lattice constant ( Å), are reported in table 1 and compared with previous results obtained by Levine et al. Levine et al. (1992). These authors computed the photoelastic coefficients at the experimental lattice parameter ( Å) within simple LDA and by adding a scissor operator, corresponding to a rigid shift of 0.7 eV of the conduction band with respect to the valence band. Although the scissor correction is crucial to reproduce the dielectric constant of silicon, it produces small changes in the photoelastic tensor both at the experimental and at the theoretical equilibrium densities. On the other hand, the photoelastic coefficients are strongly dependent on the lattice constant (cfr. table 1). Better agreement with experiments is achieved when the theoretical lattice parameter is used. This conclusion is also true for the calculation of the piezoelectric tensor in other materials de Gironcoli et al. (1989); dal Corso et al. (1993).
| LDA | LDA+sciss. | LDA | LDA+sciss. | Exp. | |
|---|---|---|---|---|---|
| () | () | () | () | ||
| this work | this work | ref.Levine et al. (1992) | ref.Levine et al. (1992) | ref. Biegelsen (1974) | |
| 13.20 | 11.38 | - | 11.4 | 11.4 | |
| -0.105 | -0.110 | -0.105 | -0.115 | -0.1110.005 | |
| -0.058 | -0.051 | -0.085 | -0.067 | -0.0550.006 | |
| -0.090 | -0.090 | -0.098 | -0.099 | -0.0940.005 | |
| 0.016 | 0.020 | 0.007 | 0.016 | 0.0170.001 | |
| -0.052 | - | -0.045 | -0.049 | -0.0510.002 |
III.2 MgO
MgO crystallizes in a NaCl-type lattice. We have computed the photoelastic coefficients for a conventional cubic supercell containing eight atoms. A norm conserving pseudopotential of Car-Von Barth type von Barth and Gelatt (1980) including non-linear-core corrections Louie et al. (1982) for Mg and a 8x8x8 MP mesh for the BZ integration have been used. The equilibrium lattice parameter has been obtained by fitting the equation of state with a Murnaghan function Murnaghan (1944) which yields Å ( Å) and a bulk modulus GPa ( GPa). The dielectric constant is, as usual, overestimated (), but the calculated photoelastic coefficients reported in table 2 are in good agreement with experimental data Cardona et al. (1959); Vedam and Schmidt (1966). The spread in the experimental data is quite large, as they have not been obtained by the Brillouin scattering method but by a hydrostatic pressure method which is subject to larger uncertainties.
IV Crystalline silica
In the next sections we report the calculated photoelastic coefficients of three crystalline phases of silica at normal conditions and at high pressure: -quartz, -cristobalite, and -cristobalite. The collected set of data have then been used to fit the phenomenological model of photoelasticity discussed in section VI below.
IV.1 -Quartz
The photoelastic coefficients of quartz have been recently computed within DFPT by Detraux and Gonze Detraux and Gonze (2001). This phase has thus been used as a test case for our theoretical framework on silica systems. The unit cell of quartz is hexagonal (space group ) and contains nine atoms of which two are independent by symmetry in the positions Si and O . We have used a 3x3x2 MP mesh in the BZ integration although a single special point is enough to achieve convergence in the structural properties Detraux and Gonze (2001). The optimized lattice parameters (, ) and internal structural parameters are reported in table 3. Actually, the agreement with experiments on structural parameters is fair, but somehow worse than usual for the SiSi angle and the lattice parameter. These discrepancies have to be mainly ascribed to the choice of the LDA for the exchange and correlation functional which commonly causes an underestimation of the equilibrium volume. It was demonstrated that GGA is necessary to reproduce the correct energy differences among the phases of silica Hamann (1996), however the equilibrium lattice parameters and the Si--Si angle are only slightly improved for -quartz (agreement with experimental data is still within 2) and Si-O distances slightly worsen (see table 1 of ref.Hamann (1996) for comparison). The small differences between our results and those reported in ref.Detraux and Gonze (2001) depend on the different choice of the pseudopotentials.
| This work | LDA | LDA + scissor | experiment | |
| Ref. Detraux and Gonze (2001) | Ref. Detraux and Gonze (2001) | Ref. Levien et al. (1980); Narasimhamurty (1969) | ||
| a | 4.805 | 4.815 | 4.913 | |
| c/a | 1.101 | 1.105 | 1.100 | |
| u | 0.460 | 0.461 | 0.465 | |
| x | 0.408 | 0.410 | 0.415 | |
| y | 0.283 | 0.281 | 0.272 | |
| z | 0.105 | 0.108 | 0.120 | |
| Si-O (1) | 1.605 | 1.602 | 1.605 | |
| Si-O (2) | 1.610 | 1.611 | 1.614 | |
| Si--Si | 137.7 | 139.1 | 143.7 | |
| O--O | 108.33 | 108.07 | 108.37 | |
| 111.39 | 110.97 | 110.88 | ||
| 108.39 | 109.36 | 108.37 | ||
| 109.11 | 109.43 | 110.41 | ||
| 2.590 | 2.538 | 2.353 | 2.356 | |
| 2.620 | 2.569 | 2.385 | 2.383 | |
| 0.17 | 0.16 | 0.17 | 0.16 | |
| 0.23 | 0.23 | 0.23 | 0.27 | |
| 0.24 | 0.24 | 0.25 | 0.27 | |
| 0.085 | 0.080 | 0.11 | 0.10 | |
| 0.25 | 0.25 | 0.27 | 0.29 | |
| -0.031 | -0.023 | -0.03 | -0.03 | |
| -0.040 | -0.034 | -0.028 | -0.047 | |
| -0.056 | -0.062 | -0.061 | -0.079 |
The calculated dielectric constants and independent photoelastic coefficients are collected in table 3. Only three independent strains (, , and ) are necessary to compute all the independent . The theoretical are in good agreement with previous results obtained by Detraux and Gonze Detraux and Gonze (2001) by adding the scissor correction and with experiments. Although the scissor operator is necessary to reproduce the dielectric constant, its effect on the photoelastic coefficients is less important. The scissor operator has been adjusted to 2.1 eV in ref. Detraux and Gonze (2001) to better reproduce the dielectric constants of quartz.
To identify the main structural changes upon strain, we have computed the response of the structural parameters (bondlengths and angles) to strain of . Results are summarized in table 4. The stiffness of the Si-O bonds causes the structure to respond to strain mainly by cahnges of the bond angles. The Si--Si angles undergo larger changes than the tetrahedral O--O angles due to the strongly directional character of the sp3 orbitals of silicon.
| Si-O (1) (Å) | 0.036 | 0.102 |
|---|---|---|
| Si-O (2) (Å) | 0.024 | 0.090 |
| Si--Si (1) | 130.6 | 77.7 |
| Si--Si (2) | 30.5 | - |
| Si--Si (3) | 160.4 | - |
| O--O (1) | 77.2 | 47.5 |
| O--O (2) | -33.9 | -0.6 |
| O--O (2’) | -19.0 | - |
| O--O (3) | 36.0 | -51.7 |
| O--O (3’) | -12.9 | - |
| O--O (4) | -15.7 | 57.4 |
The dielectric tensor and photoelastic coefficients have been calculated at high pressure as well. Table 5 reports the structural and dielectric properties of -quartz at 3 and 7 GPa, well below the transition pressure to the monoclinic phase (21 GPa) Hemley et al. (1994). The variation of the equilibrium volume and of the internal structural parameters of -quartz as a function of pressure is in good agreement with experiments Chelikowsky et al. (1990). The Si--Si angle undergoes larger changes upon compression than the O--O angles, while the Si-O distances are nearly unaffected.
| 0 GPa | 3 GPa | 7 GPa | |
| a | 4.805 | 4.661 | 4.517 |
| c/a | 1.101 | 1.120 | 1.142 |
| V/V0 | 1 | 0.93 (0.93) | 0.86 (0.87) |
| u | 0.460 | 0.450 | 0.441 |
| x | 0.408 | 0.400 | 0.391 |
| y | 0.283 | 0.299 | 0.311 |
| z | 0.105 | 0.095 | 0.088 |
| Si-O | 1.605 (1.605) | 1.600 (1.602) | 1.593 (1.599) |
| Si-O | 1.610 (1.614) | 1.611 (1.613) | 1.611 (1.614) |
| Si--Si | 137.7 (143.7) | 131.8 (139.9) | 126.8 (133.3) |
| O--O | 108.3 | 106.2 | 103.7 |
| O--O | 111.4 | 113.6 | 115.9 |
| O--O | 108.3 | 107.5 | 106.6 |
| O--O | 109.1 | 108.6 | 108.3 |
| 2.590 | 2.694 | 2.812 | |
| 2.620 | 2.737 | 2.865 | |
| 0.170 | 0.174 | 0.219 | |
| 0.227 | 0.214 | 0.209 | |
| 0.245 | 0.215 | 0.199 | |
| 0.085 | 0.067 | 0.051 | |
| 0.253 | 0.251 | 0.254 | |
| -0.056 | -0.055 | -0.053 |
We are not aware of any experimental data on the photoelastic coefficients of quartz at high pressure.
The dependence on pressure of the response of structural parameters to strain is reported in table 6. By inspecton of table 6 we can conclude that at high pressure the Si-O bonds become even stiffer. However, since the flexibility of the Si--Si angle is reduced, also the deformation of the tetrahedral unit becomes sizable.
| 0 GPa | 3 GPa | 7 GPa | |
|---|---|---|---|
| Si-O (1) | 0.102 | 0.078 | 0.031 |
| Si-O (2) | 0.090 | 0.013 | -0.005 |
| Si--Si | 77.7 | 69.4 | 61.7 |
| O--O (1) | 47.5 | 0.81 | -19.6 |
| O--O (2) | -0.70 | 20.3 | 17.6 |
| O--O (3) | -51.7 | -41.8 | -34.9 |
| O--O (4) | 57.4 | 42.4 | 54.6 |
The data reported so far are not sufficient to establish a correlation between structural and photoelastic properties, however these results support the idea that bond angles (mainly Si--Si) play a key role in determining the photoelastic coefficients of quartz.
In order to identify the structural response of silica polymorph to strain, it is useful to consider this system as a network of SiOSi units. The structural response to strain can then be expressed in terms of the length and orientation of the vector distance Si-Si between the two silicon atoms of the SiOSi unit which depends on the Si--Si bond angle. The orientation of the SiOSi units can be valuated by computing the projection of the Si-Si distances on the Cartesian axis. This analysis (tab. 7) shows that a tensile strain increases the alignment of the Si-Si vectors along the strain axis.
| 0 GPa | 3 GPa | 7 GPa | ||
|---|---|---|---|---|
| Px(Si-Si) | 1.690 | 1.554 | 1.505 | |
| Py(Si-Si) | 0.000 | -0.024 | -0.006 | |
| Pz(Si-Si) | 0.000 | -0.008 | -0.012 | |
| Px(Si-Si) | -0.450 | -0.392 | -0.416 | |
| Py(Si-Si) | 0.000 | 0.000 | -0.250 | |
| Pz(Si-Si) | 1.762 | 1.595 | 1.718 |
IV.2 -Cristobalite
The -cristobalite crystal has tetragonal symmetry (space group ). The unit cell contains 12 atoms of which two are independent by symmetry at the positions Si and O . The optimized structural parameters of -cristobalite are compared with experiments in table 8. A 3x3x2 MP mesh has been used in the BZ integration. The experimental value of Si--Si angle (144.7o) which is suggested to be the structural parameter which mostly influences the photoelastic response Detraux and Gonze (2001) is very similar to that of quartz (143.9o). Conversely, -cristobalite and quartz differ in density (2.36 g/cm3 and 2.65 g/cm3 for -cristobalite and -quartz, respectively) and in the ring topology (6- and 8-membered rings in quartz and only 6-membered rings in -cristobalite).
| This work | Exp. (Ref.Pluth et al. (1985)) | |
|---|---|---|
| a | 4.856 | 4.957 |
| c/a | 1.381 | 1.390 |
| u | 0.313 | 0.305 |
| x | 0.234 | 0.238 |
| y | 0.129 | 0.111 |
| z | 0.191 | 0.183 |
| Si-O (1) | 1.603 | 1.602 |
| Si-O (2) | 1.605 | 1.617 |
| Si--Si | 139.8 | 144.7 |
| O--O (1) | 107.53 | 108.08 |
| O--O (2) | 109.36 | 109.57 |
| O--O (3) | 110.35 | 109.92 |
| O--O (4) | 111.71 | 111.27 |
The dielectric tensor has two independent components ( and ). The independent photoelastic coefficients are seven and can be obtained by applying of four strains: , , and . The theoretical dielectric and photoelastic tensors are reported in table 9. The results obtained by including a scissor correction equal to that used for quartz (2.1 eV) Detraux and Gonze (2001) are also reported. The scissor correction largely improves the dielectric constants, but produces smaller changes in the photoelastic coefficients as occurs in quartz. Hereafter, the scissor correction will thus be neglected in the calculation of the photoelastic tensor for other crystalline and amorphous phases of SiO2.
We are not aware of any experimental measurement of the photoelastic coefficients in -cristobalite.
| LDA | LDA+scissor | |
| 2.363 | 2.206 (2.211) | |
| 2.358 | 2.196 (2.202) | |
| 0.218 | 0.225 | |
| 0.244 | 0.248 | |
| 0.293 | 0.299 | |
| 0.152 | 0.162 | |
| 0.294 | 0.298 | |
| -0.094 | -0.090 | |
| -0.068 | -0.066 |
The differences in density and topology of quartz and -cristobalite determine a different response of the structural parameters to strain (results are displayed in tab. 10).
| Si-O (1) | 0.030 | -0.011 | 0.006 |
|---|---|---|---|
| Si-O (1’) | -0.019 | - | 0.125 |
| Si-O (2) | -0.079 | -0.008 | 0.015 |
| Si-O (2’) | 0.031 | - | 0.172 |
| Si--Si (1) | -31.2 | 70.6 | 33.3 |
| Si--Si (2) | 186.7 | - | 37.2 |
| O--O (1) | 9.98 | -35.3 | 30.5 |
| O--O (1’) | 68.2 | - | 18.2 |
| O--O (2) | -14.9 | 3.81 | 41.9 |
| O--O (3) | -16.9 | 14.5 | 20.5 |
| O--O (3’) | -18.4 | - | 54.4 |
| O--O (4) | -29.1 | 38.3 | 24.8 |
In -cristobalite bond lengths are affected by strain even less than in quartz and the distortion of the tetrahedral bond angles is smaller. In fact, -cristobalite has a more open structure than quartz and it is able to accommodate strains mainly by a rotation of the tetrahedra.
The derivatives of the projection of the Si-Si vectors along the Cartesian axes with respect to strain are reported in Tab.11. The alignment of the Si-O-Si units along the strain axis observed in -quartz occurs also in -cristobalite for strain along the main symmetry axis (), but it is much smaller for the strain.
| Px(Si-Si) | 0.190 | -0.675 |
| Py(Si-Si) | -0.226 | -0.675 |
| Pz(Si-Si) | 0 | 1.676 |
IV.3 -Cristobalite
The -cristobalite phase can be obtained by heating -cristobalite above 270 oC at normal pressure Wright and Leadbetter (1975). The space group assigned experimentally to -cristobalite has been interpreted in the past as an average structure composed of small domains with six possible orientations of the structure with symmetry Wright and Leadbetter (1975). More recent NMR data have shown that the coexistence of different domains of lower symmetry is in fact dynamical and not static as due to domains with fixed orientation Spearing et al. (1992). However, the -cristobalite structure with symmetry is locally stable at low temperature (0-300 K) in the small simulation cells with periodic boundary conditions used here. Its properties can then be studied theoretically, also to get insight into the properties of amorphous silica. In fact, -cristobalite is the crystalline phase of silica with density (2.18 g/cm3) and refractive index closest to those of amorphous silica. We have modeled -cristobalite in a cubic supercell containing 8 formula units with symmetry. We optimized the internal coordinates at the experimental density of 2.18 g/cm3 ( Å). A 4x4x4 MP mesh has been used in the BZ integration. The internal structural parameters of -cristobalite are assigned by the SiÔSi angle, two OŜiO angles and the Si-O bond length. The calculated values are 142.9o (SiÔSi), 107.5o and 113.6o (OŜiO) and 1.606 Å (Si-O) in good agreement with the experimental values 146.7o, 107.8o and 112.8o, and 1.611 Å respectively Wright and Leadbetter (1975).
The dielectric tensor has two independent components and . The calculated dielectric constants and photoelastic coefficients are reported in table 12.
In the perspective to study the dielectric response of large models of amorphous silica, we have checked the convergence of the photoelastic coefficients as a function of the size of the mesh in the BZ integration for -cristobalite. Table 12 reports the results obtained by using the -point only of the 24-atoms supercell and a mesh of 8 k-points in the first BZ which corresponds to the -point only of a cubic supercell containing 192 atoms. The results with a mesh of 32 k-points are the “exact” values at convergence in the BZ integration. The dielectric and photoelastic tensor are already converged by using the -point of the 192-atoms supercell. We have also computed the dielectric tensor and photoelastic coefficients of the 192-atoms supercell of -cristobalite within the Berry phase approach to electronic polarization, as developed by Putrino et al. Putrino et al. (2001). This latter calculation converges to the correct DFPT result, although with a different pace with the cell size by using the -point only in the BZ integration, or, equivalently, with the -point mesh Umari and Pasquarello (2002). In fact, calculations within DFPT and BP with the same -points mesh give different results and the discrepancy decreases by increasing the -points mesh (or, equivalently, the cell dimension). In table 12 the dielectric and photoelastic tensor of -cristobalite calculated within DFPT and BP are compared. The BP approach has been applied to a -cristobalite supercell containing 192 atoms, by restricting the BZ integration to the -point only, which is equivalent to the 8 -points mesh of the 24 atoms supercell. However, the DFPT results with 8 k-points (24-atoms cell) are different from the BP results on an equivalent k-point mesh (-point and 192-atoms cell). The BP approach convereges converges more slowly with cell size (or equivalently with the -points mesh) than DFPT. Moreover, the convereged value of is approached from below within the BP approach. This effect is responsible for the difference in dielectric constant of the a-SiO2 reported here (see infra) for a 81 supercell and a 162-atoms cell and for a 72-atoms cell recently considered in ref. Umari and Pasquarello (2002).
From table 12 it turns out that for system size of the order of 192 atoms the errors in the photoelastic coefficients due to the use of BP approach at -point are of the same order of the errors introduced by the LDA itself. Since the BP approach is computationally less demanding that DFPT as implemented in the codes CPMD and PWSCF, respectively, we have used the former approach for the largest amorphous model described in the next section.
| 8 k | 32 k points | BP 192 atoms | ||
| 2.337 | 2.281 | 2.282 | 2.181 | |
| 2.310 | 2.251 | 2.252 | 2.161 | |
| 0.297 | 0.291 | 0.292 | 0.266 | |
| 0.131 | 0.124 | 0.119 | 0.165 | |
| 0.242 | 0.269 | 0.267 | 0.238 |
V Amorphous silica
We have generated several models of amorphous silica by quenching from the melt in classical MD simulations using the empirical potential by van Beest et al. van Beest et al. (1990) as described in section II. We have considered simulation cells of two sizes: 81 and 162 atoms. We first report on the details of the quenching protocols and on the structural properties of the resulting amorphous models before discussing the dielectric properties of a-SiO2.
V.1 Structural properties
The generation of amorphous models by quenching from the melt within Car-Parrinello simulations poses some unavoidable restrictions on the cell size and the quenching time, which, in turn, negatively affect the quality of the models produced. The main problem is that a very high quenching rates (in ref. Sarnthein et al. (1995) quenching rate was 1016 K/s), prevents an adequate relaxation which freezes the concentration of small rings (three and four membered) to a value much higher than those expected in the experimental samples Sarnthein et al. (1995). A further limitation is given by the small size of the systems that can be treated by ab-initio simulations (in ref. Sarnthein et al. (1995) the simulation supercell contains 72 atoms).
In order to partially overcome these limitations, we have adopted a combined classical and ab–initio simulation scheme, that has been already reported to produce models of glassy SiO2 with satisfactory structural and electronic properties, when compared to fully ab-initio models and to available experimental data Benoit et al. (2000). Within this approach, models of a-SiO2 are generated by quenching from the melt by classical MD with the BKS potential at low quenching rate. The amorphous models thus obtained are then annealed by Car–Parrinello MD. Starting configurations of liquid silica have been obtained from unstable simple cubic crystal which rapidly reaches 8500 K. For both the 81- and 162-atoms models we have used an initially cubic box with density of 2.21 g/cm3. After 25 ps at 8500 K, the high temperature liquid is cooled to about 4000 K in 25 ps. The temperature at which atomic diffusion freezes over our simulation scale is much larger (3500 K) than the experimental vitreous temperature (1700 K). In order to obtain a good amorphous model, we have equilibrated the liquid at a temperature slightly above 3500 K and then quenched it slowly. The quenching protocol used to generate the 162-atoms model and a first 81-atoms model is shown in Fig. 1. It turns out that the quenching rate of Fig. 1 is still too fast to correctly reproduce the structural properties of amorphous silica in the small system (81 atoms) which in fact appears to be strongly anisotropic. This problem is less severe for the larger system (162 atoms) which can escape from high energy local minima visited along the quenching. We have then generated another smaller model (81-atoms) with a much lower quenching rate by equilibrating the system for 5 ns at 3800 K and quenching to 300 K in 2.5 ns (corresponding to a quenching rate of 1.41012 K/s). The 81-atoms system referred to hereafter corresponds to this second quenching protocol.

Ab-initio annealing for 1.0 ps at 600 has been then performed by CPMD. For the smaller model, we have computed structural properties over a dynamical ab-initio microcanonical run at 300 K, 0.6 ps long. The pair correlation functions and the bond angle distributions of the ab-initio and classical models at 300 K are compared in fig. 2.


The average OO angle is very close to the tetrahedral value (109.5o), while the SiÔSi bond angle distributions are quite different in the classical and CPMD simulations. The main effect of ab-initio annealing is a shift to lower angles of the SiÔSi angle distribution. The Si-O and O-O pair correlation functions are not affected, while the Si-Si pair correlation function reflects the modification in the SiÔSi angle distribution, showing a longer tail at small Si-Si distances. The ab-initio annealing and optimization does not affect the topology acquired by the system during the classical MD quenching. The ring-size distribution of the two a-SiO2 models is reported in Fig. 4. The 81-atoms model produced with the low quenching rate has a low concentration of small rings (3- and 4-membered) with respect to the 162-atoms model and to previous models (72-atoms large) generated fully ab-initio Sarnthein et al. (1995). After the ab-initio annealing performed with the softer Vanderbilt pseudopotentials, the final structure has been further optimized with norm-conserving pseudopotentials (for the calculations of the dielectric properties). The cell geometry has been optimized at fixed volume allowing orthorhombic distortions of the initially cubic supercell such as to produce a diagonal stress tensor.
The residual anisotropy in the stress () is:
| (2) |
for the optimized ratios =1.051, =1.002 in the 81-atoms supercell and
| (3) |
for the optimized =1.037, =1.018 in the 162-atoms supercell. The large negative stress in eq. 2 is due to the so–called Pulay stress. The and ratio obtained in this way at the initial density of 2.21 g/cm3 have been then hold fixed and the volume varied to generate the equation of state reported in Fig. 5.

As far as we know this is the first ab-initio calculation of the equation of state of a-SiO2. The calculated points have been corrected for the discontinuities due to the incomplete basis set following the prescription given in ref. Francis and Payne (1990) and then fitted by a Murnaghan function Murnaghan (1944). The resulting equilibrium density (), bulk modulus () and derivate of the bulk modulus with respect to pressure () for the 162-atoms and 81-atoms models are g/cm3, GPa, and g/cm3, GPa, , respectively. These results, especially for the larger model, are in good agreement with the experimental values of g/cm3, GPa, Kondo et al. (1981). Note in particular that the highly unusual negative value of is well reproduced by our calculations. The bulk modulus would probably improve by optimizing and at each volume, held fixed in the equation of state of Fig. 5. The error in is smaller for the larger system which has less geometrical constraints and can more easily respond to the density change.
| size (atoms) | 81 | 162 | 648 |
|---|---|---|---|
| (g/cm3) | 2.23 | 2.30 | 2.29 |
| B (GPa) | 53.5 | 40.5 | 34.1 |
| B′ | -9.0 | -4.3 | -6.3 |
In fact, we have also computed the equation of state within the classical molecular dynamics scheme, using the empirical potential of ref. van Beest et al. (1990) for the 81-, 162-atoms models and for a larger amorphous model containing 648 atoms. The results, reported in table 13, indicate that the overestimation of the bulk modulus in the ab-initio calculations can be ascribed mainly to a size effect.
Bond angle distributions of the fully optimized system at the equilibrium density are plotted in figures 2 and 3 for the 81-atoms and for the 162-atoms model, respectively. The shape of the SiÔSi angles distribution strongly depends on the quenching rate. The model quenched at lower rate (81-atoms cell) has a larger mean SiÔSi angle both in the classical simulation and after ab-initio annealing. Furthermore, for this model the concentration of small (1200) SiÔSi angles is lower than in the model generated fully ab-initio in ref. Sarnthein et al. (1995) and fits better to experimental data.
V.2 Dielectric and photoelastic properties
Since the photoelastic coefficients are very sensitive to density, we have computed the dielectric properties of amorphous silica at the theoretical equilibrium volume (cfr. previous section). The residual, small anisotropy in the structure can also be identified by inspection of the dielectric () tensor:
| (4) |
for the 81-atoms supercell and
| (5) |
for the 162-atoms supercell. For a fully isotropic and homogeneous system, as expected for a truly amorphous system, should obviously reduce to a single number. The experimental value of at 2.2 g/cm3 is 2.125 Schroeder (1980). At the same density the theoretical dielectric constant (1/3 Tr()) is =2.260 for the 81-atoms cell and =2.148 for the 162-atoms cell. The misfit with respect to experiments is similar to those already found for the crystalline phases of silica. For the largest system (162-atoms) the use of point only within the BP framework partially compensates for the error due to LDA, as occurs for -cristobalite (cfr. section 3.5.3) resulting in an accidental better agreement with experiments. The dielectric constant computed at within the BP for a 72-atoms cell of a-SiO2 in ref. Umari and Pasquarello (2002) is 2.00, which confirms that, within BP, converges from below by increasing the cell size.
At the theoretical equilibrium density the dielectric constant is =2.292 and =2.194 for the 81- and 162-atoms cells, respectively
We have computed the response to strain of the structural properties of the amorphous models as reported in table 14.
| 81-atoms | 162-atoms | ||||
|---|---|---|---|---|---|
| 0.151 | 0.154 | 0.157 | 0.15 | 0.11 | |
| 68.6 | 69.1 | 73.4 | 68.5 | 57.5 | |
| Px(Si-Si) | 1.488 | -0.037 | -0.122 | -0.105 | -0.053 |
| Py(Si-Si) | -0.141 | 1.553 | -0.049 | 1.452 | -0.044 |
| Pz(Si-Si) | -0.124 | -0.067 | 1.490 | -0.098 | 1.355 |
The calculated photoelastic coefficients of the 81- and 162-atoms supercells at the theoretical equilibrium density are reported in table 15. The photoelastic coefficients have been calculated by finite differences from the dielectric tensor of systems with strains from -1 to +1 . As discussed in section II and IVb the calculation on the 81-atoms cell have been performed within standard DFPT, while the calculations on the larger 162-atoms supercell have been performed within the Berry phase. Residual structural anisotropies are responsible for the differences among , and values and among , and . A measure of the model isotropy is given by the fulfillment of the Cauchy relation ( 2=). The value of computed by applying the shear strain in the 81-atoms model is -0.074 (cfr. tab. 15) which compares well with the value of (, ranging from -0.069 to -0.092 which suggests a sufficient homogeneity of the small model as well.
| 81-atoms | 162-atoms | exp. | |
|---|---|---|---|
| 0.072 | - | 0.125a - 0.100b | |
| 0.045 | 0.047 | - | |
| 0.053 | 0.085 | - | |
| 0.217 | 0.223 | 0.27a - 0.285b | |
| 0.230 | - | - | |
| 0.224 | - | - | |
| 0.209 | 0.227 | - | |
| 0.209 | 0.238 | - | |
| 0.197 | 0.235 | - | |
| -0.074 | - | -0.073a |
Agreement with experiments is fair, but less satisfactory than the performances of DFPT-LDA for crystalline phases. In particular, the ratio is largely underestimated in our model with respect to experiments. In view of the excellent results of DFPT-LDA for crystalline silica, the discrepancy with experiments for a-SiO2 could be naturally ascribed to an insufficient quality of our a-SiO2 models, either due to a size effect or to a still too fast quenching rate. However, we should also note that the measurement of the absolute values of and is very delicate and to our knowledgment only two independent measurements have been performed so far Schroeder (1980); Vedam (1950).
In order to obtain insight into the different microscopic contributions to photoelasticity and shed light on the relationship between structural properties and photoelastic response, we have developed a phenomenological model of photoelasticity in silica, as described in the next section.
VI Phenomenological model of photoelasticity in silica
In order to identify the main microscopic features ruling photoelasticity in silica, we have devised a phenomenological model of the dielectric properties transferable both to the crystalline and amorphous phases of SiO2 by fitting on the ab-initio database on photoelasticity in crystalline silica reported in the previous sections.
At this aim, we have assumed that the dielectric response of silica could be embodied in an ionic polarizability tensor of the oxygen ions, whose value is assumed to depend on the SiÔSi angle only. The dielectric tensor can be obtained from a site dependent oxygen polarizability, , as described below. The dipole moment at site is related to the local field via the polarizability tensor as
| (6) |
The local electric field acting on a polarizable object at site is then Kirkwood (1936):
| (7) |
where is the electric displacement, the total number of polarizable centers per cell and is a symmetric tensor defined as:
| (8) |
where are the Bravais lattice vectors and is the distance between sites and in cells separated by . The sum of over the Bravais lattice vectors is performed as an Ewald sum as described in ref. Allen and Tildsey (1987).
The electric displacement is in turn equal to , where is the macroscopic electric field and the electric polarization can be expressed as
| (9) |
where is the cell volume. A set of linear equations which relates the local field to the macroscopic electric field is obtained from eqs. 7-9 as:
| (10) |
or in a compact matrix form
| (11) |
is the identity matrix, and are expressed as 3N vectors and is a 3Nx3N matrix consisting of 3x3 blocks defined as
| (12) |
For a cubic lattice equations 10 yield the Clausius-Mossotti (Lorentz-Lorenz) formula (see ref. Kirkwood (1936) for details). However, none of the crystalline polymorphs of SiO2 is cubic, thus the term containing the dipole lattice sum () has to be explicitly evaluated.
From eq. 9 and eq. 11, the following relation is obtained:
| (13) |
The inversion of the matrix is performed in the 3N-dimensional space. Finally, the dielectric susceptibility tensor () results in:
| (14) |
From , both the dielectric () and the photoelastic tensors can be derived.
In order to exploit eq. 14, in our empirical model we have assumed that the polarizable centers in silica are the oxygen ions. Secondly, we have also assumed that the oxygen polarizability depends on the SiÔSi angle only. These choices can be justified only a posteriori from comparison of the results produced by the phenomenological model with the ab–initio data. However, to support our model we can argue that most of the valence charge in SiO2 is located on the oxygen ions and, secondly, that both the structural differences among the different tetrahedral phases of silica (either crystalline or amorphous) and the deformations induced by strain mainly rely on the distribution of the SiÔSi angles. The internal structure of the tetrahedra (OO angles and Si-O bond lengths) is almost the same in the different polymorphs and undergoes minor deformations upon strain since the open structure of silica allows to accommodate strain mostly by rotations of the corner–sharing tetrahedra.
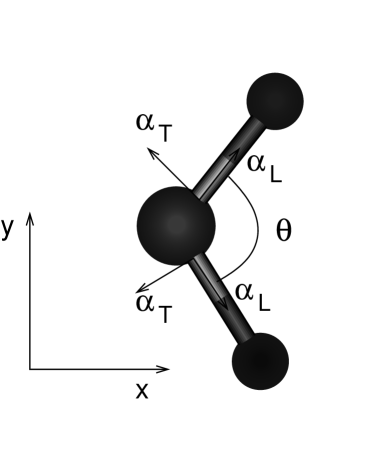
Our model of silica polarizability can also be understood as a particular case of the commonly used bond polarizability model (BPM). In the BPM the polarizability is expressed as the sum of Si-O bond polarizabilities given by Umari et al. (2001)
| (15) |
where is the vector joining the silicon and oxygen atoms, and and represent a longitudinal and a transversal polarizability of the Si-O bond. and usually depend on the Si-O bondlength (see fig. 6). In our model we have introduced a second transverse bond polarizability, , in the direction orthogonal to the Si-O-Si plane (direction z in fig. 6). We have made , and dependent on the SiÔSi angle (), but independent on the Si-O bondlength. The dependence of the polarizability on the Si-O distance is crucial to reproduce Raman intensities, which are ruled by the modulation of the bond polarizability upon phonon displacements, that obviously involve both angle modulations and bond stretching. Conversely, the change of , and with Si-O bondlength is not essential to describe photoelasticity, since strain-induced structural relaxations mainly consist of bond angles deformations not affecting the Si-O distances.
In this approximation the dielectric response can be cast into a model based on the polarizability of the oxygen ions only which is given by
| (16) |
with and (cfr. fig. 6 for axis orientations). The contribution of each polarizable unit to the dielectric susceptibility is
| (17) |
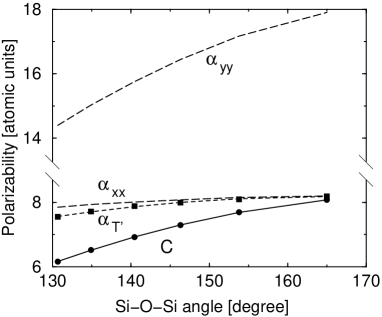
where is the rotation matrix that operates the transformation from the local reference system represented in figure 6 to the absolute reference system of the solid, in which the -th Si-O-Si unit is embedded. The parameters , and have to be determined and, in principle, all of them depend on . We have decided to fit these parameters on the dielectric tensor of -cristobalite at several densities (see fig. 7), since -cristobalite responds to compression mainly modifying the Si--Si angles, maintaining the Si-O bondlength unchanged Mauri et al. (2000). We have checked that changing the density of -cristobalite from 2.83 to 2.05 g/cm3 (the theoretical equilibrium density is 2.54 g/cm3) the Si--Si angle changes from 130o to 165o with a maximum variation of the Si-O bondlength of 0.006 Å (see fig. 8).


However, for -cristobalite the equations for (eq. 14) independent by symmetry are only two, not sufficient to fit all the three functions , and in eq. 16. For this reason, has been assumed independent on and set equal to the value obtained from the fitting of the ab-initio Raman spectrum of -quartz within the BPM by Umari et al. Umari et al. (2001) ( a.u.). The parameterization of the BPM proposed by Umari et al. reproduces the ab-initio Raman intensities of -quartz within 15. The results for and obtained from eq. 14 have been interpolated by a second order polynomial (see fig. 9), whose coefficients are reported in table 16.
| a0 | a1 | a2 | |
|---|---|---|---|
| -20.46 | 18.38 | -2.942 | |
| -6.141 | 9.956 | -1.730 |
As shown in fig. 9 the oxygen polarizability increases by increasing the Si--Si angle. In fact, the Si-O bond becomes more ionic by increasing the Si--Si angle and the larger charge on oxygen ion makes it more polarizable. The increased ionicity of Si-O bond at larger SiOSi angles is further confirmed by the dependence of the effective charge of oxygen ions on the SiOSi angles shown in 10. The latter figure reports the distribution of the effective charges () of oxygen ions in different sites of our a-SiO2 model, computed within DFPT Baroni et al. (2001).

The transferability of the oxygen polarizability shown in fig. 9 has been checked by comparing the dielectric constants of the other silica polymorphs discussed in the previous sections, as obtained within the phenomenologial model and by DFPT (see table 17). The agreement is overall satisfactory. In particular, birefringence of quartz and -cristobalite are well reproduced.
| DFPT | model | ||
| -quartz | 2.590 | 2.630 | |
| P=0 GPa | 2.620 | 2.670 | |
| -quartz | 2.694 | 2.775 | |
| P=3 GPa | 2.737 | 2.818 | |
| -quartz | 2.812 | 2.912 | |
| P=7 GPa | 2.865 | 2.970 | |
| -crist. | 2.281 | 2.252 | |
| 2.251 | 2.227 | ||
| 2.297 | 2.285 | ||
| a-SiO2 | 2.292 | 2.281 | |
| 2.288 | 2.275 |
The discrepancies for quartz at high pressure may be due to the change of the Si-O bondlength upon compression (see table 5), whose effect on the oxygen polarizability has been neglected in our model. This effect is less important in -cristobalite, whose more open structure can easily accommodate density changes with minor effect on the Si-O bondlength. The phenomenological model reproduces the dielectric constant of a-SiO2 as well.
The transferability of the model has been further checked by computing the photoelastic tensor. This is given by the derivative of the dielectric susceptibility tensor (eq. 14) with respect to the strain tensor as
| (18) |
where the matrix is defined as (see eq. 14), and the arguments in square brackets indicate 3x3N matrices. The change of the oxygen polarizability with strain can be expressed in terms of and deduced from Fig. 9. All the other derivatives have been obtained by finite differences. Eq. 18 can provide an estimate of the photoelastic coefficients of all silica polymorphs made of corner–sharing tetrahedra.
The photoelastic coefficients calculated within the phenomenological model for a few silica polymorphs are compared to ab-initio data in table 18 (second and first column, respectively). The same comments made above for the dielectric constants still hold for the photoelastic tensor. The agreement with ab–initio data is better for system at ambient conditions than at high pressure. Overall we can conclude that the phenomenological model has good transferability.
Table 18 reports also the contribution from the individual terms supplying to the expression of in eq. 18.
| DFPT | model | Lorentz | ||||
| -quartz | 0.240 | 0.301 | 0.043 | 0.278 | 0.469 | |
| P=0 GPa | 0.085 | 0.083 | -0.087 | 0.067 | 0.245 | |
| -quartz | 0.215 | 0.313 | 0.038 | 0.296 | 0.452 | |
| P=7 GPa | 0.067 | 0.079 | -0.078 | 0.105 | 0.239 | |
| 0.124 | 0.090 | -0.082 | 0.049 | 0.290 | ||
| -cristobalite | 0.291 | 0.275 | 0.040 | 0.236 | 0.470 | |
| 0.269 | 0.236 | 0.041 | 0.207 | 0.351 | ||
| 0.072 | 0.103 | -0.082 | 0.074 | 0.168 | ||
| a-SiO2 | 0.230 | 0.217 | 0.042 | 0.227 | 0.319 | |
| 0.224 | 0.214 | 0.038 | 0.221 | 0.306 | ||
| 0.218 | 0.161 | -0.013 | 0.100 | 0.353 | ||
| 0.244 | 0.276 | -0.010 | 0.275 | 0.363 | ||
| -cristobalite | 0.293 | 0.319 | 0.025 | 0.289 | 0.408 | |
| 0.293 | 0.325 | 0.046 | 0.296 | 0.449 | ||
| 0.152 | 0.154 | -0.091 | 0.105 | 0.228 |
The first term in the right-hand side of eq. 18 () comes from the derivative of the density, which is null for strains preserving the volume i.e. for . The contribution of this term is always positive. The second term in eq. 18 contains the derivative of the polarizability of the Si-O-Si units. It can be expressed as a function of the Si--Si bond angle and depends on the derivative of the functions and :
| (19) |
with
| (20) |
This term provides a negative contribution to all the components of the photoelastic tensor. The last column in table 18 reports the photoelastic coefficients obtained from eq. 18, but neglecting the contribution from . By comparing the second and the last columns in table 18, it is clear that the change in polarizability with the SiÔSi angle is essential to correctly reproduce the ab-initio data. Although it has not been explicitly displayed in eq. 18, the derivative of also contributes to the term .
The last term in eq. 18 depends on the derivative of the rotation matrices with respect to strain. It is related to the geometrical effect of alignment of the Si-Si axis of the Si-O-Si unit (cfr. fig. 6) along the axis of a tensile strain. This effect results in an increase of the off-diagonal components and a reduction of the diagonal components of the photoelastic tensor. This effect accounts for most of the observed difference between diagonal and off-diagonal photoelastic coefficients ( and for instance). This is proven by the results in the third column of table 18, which reports the contribution to the photoelastic coefficients due to the last term in eq. 18 only. In fact the difference for a-SiO2 and -cristobalite, and for -cristobalite and -quartz, in the second column of table 18, are close to the results in the third column. We note that the identification of the alignment of the Si-O-Si units as the source of a large value of and is consistent with the structural response data in tables 7, 11 and 14. The small value of in -cristobalite is consistent with the weak e alignment of the tetrahedra since for strain along the x-axis is weak (cfr. table 11).
The term depending on the derivative of the matrix accounts for the the presence of local fields correction and its modification upon strain. Its contribution to the photoelastic coefficients is inferred by computing within the Lorenz-Lorentz approximation. The results, shown in the 4th column of tab. 18, demonstrate that local field effects beyond the Lorenz-Lorent approximation (i.e. inclusion of anisotropic local fields produced by near molecules) modify the photoelastic coefficients for crystalline phases up to 45. As expected, corrections to the Lorenz-Lorentz approximation are small for the amorphous silica models. The phenomenological model allowed us to address the role of the size of the simulation cell on the photoelastic tensor of a-SiO2. This has been done by computing the photoelastic coefficient within the phenomenological model for the same 81-atoms and 162-atoms models discussed so far and for a larger model of 648 atoms, all optimized with the BKS potential. The results, reported in table 19, quantify the errors due to finite size effects. Isotropy in the diagonal components are achieved only for the largest model. However, errors due to finite size effects for cells containing 81-162 atoms are only slightly larger than the errors due to LDA-DFT.
| 81-atoms | 162-atoms | 648-atoms | |
|---|---|---|---|
| 0.115 | 0.100 | 0.132 | |
| 0.161 | 0.143 | 0.141 | |
| 0.227 | 0.231 | 0.234 | |
| 0.237 | 0.237 | 0.227 | |
| 0.245 | 0.216 | 0.220 | |
| 0.240 | 0.239 | 0.220 |
VII Discussion and Conclusions
Photoelasticity of crystalline and amorphous silica has been studied by density functional perturbation theory. This framework has been checked successfully first on paradigmatic semiconducting and insulating systems, silicon and MgO. The same framework has been applied to -quartz providing photoelastic constants in good agreement with previous calculations Detraux and Gonze (2001) and with experiments. The photoelastic coefficients have been computed also for -quartz under pressure up to 7 GPa, and for -cristobalite and -cristobalite at normal conditions. The theoretical results obtained for these latter systems are predictions open to experimental verification.
We have thus verified that the simple DFPT-LDA framework is suitable to reproduce accurately the photoelastic coefficients. Correction of the DFT-LDA band gap by a scissor operator is necessary to reproduce the dielectric constants but has minor effects on the photoelastic tensor.
We have then studied photoelasticity for models of amorphous silica, containing up to 162 atoms, generated by quenching from the melt in molecular dynamics simulations. The calculated photoelastic coefficients are in good agreement with experimental data. Our ab-initio framework has thus valuable predictive power also for the amorphous phase.
Along with the calculated photoelastic coefficients, we have collected data on the structural response to strain of different crystalline phases. The analysis of these data has aided us in the development of a phenomenological model of photoelasticity in silica polymorphs. In fact the analysis of the structural changes upon strain has shown that silica responds to strain mainly via rotations of the tetrahedral units (thus changing the Si-Ô-Si angles) with smaller changes of the intra-tetrahedral (O--O) angles. For instance, the most prominent effect of tensile stress is the alignment of the Si-O-Si units to the direction parallel to the strain axis.
These results suggested us to model the dielectric properties of silica polymorphs in terms of Si-O-Si polarizable units with polarizability dependent on the Si-Ô-Si angle only. At this aim we have developed a phenomenological model fitted on the dielectric constant of -cristobalite at different densities. The model consists of polarizable oxygen ions with anisotropic polarizability dependent on the Si-Ô-Si angle. The validity of the model has been proven by comparing dielectric and photoelastic coefficients computed within the phenomenological model to the results of DFPT calculations. The agreement is good and the simple phenomenological model sheds light on the main contributions to photoelasticity in silica polymorphs. It turns out that the change in the oxygen polarizability with strain, via the SiÔSi angle is essential to reproduce the photoelastic response. The neglect of this term introduces errors of up to 50 . Secondly, the difference in the diagonal and off-diagonal photoelastic coefficients (e.g. and ), which is particularly large in a-SiO2, is due to the alignment of the SiOSi units along the axis of tensile strain. Finally, while local fields beyond the Lorentz-Lorent approximation (via dipole-dipole interactions) and their change upon to strain are important to reproduce the dielectric and photoelastic properties (expecially birefringence) of the low-symmetry crystalline phases, they are obviously negligible for a-SiO2. This result confirms that our models of a-SiO2, despite their small size, are already good model of a homogeneous isotropic amorphous network.
In summary, our work has demonstrated the reliability of the ab-initio DFT-LDA framework in the study of photoelasticity of silica systems and has provided a phenomenological model of the dielectric properties transferable to several crystalline and amorphous polymorphs. The same ab-initio framework, supplemented by the phenomelogial model, could also provide a microscopic description of the photoelasic properties of more complex silica-based glasses.
VIII Acknowledgments
D.D. acknowledges Pirelli Cavi e Sistemi S.p.a. for financial support. This work has been partially supported by the INFM Parallel Computing Initiative.
References
- Limberger et al. (1996) H. Limberger, P. Fonjallaz, R. Salathe, and F. Cochet, Appl. Phys. Lett. 68, 3069 (1996).
- Schenker and Oldman (1997) R. Schenker and W. Oldman, J. Appl. Phys. 82, 1065 (1997).
- Baroni et al. (2001) S. Baroni, S. de Gironcoli, A. dal Corso, and P. Giannozzi, Rev. Mod. Phys. 73, 515 (2001).
- Detraux and Gonze (2001) F. Detraux and X. Gonze, Phys. Rev. B 63, 115118 (2001).
- Perdew and Zunger (1981) J. Perdew and A. Zunger, Phys. Rev. B 23, 5048 (1981).
- Troullier and Martins (1991) N. Troullier and J. Martins, Phys. Rev. B 43, 1993 (1991).
- Gonze et al. (1991) X. Gonze, R. Stumpf, and M. Scheffler, Phys. Rev. B 44, 8503 (1991).
- Monkhorst and Pack (1976) H. J. Monkhorst and J. D. Pack, Phys. Rev. B 13, 5188 (1976).
- (9) S. Baroni, A. dal Corso, S. de Gironcoli, and P. Giannozzi, http://www.pwscf.org.
- van Beest et al. (1990) B. van Beest, G. Kramer, and R. van Santen, Phys. Rev. Lett. 64, 1955 (1990).
- Tse and Klug (1992) J. Tse and D. Klug, Phys. Rev. B 46, 5933 (1992).
- Car and Parrinello (1985) R. Car and M. Parrinello, Phys. Rev. Lett. 55, 2471 (1985).
- (13) CPMD V3.5 Copyright IBM Corp 1990-2001 and Copyright MPI fuer Festkoerperforschung Stuttgart 1997-2001.
- Vanderbilt (1990) D. Vanderbilt, Phys. Rev. B 41, 7892 (1990).
- King-Smith and Vanderbilt (1993) R. D. King-Smith and D. Vanderbilt, Phys. Rev. B 47, 1651 (1993).
- Resta (1994) R. Resta, Rev. Mod. Phys. 66, 899 (1994).
- Putrino et al. (2001) A. Putrino, D. Sebastiani, and M. Parrinello, J. Chem. Phys. 113, 7102 (2001).
- Levine and Allan (1991) Z. Levine and D. Allan, Phys. Rev. B 43, 4187 (1991).
- Levine et al. (1992) Z. Levine et al., Phys. Rev. B 45, 4131 (1992).
- Reynolds et al. (1995) J. Reynolds, Z. Levine, and J. Wilkins, Phys. Rev. B 51, 10477 (1995).
- (21) ABINIT is a common project of teh Université Catholique de Louvain, Corning Incorporated, and other contributprs (http://www.abinit.org); X. Gonze et al., Comput. Materals Science 25, 478-492 (2002)..
- de Gironcoli et al. (1989) S. de Gironcoli, S. Baroni, and R. Resta, Phys. Rev. Lett. 62, 2853 (1989).
- dal Corso et al. (1993) A. dal Corso, R. Resta, and S. Baroni, Phys. Rev. B 47, 16252 (1993).
- Biegelsen (1974) D. Biegelsen, Phys. Rev. Lett. 32, 1196 (1974).
- von Barth and Gelatt (1980) U. von Barth and C. Gelatt, Phys. Rev. B 21, 2222 (1980).
- Louie et al. (1982) S. Louie, S. Froyen, and M. Cohen, Phys. Rev. B 26, 1738 (1982).
- Murnaghan (1944) D. Murnaghan, Proc. Nat. Acad. Sci. USA 30, 224 (1944).
- Cardona et al. (1959) M. Cardona, W. Paul, and H. Brooks, J. Phys. Chem. Solids 8, 204 (1959).
- Vedam and Schmidt (1966) K. Vedam and D. Schmidt, Phys. Rev. 146, 548 (1966).
- Hamann (1996) D. Hamann, Phys. Rev. Lett. 76, 660 (1996).
- Levien et al. (1980) L. Levien, C. Prewitt, and D. Weidner, Am. Mineral. 65, 920 (1980).
- Narasimhamurty (1969) T. Narasimhamurty, J. Opt. Soc. Am. 59, 682 (1969).
- Wyckoff (1963) R. Wyckoff, Crystal Structures, 2nd ed. (Interscience Publishers, New York, 1963).
- Hemley et al. (1994) R. Hemley, C. Prewitt, and K. Kingma, Rev. Mineral. 29, 41 (1994).
- Chelikowsky et al. (1990) J. Chelikowsky, J. H.E. King, N. Troullier, J. Martins, and J. Glinnemann, Phys. Rev. Lett. 65, 3309 (1990).
- Pluth et al. (1985) J. Pluth, J. Smith, and J. J. Faber, J. Appl. Phys. 57, 1045 (1985).
- Lide (1998) D. Lide, Handbook of Chemistry and Physics (CRC Press, Boca Raton, New York, 1998).
- Wright and Leadbetter (1975) A. Wright and A. Leadbetter, Philos. Mag. 31, 1391 (1975).
- Spearing et al. (1992) D. Spearing, I. Farnan, and J. Stebbins, Phys. Chem. Minerals 19, 307 (1992).
- Umari and Pasquarello (2002) P. Umari and A. Pasquarello, Phys. Rev. Lett. 89, 157602 (2002).
- Sarnthein et al. (1995) J. Sarnthein, A. Pasquarello, and R. Car, Phys. Rev. B 52, 12690 (1995).
- Benoit et al. (2000) M. Benoit, S. Ispas, P. Jund, and R. Jullien, Eur. Phys. J. B 13, 631 (2000).
- Franzblau (1991) D. Franzblau, Phys. Rev. B 44, 4925 (1991).
- Francis and Payne (1990) G. Francis and M. Payne, J. Phys. Condens. Matt. 2, 4395 (1990).
- Kondo et al. (1981) K. Kondo, S. Ito, and A. Sawaoka, J. Appl. Phys. 52, 2826 (1981).
- Schroeder (1980) J. Schroeder, J. Non-Cryst. Solids 40, 549 (1980).
- Vedam (1950) K. Vedam, Phys. Rev. 78, 472 (1950).
- Kirkwood (1936) J. Kirkwood, J. Chem. Phys. 4, 592 (1936).
- Allen and Tildsey (1987) M. Allen and D. Tildsey, Computer Simulations of Liquids (Clarendon Press, Oxford, 1987).
- Umari et al. (2001) P. Umari, A. Pasquarello, and A. dal Corso, Phys. Rev. B 63, 094305 (2001).
- Mauri et al. (2000) F. Mauri, A. Pasquarello, B. Pfommer, Y. Yoon, and S. Louie, Phys. Rev. B 62, R4786 (2000).