Assortative model for social networks
Abstract
In this paper we present a new version of a network growth model, generalized in order to describe the behavior of social networks. The case of study considered is the preprint archive at cul.arxiv.org. Each node corresponds to a scientist, and a link is present whenever two authors wrote a paper together. This graph is a nice example of degree-assortative network, that is to say a network where sites with similar degree are connected each other. The model presented is one of the few able to reproduce such behavior, giving some insight on the microscopic dynamics at the basis of the graph structure.
pacs:
05.40.-a, 64.60.-1, 87.10.+eNetworks B85 ; re3 are present in different phenomena. The Internet FFF99 ; CMP00 is a graph composed by different computers, connected by cables; the WWW HA99 ; BAJ99 is a graph composed by HTML documents connected by hyperlinks, even social structures N01 ; ASBS00 can be described as graphs. In the latter case the nodes are individuals connected by different relationships. Even if the degree probability distribution (i.e. the frequency to find a number of links per node) is very often scale-free (i.e. ), other quantities allow to distinguish between the various cases. For such purpose, one of the most interesting is the assortativity by degree. Assortativity can be defined as the tendency for nodes in a social network to form connections preferentially to others similar to themNewman . This mechanism has been proposed as the key ingredient for the formation of communities in networksVespignani ; NEW1 . Using this quantity, it is possible to distinguish the technological networks, where instead, the behavior is rather degree-disassortative, so that vertices tend to be linked to others different from them. Despite the relative simplicity of such behavior few modelsBB01 ; CCDM02 ; Calla of network growth are able to reproduce the formation of communities and no one explains the difference between social and technological networks.
Here we analyze a specific case of social network, namely the ArXiv:cond-mat repository of preprints at cul.arxiv.gov collected by Mark NewmanN01 . The nodes are the authors of the various papers and a link is present between them whenever they wrote at least one paper together. We are able to reproduce most of the features of such network by a suitable modification of a model presented in Ref.GUIDO . The quantities we measured in the real data and in the model are the degree probability distribution, the degree correlation between neighbor sites, the clustering and the site betweenness probability distribution. A summary of the results is reported in Tab.1.
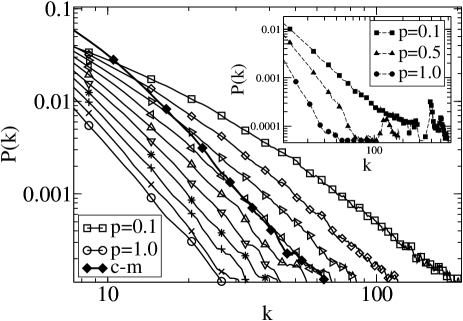
The degree is the number of links per node. As expected, the degree probability distribution of the cond-mat data show a power law behavior of the kind with (see diamonds in Fig.1).
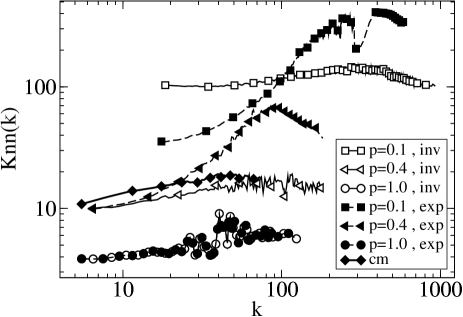
We then measure the degree correlation between nodes. This is done by introducing the quantity , giving the average degree of the site neighbors of one site whose degree is . increases if nodes are correlated by degree (assortative networks). It decreases if they are anti-correlated (disassortative networks). It is flat if they are uncorrelated (for example, in the BA modelAnnd ). in the data has an increasing trend, consistent with our expectation for an assortative network. A power law seems to be an appropriate fit in the region of growth where is about (See diamonds in Fig. 2). Another measure of assortativity we considered is the assortativity coefficient . A complete definition of this quantity can be found in ref.NEW3 , here we can say that it is proportional to the connected degree-degree correlation function. In this paper we find that both and have the same behaviour by varying the parameters of the model. We therefore focus our analysis only on the .
Clustering coefficient for every site gives the probability that two nearest neighbors of vertex are also neighbors each other. , is the average clustering coefficient for sites whose degree is , and it measures the tendency to form cliques where each nearest neighbor of a node (with degree ) is connected to each other. In real networks this usually decreases with a power-law ( for the data we analyzed) because hubs tend to play the role of connections between separate clusters in the graph, i.e. clusters that have few other interconnections than the ones passing through the hub. Then the high degree node tends to have low clustering coefficient.
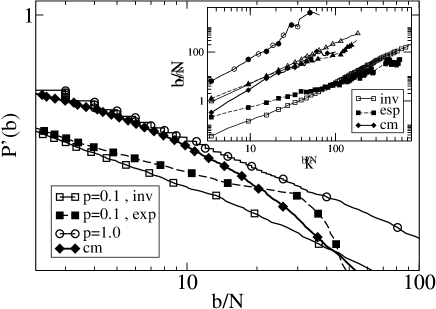
The betweenness of a vertex gives the probability that the site is in the path between two other vertices in the graph. Therefore it might be interpreted as the amount of the role played by the vertex in social relation between two persons and . This quantity behaves as a power law both in its distribution () and in dependence upon . Analogously to the clustering case we defined the average betweenness for vertices whose degree is . From Fig. 3 we find with .
The model we defined in order to reproduce the data is inspired to the preferential attachment oneBAJ99 . The main variation consists in allowing growth by addition of new links between old nodes. More particularly at every step of growth:
-
1.
with probability a new node is wired to an existing one; the choice of the destination node is left to Barabási-Albert preferential attachment rule(’rich gets richer’). Thus the probability of adding a new node and connecting it to an old node is
(1) -
2.
with probability a new edge is added (if absent) between two existing nodes. These are chosen on the basis of their degree. In other words, the probability of adding an edge between node and node is a . This can be written as , being the second factor a conditioned probability. is the rule for choosing the first of the two nodes, and again it is determined by the preferential attachment. The functional form of can be chosen so as to favor links between similar or different degree. In this way, the probability of adding a new edge and connecting two old non-linked nodes is
(2)
In the limit of the model reduces to a traditional BA tree. In order to reproduce the assortative behavior we have explored two different functional forms: an inverse dependence
| (3) |
and an exponential dependence, which clearly has a stronger effect
| (4) |
Results of simulations for the various values of are summarized in Tab.1, where the fitted exponents of the distributions and the global quantities describing the networks are reported. As grows from to the change in the statistical properties is consistent with the rough estimate for the degree distribution exponent given in Ref.GUIDO
| (5) |
As tends to 1.0, the exponent approaches the value 3 of the BA model. A radically different behavior appears in the exponential case. While for high we still have scale-free distribution, as decreases a structure in emerges. Two regimes become visible: a power-law distribution for low and a peaked distribution for high .
Similar behavior is evident for all the quantities depending on . The transition happens around . This behavior can be explained as follows. Edges are added mainly between high degree nodes because of the ’preferential attachment option’ adopted in the choice of the first vertex. Moreover, the strong assortativity deriving from the exponential form imposes an high degree to the second node as well. Therefore, when the ’wiring component’ of the growth prevails ( below ), a cluster of hubs appears. Their degrees are sharply distributed around a high value. Thus a strong assortativity can break up the self-similar structure of the graph, superimposing a distribution with a typical scale on the scale-free one. This highlights the typical aspect of an assortative network, where the hubs (highly connected nodes) connect with other hubs, generating a core-periphery structure. This structure is emphasized in the exponential case, where assortativity becomes so large to induce a phase transition from a scale-free graph to a network with a characteristic scale for high degrees.
The slope of grows as the assortativity is increased, moving from the inverse to the exponential form, and reducing the value of . The slight inversion in the growth of the exponent visible at small can be explained as a finite size effect, highlighted by the intense assortativity for very low values of the parameter . The BA limit is visible as well, being the distribution roughly flat for . By measuring and we note that their trends, as the parameters change, are analogous. Reasonably enough, we can conclude that, at least for our model, the exponent and the coefficient carry the same information.
The clustering coefficient distribution versus the degree fails to reproduce the real trends. These are usually decreasing with a power-law; the model, instead, generates increasing trends. We fit them with a power law with positive exponent. We can explain qualitatively such incongruence by taking into account high degree vertices. In real networks hubs tend to play the role of connections between separate clusters in the graph, with few links between each other (apart from the ones attached to the hub). Therefore this nodes tend to have low clustering coefficient. In our model, on the other hand, all the hubs are aggregated together. Thus, even producing an assortative network it cannot reproduce a network with decreasing with . We comment that such behavior in the real data is due to the different areas of expertise of various authors, such that the most productive scientists in one discipline do not collaborate with the top scientists of other disciplines within cond-mat. Imposing such separation on the hubs produced by the model reproduces the correct behavior of data (or rather analyzing the data by dividing the papers according to the fields).
As regards the betweenness, is an increasing function of (hubs are crucial in the exchange of information). On the other hand its slope decreases as p is reduced. In a tree like structure (), hubs are play the role of bottlenecks for the flow of information between separate parts of the networks. Therefore, they have very high site betweenness. Approaching to a core-periphery structure, each node of the core becomes approximately as good as the others in performing this job. Therefore the site betweenness of high degree nodes decreases.
The site betweenness distribution or is plotted after integration in Fig.3. We obtain a power-law with an exponent not depending significantly on . Its averaged value is 2.0, that is equal to the measured value for a BA tree goh . It is interesting to notice that also here a characteristic scale appears at high values of the site betweenness. This is visible in the bump that distorts the scale free nature of the integrated distribution. Notice that we would see a similar distorted trend if we integrated the degree distribution.
In ref.goh2 the following scaling relation is demonstrated for the BA model
| (6) |
Thus, the exponent of the site betweenness plotted versus is related to the previous two by the equality
| (7) |
This relation stands for disassortative and not assortative networks, while deviations are shown for assortative ones in ref.goh3 . By computing this difference we noticed a slightly growing trend, as is decreased, giving further evidence that assortativity breaks the scaling relation.
The qualitative agreement between the distribution of the real data and the simulation shows that our model is able to catch the basic aspects of the real graph, with the only above mentioned exception of the clustering coefficient versus . A quantitative comparison suggests that the exponential form is too strong to describe existing networks. In fact, the appearance of a characteristic-scale structure like the one foreseen in our model has not been observed in any of the real assortative networks studied until now. One must notice as well the slight difference in the exponents of the site betweenness distribution (2.0 for the simulation and 2.2 for cond-mat). Following ref.goh , networks should be divided in two classes of universality according to the exponent of their site betweenness distribution. In fact this seems to assume always one of the two values 2.0 and 2.2. Co-authorship networks fall in the second class. Therefore, if the hypothesis of ref.goh were confirmed, our model would fail guess the correct universality class for the networks that it is thought to represent. However, this would be reasonable, since the model can be reduced to a BA tree, which falls in the first class.
In conclusion, we have studied a generalized graph growth model, where by tuning a parameter , it is possible to weight the role of growing (addition of new nodes) and mixing (addition of new edges) in the microscopical behavior of the network. The assortativity can be controlled as well by fixing a functional form for the wiring probability. Macroscopic characteristics of the network, i.e. statistical distributions, have been derived by simulations in the assortative case. The results reveal the effects of assortativity on the topology of a network, that can be as dramatical as a phase transition. Moreover, the simulation succeed in reproducing most of the features of real assortative networks. Future work could focus on many aspects: new nodes could be added carrying edges instead of one, in order to have a BA graph rather than a BA tree in the limit; the rate of addition of new nodes and of new links could be measured for real networks to have a fine tuning of the parameter ; more general functional forms for the wiring could be investigated, and even the preferential attachment choice could be changed, in order to have a significant wiring also for low degree nodes. Further extensions are possible because of the rich flexibility of the model.
We thank the FET Open project IST-2001-33555 COSIN.
References
- (1) B. Bollobás, Random Graphs (Ac. Press, London) (1985).
- (2) S.N. Dorogovtsev and J.F.F. Mendes, Advances in Physics 51, 1079 (2002)
- (3) M. Faloutsos, P. Faloutsos and C. Faloutsos, Proc. ACM, SIGCOMM (1999).
- (4) G. Caldarelli, R. Marchetti and L. Pietronero, Europhys. Lett. 52, 386 (2000).
- (5) B.A. Huberman and L.A. Adamic Nature 399, 130 (1999).
- (6) A.-L. Barabási, R. Albert and H. Jeong, Physica A 272, 173 (1999).
- (7) M.E.J. Newman, Proc. Nat. Acad. Sci. 98, 404 (2001)
- (8) L.A.N. Amaral, A. Scala, M. Barthelemy and H.E. Stanley, Proc. Nat. Acad. of Sci. 97, 11149 (2000)
- (9) M.E.J. Newman, M. Girvan to appear in Proceedings of the XVIII Sitges Conference on Statistical Mechanic 99, 12583 (2003).
- (10) M.Boguna, R. Pastor-Satorras, A. Vespignani ArXiv:cond-mat/0301149).
- (11) M.E.J. Newman Phys. Rev. E 67, 026126 (2003).
- (12) G. Bianconi and A.-L. Barabási Europhysics Letters 54, 436 (2001).
- (13) G. Caldarelli, A. Capocci, P. De Los Rios and M.A. Muñoz, Physical Review Letters 89, 258702 (2002).
- (14) D.S. Callaway, J.E. Hopcroft, J.M. Kleinberg, M.E.J. Newman and S.H. Strogatz Phys.Rev.E 64, 041902 (2001).
- (15) G. Caldarelli, P. De Los Rios, L. Pietronero ArXiv:cond-mat/0307610.
- (16) R. Pastor-Satorras, A. Vazquez, A. Vespignani Phys.Rev.Lett. 87, 258701 (2001).
- (17) M.E.J. Newman Phys. Rev. Lett. 89, 208701 (2002).
- (18) K.-I. Goh, E.S. Oh, H. Jeong, B. Kahng, D. Kim Proc. Natl. Acad. Sci. 99, 12583-12588 (2002)
- (19) K.-I. Goh, B. Kahng, D. Kim Phys. Rev. Lett. 87, 278701 (2001).
- (20) K.-I. Goh, E. Oh, B. Kahng, D. Kim Phys. Rev. E 67, 017101 (2003).
| cm | 2.99 | 0.14-0.35 | -0.80 | 1.81 | 0.41 | ||||||