Large and Small Polaron Excitations in La2/3(Sr/Ca)1/3MnO3 Films
Abstract
We present detailed optical measurements of the mid-infrared (MIR) excitations in thin films of La2/3Sr1/3MnO3 (LSMO) and La2/3Ca1/3MnO3 (LCMO) across the magnetic transition. The shape of the excitation at about 0.2 eV in both samples is analyzed in terms of polaron models. We propose to identify the MIR resonance in LSMO as the excitation of large polarons and that in LCMO as a small polaron excitation. A scaling behavior for the low-energy side of the polaronic MIR resonance in LSMO is established.
pacs:
75.47.Lx, 71.38.-k, 72.80.-r, 78.20.-eHistorically, polarons were best identified in measurements with charge carriers in non-metals (e. g., from F-centers in alkali halides) or doped semiconductors. More recently, the concept of polaronic excitations has again been in the focus of solid state research with the advent of strongly correlated electronic systems, especially with the discoveries of high-temperature superconductivity and the colossal magnetoresistance in thin films of La2/3Ca1/3MnO3 (LCMO) von Helmolt et al. (1993). In both classes of these correlated materials, cuprates and manganites, it is now widely accepted that, in the presence of a strong electron-phonon coupling, polaronic effects have to be considered an important ingredient to understand the complex physical properties of these compounds Calvani (2001).
The fingerprints of polarons in the manganites are usually associated with the temperature dependence of high-temperature dc-resistivity Worledge et al. (1996) and the occurrence of a mid-infrared (MIR) excitation in the optical conductivity — termed polaron peak in the following — which has been observed by several authors in both single crystalline Okimoto et al. (1997); Jung et al. (1998); Kim et al. (1998); Saitoh et al. (1999); Lee et al. (1999) and thin film manganites Kaplan et al. (1996); Quijada et al. (1998); Machida et al. (1998). Though evidence of the signature of polarons in the optical conductivity Reik and Heese (1967); Goovaerts et al. (1973); Emin (1975) has been reported abundantly, the question whether the charge carriers are rather delocalized (large polarons, LP) or strongly localized in a locally polarized lattice (small polarons, SP) remains still under debate in the case of manganites.
Theoretically, SP and LP have been investigated in several studies Röder et al. (1996); Lee and Min (1997); Millis et al. (1996) on doped manganites, but the observed polaron peak has been evaluated mainly in terms of the SP model or through Gaussian or Lorentzian fits for a phenomenological description Jung et al. (1998); Kim et al. (2002). Kim et al. reported on experimental evidence for a LP excitation in polycrystalline LCMO Kim et al. (1998), but unfortunately they did not identify the LP through a fit to the proposed LP model by Emin Emin (1993).
The purpose of this paper is to elucidate the nature of the polaronic charge carriers by comparison of optical spectroscopy measurements in thin films of LCMO and La2/3Sr1/3MnO3 (LSMO). In contrast to single crystals the use of thin films has the advantage of a lower conductivity due to grain boundaries and internal strain. Consequently, screening is effectively reduced — to a level where phonons and polarons are well observable in the optical conductivity, even in the metallic phase. This allows the detailed analysis of polarons from the respective optical data.
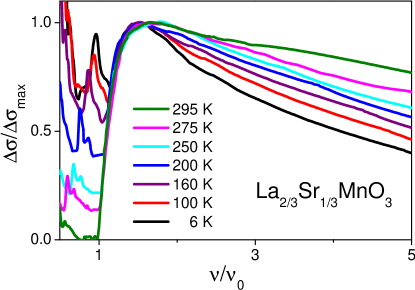
We demonstrate that the distinctive shape of the polaron peak in LCMO differs significantly from the one in LSMO allowing to distinguish between SP in LCMO and LP in LSMO. A striking characteristic of the polaron peak in LSMO is the observed scaling behavior for the low-energy side (see Fig. 2). We will confirm this scaling in a weak coupling evaluation, analogous to that of Tempere and Devreese for an interacting many-polaron gas Tempere and Devreese (2001).
As the lattice distortion is of major importance for the effect of charge carrier localization, the structural differences between LCMO, which is orthorhombically distorted, and LSMO, which reveals a rhombohedral symmetry, represent promising conditions to find distinct regimes of the electron-phonon coupling strength and, consequently, to distinguish between competing polaronic models.
Thin films have been prepared using a standard pulsed laser deposition technique Christey and Hubler (1994). They were grown onto single crystalline substrates: LSMO on (LaAlO3)0.3(Sr2AlTaO5)0.7 and LCMO on NdGaO3. The typical thin film thickness was between 200 nm and 400 nm. X-ray analysis revealed a rhombohedral structure for LSMO and a preferred growth along the [100] axis. For LCMO an orthorhombic structure was found and the growth direction was [110]. Below room temperature the reflectivities of the sample and the pure substrate were measured using the Fourier transform spectrometers Bruker IFS 113v and IFS 66v/S, to cover the frequency range from 50 to 40000 cm-1. In addition, the reflectance for frequencies from 10 to 30 cm-1 was calculated from the measured complex conductivity data, which were obtained by submillimeter-transmission measurements using a Mach-Zehnder type interferometer. This set up allows both, the measurement of the transmittance and the phase shift of a film on a substrate. The combined data sets were used for a Kramers-Kronig analysis to obtain the optical conductivity , the real part of the complex conductivity.
In Fig. 1 we present for LSMO (upper panel) and LCMO (lower panel) at different temperatures. In the case of LCMO, with a Curie-temperature K, the spectra in the complete frequency range were measured both in the paramagnetic (PM) and in the ferromagnetic (FM) regime. The data for LSMO, as shown in the upper panel of Fig. 1, only cover the FM regime. We defined as the inflection point and as the point of the maximum in the dc-resistivity curve.
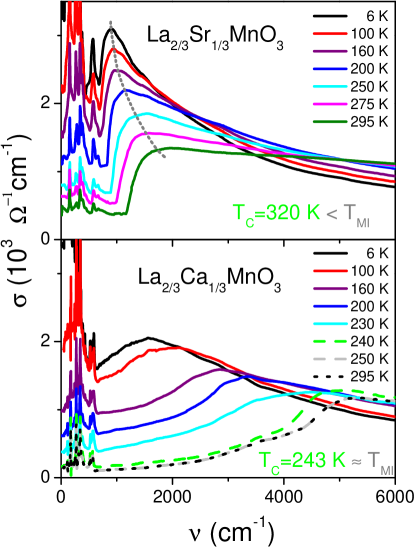
In LCMO an almost symmetric but strongly temperature dependent maximum is observed in the MIR range which suffers a continuous loss of the spectral weight upon increasing the temperature up to . Above the temperature dependence is negligible. The maximum moves from 1800 to 5300 cm-1. The loss in spectral weight can be explained in terms of a decreasing carrier mobility Jakob et al. (1998). These findings are in agreement with previous studies of Ca-doped manganites Kim et al. (1998); Quijada et al. (1998). For LSMO, in contrast, there is a sharp onset which, along with the asymmetric peak, shifts by approximately a factor of 2 in energy in the range . This trend continues up to the insulating phase, where the reflectivity data (not shown) do not change any further Hartinger (2002).
The prominent feature of the optical spectra, on which we will concentrate in the following, is the distinctly different shape of the polaron peak for LSMO and LCMO. In LSMO the excitation is clearly asymmetric with a steep rise below and a long tail above the peak position, whereas for LCMO a broader hump is visible which is more symmetric about its maximum (compare Fig. 1). A fit with standard single-polaron models highlights the remarkable qualitative differences and allows a preliminary identification (see the respective optical spectra at 6 K in Fig. 2). For the LP fit we took the phenomenological approach by Emin Emin (1993) which assumes a photoionization of the charge carriers from self-trapped into free carrier states. The threshold behavior of the respective optical conductivity
| (1) |
reproduces the observed upturn at the low-frequency side of the polaron peak. Here, , with the temperature-dependent threshold frequency for the absorption (see inset of Fig. 2). is interpreted as the energy difference between the localized ground state and the lowest continuum state. The radius of the hydrogenic ground state of the polaron is , the density of polarons is , and is the (effective) mass of the free carrier states at the band minimum. For ( is the free electron mass) and cm-1, we find with the lattice constant Å and cm-3 at 6 K. We challenge this phenomenological approach below and propose a microscopic modelling.
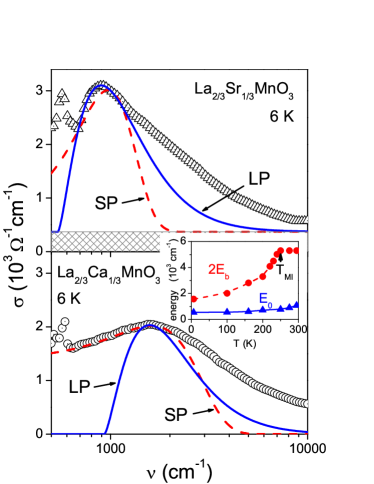
The SP is interpreted in terms of the Holstein small-polaron theory. It has been proposed to apply an extension of the standard SP optical conductivity formula Reik (1972); Emin (1975) to the low-temperature optical spectroscopy Puchkov et al. (1995); Yoon et al. (1998):
| (2) |
Here is the dc-conductivity, is the SP binding energy, , and is the characteristic vibrational energy being in the high-temperature regime and at low temperatures (, is a phonon frequency). Eq. (2) reproduces the broad resonance with a maximum at (inset of Fig. 2). The low-energy SP absorption is well represented by the optical conductivity, Eq. (2). However, one would have to consider the consequences of a high polaron concentration for the absorption in order to understand the slow decay on the high-frequency side.
As shown in the inset of Fig. 2, the binding energy increases towards the metal-insulator transition at , and remains constant above reflecting the significant role of magnetic interactions in a polaronic system as well as the importance of electron-phonon interactions in the formation of the insulating phase. For LSMO the increase of is weaker corresponding to a weaker electron-phonon interaction. As is above room temperature for LSMO, of the insulating phase was not accessible in our experimental set-up.
Concerning LCMO, the SP picture is well accepted and both the high-temperature dc-resistivity Worledge et al. (1996) and the rather symmetric line shape close to the maximum of the polaronic excitation suggest that the transport is controlled by incoherent tunnelling of SP. For LSMO, the interpretation of the polaron peak in terms of LP is not as obvious. However, an observation related only to LSMO proves to be most valuable in restricting the possible scenarios:
If we scale the frequency by the -dependent threshold value and the optical conductivity by its maximum value at the polaron peak, we find a universal low-energy slope independent of temperature (see Fig. 3). This scaling signifies that the low-energy scattering processes which contribute to the absorption for this frequency range relative to are of the same origin independent of temperature, related band narrowing, and other energy scales.
We challenge that Emin’s phenomenological approach is applicable here: (i) it would reproduce the scaling if the dimensionless polaron radius were the same for all temperature sets; however, varies from 0.6 to 0.8, a range of values too large to convincingly support the scaling; (ii) the polaron radius is small and local lattice effects have to be accounted for; (iii) there is no hole-band minimum available to which the excited charge carriers could scatter. Furthermore, the energy difference from the mobility edge below which the trapped polarons would reside to the hole band minimum would have to be the threshold frequency. This frequency is about cm-1 at 6 K and is too small for the addressed energy difference.
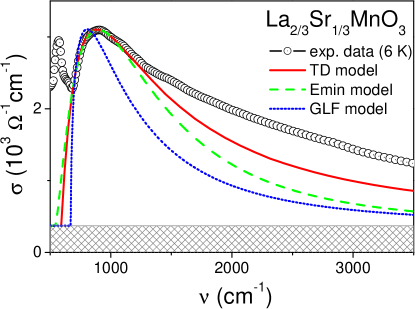
Consequently the modelling has to be revised as to implement LPs with finite mass and a finite density of charge carriers (Fermi edge). In weak coupling theory, the generalization of the single polaron absorption by Gurevich, Lang and Firsov (GLF) Gurevich et al. (1962) (dotted curve in Fig. 4, is the coupling strength)
| (3) |
to the situation of many-particle absorption was carried through by Tempere and Devreese for a Coulomb gas Tempere and Devreese (2001). The optical conductivity for a similar approach, which builds on the Hubbard model, is presented by the solid curve in Fig. 4. For the manganites in the ferromagnetic, metallic regime, we take the following standard simplifications for the low-temperature evaluation: (a) only one spin direction prevails (spinless fermions) due to double exchange and strong Hunds coupling, (b) there are two degenerate orbital states (the two -levels), (c) the interaction is represented by the local Hubbard for two fermions on the same site in two orbital states. We adjust the parameters as follows: the density of charge carriers is cm-3, which is the stoichiometric number of doped holes and which is in the range of what has been estimated from Hall measurements Mandal et al. (1998). Using , consistent with specific heat measurements Salamon and Jaime (2001), we then estimate cm-1. Since cm-1 for the 6 K data, we fix the ratio , i.e. we are in the adiabatic regime. Finally, we vary in the range … . For values of , the absorption shape is nearly independent on , except that the magnitude of scales down with increasing . For , we have which should fit the data with of the order of 1.
For the considered frequency range above the threshold, we are always sufficiently close to the Fermi edge in order to approximate the frequency dependence of the imaginary part of the dielectric response by (), the number of excited low-energy particle-hole pairs. The scaling of the low-frequency slope (as suggested in Fig. 3) is implemented through the increase of the number of particle-hole pairs with increasing frequency (relative to the Fermi edge). The decrease at the high-energy side is controlled by a -factor, most easily identified in the force-force correlation function form of the conductivity. Consequently, we expect the optical conductivity to approach
| (4) |
Indeed, this formula matches the frequency dependence of the numerically calculated (solid line in Fig. 4). The model reproduces the observed shape of the polaron peak quite convincingly and it accounts for the scaling. However, it does not provide a mechanism for the observed shift of the threshold with temperature — which is probably controlled by the electron-phonon coupling strength. This necessitates to extend the considerations to intermediate or strong coupling situations, first and foremost in the adiabatic limit. Such an evaluation is not available yet. It has to involve the collective response of the Fermi sea to the formation of a potential well during the absorption process which leads to singularities in the optical conductivity, well known from the the X-ray edge problem. Recoil of the polaronic lattice deformation, which is taken up in the excitation process of the charge carrier to the Fermi edge Gavoret et al. (1969); Ruckenstein and Schmitt-Rink (1987), flattens the singularity and might be responsible for the observed shape. Though the consequences for the shape of the absorption spectrum are speculative, the singular response is supposed to be present in any model with a sudden creation of a heavy or localized scatterer in the presence of a Fermi sea, and it will have to be investigated.
Apart from these considerations, the simple modelling presented above already characterizes the observed polaron excitations sufficiently well and we are in the position to identify the nature of the polaronic processes in LSMO and LCMO films as large and and small polarons, respectively.
Acknowledgements.
We acknowledge discussions with K.-H. Höck, T. S. Nunner, R. Hackl, A. Nucara and P. Calvani. We thank J. Goldfuss and W. Westerburg for placing the samples at our disposal. The research was supported by BMBF (13N6917, 13N6918A) and partly by DFG via SFB 484 (Augsburg).References
- von Helmolt et al. (1993) R. von Helmolt et al., Phys. Rev. Lett. 71, 2331 (1993).
- Calvani (2001) P. Calvani, Optical properties of polarons (La Rivista del Nuovo Cimento, Bologna, 2001).
- Worledge et al. (1996) D. C. Worledge et al., J. Appl. Phys. 80, 5158 (1996).
- Okimoto et al. (1997) Y. Okimoto et al., Phys. Rev. B 55, 4206 (1997).
- Jung et al. (1998) J. H. Jung et al., Phys. Rev. B 57, R11 043 (1998).
- Kim et al. (1998) K. H. Kim, J. H. Jung, and T. W. Noh, Phys. Rev. Lett. 81, 1517 (1998).
- Saitoh et al. (1999) E. Saitoh et al., Phys. Rev. B 60, 10 362 (1999).
- Lee et al. (1999) H. J. Lee et al., Phys. Rev. B 60, 5251 (1999).
- Kaplan et al. (1996) S. G. Kaplan et al., Phys. Rev. Lett. 77, 2081 (1996).
- Quijada et al. (1998) M. Quijada et al., Phys. Rev. B 58, 16 093 (1998).
- Machida et al. (1998) A. Machida, Y. Moritomo, and A. Nakamura, Phys. Rev. B 58, R4281 (1998).
- Reik and Heese (1967) H. G. Reik and D. Heese, J. Phys. Chem. Solids 28, 581 (1967).
- Goovaerts et al. (1973) M. J. Goovaerts, J. M. De Sitter, and J. T. Devreese, Phys. Rev. B 7, 2639 (1973).
- Emin (1975) D. Emin, Adv. Phys. 24, 305 (1975).
- Röder et al. (1996) H. Röder, J. Zang, and A. R. Bishop, Phys. Rev. Lett. 76, 1356 (1996).
- Lee and Min (1997) J. D. Lee and B. I. Min, Phys. Rev. B 55, 12 454 (1997).
- Millis et al. (1996) A. J. Millis, R. Mueller, and B. I. Shraiman, Phys. Rev. B 54, 5405 (1996).
- Kim et al. (2002) M. W. Kim et al., Phys. Rev. Lett. 89, 16403 (2002).
- Emin (1993) D. Emin, Phys. Rev. B 48, 13 691 (1993).
- Tempere and Devreese (2001) J. Tempere and J. T. Devreese, Phys. Rev. B 64, 104504 (2001).
- Christey and Hubler (1994) D. Christey and G. Hubler, Pulsed Laser Deposition of Thin Films (Wiley, New York, 1994).
- Jakob et al. (1998) G. Jakob et al., Phys. Rev. B 57, 10252 (1998).
- Hartinger (2002) Ch. Hartinger, Ph.D. thesis, Universität Augsburg (2002).
- Reik (1972) H. G. Reik, in Polarons in Ionic Crystals and Polar Semiconductors, ed. by J. Devreese (North Holland, Amsterdam, 1972).
- Puchkov et al. (1995) A. V. Puchkov et al., Phys. Rev. B 52, R9855 (1995).
- Yoon et al. (1998) S. Yoon et al., Phys. Rev. B 58, 2795 (1998).
- Gurevich et al. (1962) V. Gurevich, I. Lang, and Y. Firsov, Sov. Phys. Solid State 4, 918 (1962).
- Mandal et al. (1998) P. Mandal et al., Phys. Rev. B 57, 10256 (1998).
- Salamon and Jaime (2001) M. B. Salamon and M. Jaime, Rev. Mod. Phys. 73, 583 (2001).
- Gavoret et al. (1969) J. Gavoret et al., J. Phys. (Paris) 30, 987 (1969).
- Ruckenstein and Schmitt-Rink (1987) A. E. Ruckenstein and S. Schmitt-Rink, Phys. Rev. B 35, 7551 (1987).