Competition in Social Networks: Emergence of a Scale-free
Leadership Structure and Collective Efficiency
Abstract
Using the minority game as a model for competition dynamics, we investigate the effects of inter-agent communications on the global evolution of the dynamics of a society characterized by competition for limited resources. The agents communicate across a social network with small-world character that forms the static substrate of a second network, the influence network, which is dynamically coupled to the evolution of the game. The influence network is a directed network, defined by the inter-agent communication links on the substrate along which communicated information is acted upon. We show that the influence network spontaneously develops hubs with a broad distribution of in-degrees, defining a robust leadership structure that is scale-free. Furthermore, in realistic parameter ranges, facilitated by information exchange on the network, agents can generate a high degree of cooperation making the collective almost maximally efficient.
pacs:
87.23.Ge,0.2.50.Le,89.65.Gh,89.75.FbIn a competitive environment with seriously limited resources, an individual will be able to make the most gains, if he avoids the crowds, and finds strategies that places him into the distinguished class of the elites, or of the “few”. Even though this class forms a minority group when compared to the whole agent society, it can largely influence the dynamics of the entire society for the simple reason that the elites hold the best strategies in the given situation, and thus they become key target nodes for others to communicate with, and follow. For our purposes, an agent is a leader if at least one agent is following, and thus acting on his advice. The influence of a leader is measured by the number of followers he has. Agents who are not leaders are simply coined “followers”. However, leaders can follow other leaders, thereby creating a leadership structure. Certainly, the leadership structure, and even which particular agents are leaders at all, is often very dynamic (mostly because the success of a certain strategy is determined by the context of the strategies used by the other agents).
One of the most ubiquitous mechanisms guiding people in deciding whom, or what to follow is reinforcement learningKLM96 , which is a mechanism for statistical inference created through repeated interactions with the environment. For example, in iterated situations/games, it can be argued that we all monitor our social circle, and “score” our acquaintances, including ourselves, based on past performance (success measure). We then take more seriously, and often follow those with a higher score (success rate)SP00 .
In order to study the scenario described above, in this Letter we use a well known multi-agent model of competition, the Minority GameCZ97 ; SMR99 ; JHH99 (MG), which we modify to include inter-agent communications/influences across a social network. The two main questions we address here are: 1) What type of leadership structure is generated? and 2) Can the effects of inter-agent communications aggregate up to the level of the collective and affect its behavior?
The original MG is an abstraction of a market played by agents with bounded rationality, inspired by the El Farol bar problem introduced by Brian W. ArthurA94 . In this iterated game, at every step, agents must choose between two different options, symbolized by A and B, e.g. “buy” and “sell”. Only agents in the minority group get a reward. The agents have access to global information, which is the identity of the minority group for the past rounds. Each agent bases his choice on a set of strategies available to them. A strategy, which is an agent’s ‘way of thinking’, is a prediction A94 for outcome A or B, in response to all possible histories of length . The strategies are distributed randomly among agents, and thus in general each agent has different set of strategies. They make their next choice in the game using reinforcement learning: every agent keeps a score for each of the strategies which he then increments by one each round if that strategy correctly predicted the minority outcome (regardless of usage). The strategy used to make the new choice is the one with the best score up to that time. If two, or more strategies share the best score, then one of those strategies is picked randomly. Previously, the effects of local information in the MG were studied both with reinforcement learning type PBC00 and non-reinforcement learning type EZ00 ; KSB00 ; S00 of agent communication mechanisms on Kauffman networks K93 , and with non-reinforcement learning type of mechanisms on linear chains KSB00 ; S00 .
In our model, a social network of agents is described by a graph with vertices representing the agents, and edges representing acquaintanceship between pairs of agents. This network of acquaintances forms the substrate network (G), or skeleton for inter-agent communications SP00 ; PBC00 ; EZ00 ; KSB00 ; S00 ; NM92 . An edge in means that agents and may exchange game-relevant information. However, it does not indicate whether the exchanges influence the action by any of the involved agents. That information is modeled by a second network, the influence network , which is a directed subset of , and in which an edge , pointing from to , means that agent acts on the advice of agent when deciding the minority choice. In the competitive environment of the stock market, Kullman, Kertész and Kaski, by studying time-dependent cross-correlations have recently shown the existence of such a directed network of influence among companies() based on data taken from the New York Stock Exchange KKK02 . We do not, in general, know the precise topology of the social networks. However, it is known that social networks have a small-world character WS98 ; W99 ; JGN01 . Here we take to be an Erdős - Rényi (ER) random graph with link probability . An ER random graph shows the small world effect, since the diameter of the graph increases only logarithmically with the number of vertices N00 and the nodes also have a well defined average degree, , which results from cognitive limitation JGN01 . Studies using other types of network topologies, which are more suited to describe social networks (one drawback of ER is its low clustering coefficient WS98 ) will be presented in future publications. Just as in the original MG, in our model, in order to make his next decision, each agent uses his best performing strategy to predict what the next minority choice will be. However, he does not necessarily act on that prediction. Instead, the prediction simply constitutes the agent’s opinion, which he then shares with all his first neighbors on the substrate network . This is done by all agents simultaneously, and thus every agent obtains as information the predictions of all their first neighbors. Each agent then uses this information to make their final choice, via reinforcement learning: they keep scores of the prediction performance of all their first neighbors and themselves, and update the scores after every round by incrementing the scores of the agents whose prediction was correct. Each agent then acts on the prediction/opinion of the neighboring agent with the highest score. Of course, if they have a higher score than any of their neighbors, then they act on their own prediction.
The game is initialized by fixing at random strategies for each agent, an arbitrary initial history string, and a fixed instance of the substrate network . After many iterations, the game evolution becomes insensitive to the particular initial history string. However, it may remain sensitive to the quenched disorders in the strategy space of the strategies that are used, and in the quenched disorder associated with the particular social network chosen. Thus, there are four relevant parameters in this game: , , , and . Of course, in reality the substrate network can also change (we make new friends and others fade away). However, we assume its dynamics to be much slower than that of , and therefore it is neglected here. As defined previously, an agent is a leader if it has at least one follower, , and thus agent follows through action what agent suggests. For this to happen, has to have the largest prediction score among the acquaintances of , which are defined as the edges has in . In an ER graph, the number of links has a Poisson distribution with an average value at , and an exponential tail. An agent will follow only one agent’s opinion to decide his action, and thus its number of out-links is always one, . However, the number of in-links for agent , , can be any number between and , according to the number of agents acting on his advice. Fig.1 shows the in-degree distribution for various numbers of agents , network connectivity , and memory length . The first striking observation from Fig.1a) is that over a wide range of parameters the in-link distribution is described by a power-law with a sharp cut-off. Thus, the average number of leaders with followers, , is a scale-free distribution AB02 . This happens in spite of the fact that the substrate network, which is an ER graph is not a scale free network, and therefore it was not introduced a priori into the underlying structure. The scale-free character of the influence network is selected for by the reinforcement learning nature of the agent-agent interaction rules. The fact that a broad scale-free structure is selected on the back of a Poisson distributed network, seriously limits the size of the leadership. Indeed, Fig.1d), which shows the non-leaders, or followers, expresses this fact: the pure followers constitute over 90% of the population for the cases presented in Fig.1a).
Plotting , all the curves can be collapsed in the scaling regime up to their cut-offs, indicating that . The power of the decay, is very close to unity, which means that is independent of and the other parameters in the scaling regime. Since is the influence of a leader with followers, represents the total influence of the -th layer in the leadership hierarchy. The above observation therefore means that all layers of the hierarchy are equally influential; influence is evenly distributed among all levels of the leadership hierarchy. This result is robust, and insensitive to the particular parameters, even in the low (memory) regime. Here, however, oscillations build up around the behavior which still serves as a backbone for the leadership structure, but it becomes less obvious as is decreased, see Fig.1b).
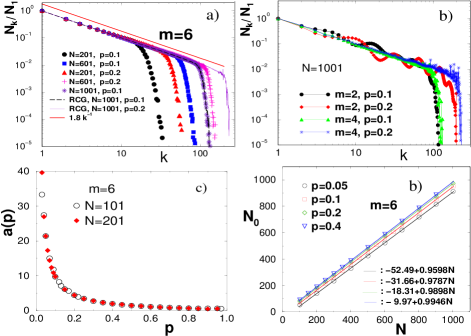
Another important observation is that depends strongly only on and not on or , thus , as shown in Fig. 1c). Therefore, we have
| (1) |
The fact that is virtually independent of , means that if the number of agents is increased, the leadership structure and size in the scaling regime will not change! What changes though, is the number of the “sheep” or followers, which is . It will grow in proportion to , as seen in Fig.1d). Also, the cut-off at the high- end of the distribution will occur at larger as is increased. The deviation of the function from a constant accounts for the fluctuations in the leadership structure which vanish (the fluctuations) with increasing . This is due to the fact that the strategy space suffers a combinatorial explosion as is increased (there are in total strategies), and the agents’ strategies therefore become highly uncorrelated CZ97 ; SMR99 ; JHH99 .
This suggests that the results for large can be reproduced if the agents simply play a Random Choice Game ( RCG) on the network. In a RCG, agents do not use strategies, but instead just toss a coin when making predictions. Indeed, Fig. 1a) shows that the RCG on the ER network produces the same scale - free backbone of the leadership structure. Thus, in our model the closeness to the scale-free backbone is determined by the level of mutual de-correlation of agents’ strategies. This is to say that increased trait diversity (strategy space) leads to stable scale-free leadership structure.
Although the leadership structure is stable for large , the position of an individual agent in the leadership hierarchy is not. By computing the time correlations present in the number of in-links we can show that the average lifetime of an agent in a particular leadership position is short for large , as detailed in Ref. proc . In contrast, at low values, leaders become frozen in their positions. In other words, in the low regime, where trait diversity is small, as in a dictatorship, where agents’ action space is severely limited, leaders “live” longer in their positions.
Next, we briefly study the global performance of the collective on the network. Consider choice A as the reference option, and denote by the attendance, or the number of agents choosing option A at time . One of the most frequently used measures for a “world utility” function for the collective WT02 is the variance of the fluctuations in the time series of . In the language of economics, it is the volatility of the market, and from a systems design point of view WT02 it is the quantity that we ultimately want to minimize.
As mentioned before, this game has two types of quenched disorder embedded into it. A natural question then is if one can find/evolve networks that achieve zero, or almost zero volatility given a group and their strategies, or, alternatively, if one can find strategies that achieve zero, or near zero volatility, given a particular substrate network. To answer this question, we performed simple random searches in one of the quenched disorder spaces (network or strategy) keeping the other quench disorder fixed (strategy or network). An example with and is displayed in Fig.2a) as a function of connectivity . The first conclusion is that overall, the collective does worse with “smart agents” (large ) on highly connected networks if they exchange information about their strategies. However, in the low regime (), the system efficiency can improve not only beyond that of the standard MG, but also beyond that of the RCG without network (blue line with ), and even beyond the standard MG’s best performance (which is at a different value of for these parameters). Thus, a networked, low trait diversity system can be more effective as a collective, than a sophisticated group. Note that the optimal values are still much larger than the critical value for the giant component in the ER network, which is , and thus we need well connected single component graphs in order to observe the collective efficiency emerge from the agent-agent interactions. However, the optimal values are actually in the realistic range for social networks, giving for the average number of contacts . If is varied the optimum range for shifts such that optimum value of remains constant.
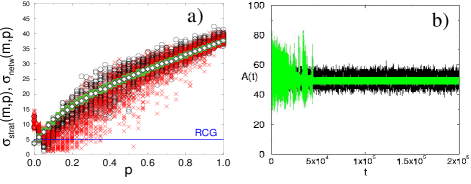
Fig.2b) shows a sample time-series from the optimal connectivity region. Notice the low volatility compared to the best performance of the MG (in the background). In the standard MG the variations in at the best performance point are low, and even an extended search (500 samples) in the strategy disorder space could not generate -s lower than 2.0, while in contrast, time series such as the red one in Fig.2b) are easily generated within 50 random samples in the optimal connectivity region. This emerging collective efficiency can be understood in terms of the crowd-anticrowd description of the MG, as introduced by Johnson, Hart and Hui JHH99 . In the MG, low means that only a small number of different strategies are possible, thus many agents are forced to use the same strategy and thus they behave as a crowd, or a group. This grouping effect generates the large volatility in the ordinary MG. When the game is played on a network, however, an agent, even if it shares the same strategy as the others in a large group, now has the possibility to listen to some other agents, and possibly even from other groups. Thus, it is no longer forced to behave the same way as its own group, thereby breaking the grouping behavior. If, however, is too large, there is a grouping behavior appearing due to the network, because an agent will have too many followers if his score is the highest, creating a group on the network. The two crowding effects compete and a balance between them is reached in the optimum connectivity region.
In summary, we have shown that the evolution of multi-agent games can strongly depend on the nature of the agent’s information resources, including local information gathered on the social network, a network whose structure in turn is influenced by the fate of the game itself. In our study, we allowed for this dynamic coupling between the game and the network by using reinforcement learning as an ubiquitous mechanism for inter-agent communications. Our observations are: 1) if reinforcement learning is used, a scale-free leadership structure can be created, even on the backbone of non-scale free networks; 2) in low trait diversity collectives, enhanced collective efficiency may appear, making this effect worthwhile for systems design studies WT02 .
Z.T. and M.A. are supported by the Department of Energy under contract W-7405-ENG-36, K.E.B. is supported by the NSF-DMR through 0074613, and the Alfred P. Sloan Foundation. G.K. is supported by the NSF-DMR through DMR-0113049 and the Research Corporation through RI0761.
References
- (1) L.P. Kaelbing, M.L. Littman, and A.W. Moore, J. Artif. Intell. Res. 4, 237 (1996).
- (2) B. Skyrms, R. Pemantle, Proc. Natl. Acad. Sci. USA 97, 9340 (2000)
- (3) D. Challet and Y.-C. Zhang, Physica A 246, 407 (1997)
- (4) R. Savit, R. Manuca, and R. Riolo, Phys. Rev. Lett. 82, 2203 (1999)
- (5) N.F. Johnson, M. Hart, and P.M. Hui Physica A 269, 1 (1999)
- (6) B.W. Arthur Am. Econ. Assoc. Papers and Proc. 84, 406 (1994)
- (7) M. Paczuski, K.E. Bassler, and A. Corral, Phys. Rev. Lett. 84, 3185 (2000)
- (8) V.M. Eguiluz, and M.G. Zimmermann, Phys. Rev. Lett. 85, 5659 (2000)
- (9) T. Kalinowski, H.-J. Schulz, and M. Birese, Physica A, 277, 502 (2000)
- (10) F. Slanina, Physica A, 299, 334 (2000)
- (11) S.A. Kauffman, The Origins of Order (Oxford University Press, New York) (1993)
- (12) M.A. Nowak, and R.M. May Nature 359, 826 (1992)
- (13) L. Kullmann, J. Kertész, K. Kaski, http://arxiv.org/abs/ cond-mat/0203256
- (14) D.J. Watts, and S.H. Strogatz Nature 393, 440 (1998)
- (15) D.J. Watts, Small Worlds (Princeton, NJ: Princeton University Press) (1999)
- (16) M.E.J. Newman, J. Stat. Phys. 101, 819 (2000)
- (17) E.M. Jin, M. Girvan, and M.E.J. Newman, Phys. Rev. E 64, 046132 (2001)
- (18) R. Albert, and A.-L. Barabási Rev. Mod. Phys. 74, 47 (2002)
- (19) Z. Toroczkai, M. Anghel, G. Korniss and K.E. Bassler, to be published
- (20) D.H. Wolpert, and K. Tumer, Technical Report NASA-ARC-IC-99-63