Theoretical estimates of the logarithmic phonon spectral moment for monatomic liquids
Abstract
We calculate the logarithmic moment of the phonon frequency spectrum at a single density for 29 monatomic liquids using two methods, both suggested by Wallace’s theory of liquid dynamics: The first method relies on liquid entropy data, the second on neutron scattering data in the crystal phase. This theory predicts that for a class of elements called “normal melters,” including all 29 of these materials, the two estimates should closely match, and we find that they agree to within a few percent. We also perform the same calculations for four “anomalous melters,” for which we expect the two estimates to differ markedly; we find that they disagree by factors almost up to three. From our results we conclude that the liquid entropy estimates of the logarithmic moment, applicable both to normal and anomalous melters, are trustworthy to a few percent, which makes them reliable for use in estimates of various liquid transport coefficients.
LA-UR-03-5331
1 Introduction
Moments of the phonon frequency distribution of systems in the liquid phase appear to set the timescales on which certain correlation functions decay, thus affecting the values of the transport coefficients to which they correspond by Green-Kubo relations [1, 2]; so determining these coefficients requires the reliable estimation of the relevant moments. The comprehensive theory of monatomic liquids proposed by Wallace (see [3] for a review) allows one to estimate one of these moments, the logarithmic moment , from experimental measurements of the liquid entropy, but for these applications one would like greater confidence that this estimate is a reliable one. In the first paper on this theory [4], it was shown that the resulting expression for entropy together with the estimate , where is the corresponding moment in the crystal phase (this estimate is explained below) reproduced the temperature dependence of the entropy for six elements to an accuracy of roughly from melt to three times the melting temperature, supporting both the general form for the entropy and the approximation for . However, for most materials entropy data well above melting are unavailable, and one must ask a different question: If one computes from only a single entropy data point near melting, how reliable is the result? We will argue that this estimate is very good by considering data for 29 “normal melters” (elements like the six in [4], for which the theory claims is a good approximation), showing that computed from entropy data at the density of the liquid at melt at 1 bar closely matches computed at the same density from neutron scattering data and other sources. The internal consistency of these two ways of estimating for normal melters, both provided by the same theory but utilizing independent sources of data, increases our confidence that the entropy estimates of will be trustworthy even for elements that are not normal melters, and thus aren’t expected to satisfy the approximation.
In Section 2 we use this theory to deduce the two ways of estimating , one of which applies generally and one of which applies only to normal melters, and in Section 3 we use experimental data to compute the two estimates, finding that they match to . Finally, in Section 4 we consider the significance of these results.
2 Two estimates of for normal melters
The theory of liquid dynamics that we use here was developed in response to two trends in the experimental data for monatomic liquids at melt [3]: (1) The nuclear contribution to the specific heat tends to lie near per atom in both crystal and liquid phases; and (2) the entropy of melting data at constant density naturally divide the liquids into two classes: the “normal melters,” for which the entropy clusters around per atom, and the “anomalous melters,” for which the entropy of melting is much higher and which undergo significant electronic structure change (e.g., semimetal crystal to metal liquid) upon melting. The specific heat results suggest that the liquid undergoes collective harmonic motion much as the crystal does, and the entropy of melting data are naturally interpreted to show that the liquid, as opposed to the crystal, moves among potential valleys, where is the number of atoms and , thus contributing an extra configurational entropy on melting, with the excess for the anomalous melters being due to the electronic structure change. These observations led to two hypotheses:
-
1.
The potential landscape in which the atoms move in the liquid phase is dominated by approximately intersecting nearly-harmonic valleys, and the atomic motion is a combination of oscillations in one of these valleys and nearly instantaneous transitions from one valley to another called transits. Transits are responsible for diffusion.
-
2.
The valleys fall into three categories: the few crystalline valleys in which the system exists as a single crystal, the more numerous symmetric valleys corresponding to configurations that retain some of the crystal symmetry, and the overwhelmingly numerically dominant random valleys, which retain no remnant symmetry and which all have the same depth and shape (and thus the same phonon frequency spectrum) in the large limit.
These hypotheses have been extensively tested (as summarized in [3]) and can be used to calculate thermodynamic quantities such as entropy per atom; in the classical limit, where most liquids reside, the result is (Section 4 of [3])
| (1) |
where , , , and are the contributions to the entropy from anharmonicity, the presence of boundaries of the potential valleys, the thermal excitation of the electrons, and magnetic effects. (The anharmonic and boundary contributions are included in a single term, and the magnetic contribution is not included at all, in Section 4 of [3], but is discussed on pp. 202-203 of [5].) Thus, if one can compute , , , and at a given density (or argue that they are negligibly small), one can calculate from liquid entropy data at that density at a single temperature (or a range of temperatures, if data are available).
While the theory argues that this means of calculating is valid for all monatomic liquids, it also makes another prediction for the value of which applies only to the normal melters, namely that is nearly equal to at the same density. The prediction comes about as follows (see Subsection 4.4 of [3]): The entropy per atom of the crystal phase in the classical limit is calculated from lattice dynamics to be
| (2) |
where , , and represent the contributions from anharmonicity, the electrons, and magnetic effects, respectively, so the entropy of melting at constant density is given by
| (3) | |||||
is omitted here because boundary effects are non-negligible only at temperatures well above melting. For a normal melter, the lack of significant change in electronic structure suggests that , and assuming that anharmonic and magnetic effects are small (or at least comparable in the two phases), we predict . Experiment shows that for the normal melters with a small scatter, which strongly suggests that (since is the only available parameter that is not strongly material-dependent) and that , with anharmonicity and small differences between the two values of accounting for the scatter. Thus one should be able to estimate for normal melters reasonably closely by determining from appropriate data.
If this interpretation of the entropy of melting data is correct, these two estimates of for normal melters should approximately match, which will in turn increase our confidence in estimates of from liquid entropy data for any liquid, normal or anomalous. Determining whether they do in fact match is the subject of the next Section.
3 Comparison of experimental estimates
Let be the density of the liquid at melt at 1 bar (with the exception of Ar; see the Appendix). We will compare and for 29 normal melters for which accurate data are available.
To compute , we consult neutron scattering or other data which give us , where is some density not too far from , and , the high-temperature Grüneisen parameter. From these two quantities one can calculate from the relation
| (4) |
which is highly accurate as long as is not too large.
To compute from liquid entropy data, we first define the harmonic contribution to the entropy by
| (5) |
where is the quadratic moment of the liquid phonon distribution. This is the same as the first two terms in Eq. (1) for the classical limit of the liquid entropy, carried to the next higher order term in . Then if is the experimental value of the liquid entropy at the melting temperature at 1 bar,
| (6) |
(again, is negligible at melt), so to determine (and thus ) we need and the remaining three terms on the right hand side of Eq. (6). The standard approximation is perfectly reasonable here, since the term contributes less than to the entropy at the values of we consider, and we argue that the anharmonic and magnetic terms in the liquid at melt will be roughly equal to their counterparts in the crystal just before melt. (Recall that these two terms can be calculated for the crystal, because we have independent data for and thus we can determine the harmonic contribution to the crystal entropy directly; once the electronic term is also found from theory, the anharmonic and magnetic parts are simply what’s left.) The electronic term can be calculated different ways for different materials; see the Appendix for a discussion of how was calculated for the materials here.
These calculations were performed for 29 normal melters, using the data collected in the Appendix, and the results are shown in Table 1.
| Element | (K) | (K) | |
|---|---|---|---|
| Cs | 26.4 | 27.2 | 1.03 |
| Cd | 86.6 | 84 | 0.97 |
| Tl | (54.5) | 55.2 | (1.01) |
| Li | 252 | 251 | 1.00 |
| Na | 102.2 | 100 | 0.98 |
| K | 61.9 | 59.7 | 0.96 |
| Rb | 37.7 | 37.3 | 0.99 |
| Mg | 200.4 | 181 | 0.91 |
| Sr | (76.3) | 70.7 | (0.93) |
| Cu | 176.9 | 172 | 0.97 |
| Ag | 113.6 | 118 | 1.04 |
| Au | 91.5 | 97.4 | 1.06 |
| Zn | 129.3 | 124 | 0.96 |
| Hg | 56.4 | 52.8 | 0.94 |
| Al | 209.0 | 197 | 0.94 |
| In | 74.4 | 75.0 | 1.01 |
| Pb | 51.4 | 54.1 | 1.05 |
| Ar | 59.1 | 67.8 | 1.15 |
| V | 212 | 191 | 0.90 |
| Nb | 169 | 161 | 0.95 |
| Ta | 134 | 121 | 0.90 |
| Pt | 119 | 123 | 1.03 |
| Pd | 145 | (146) | (1.01) |
| Ni | 218 | 209 | 0.96 |
| Cr | (276) | (283) | (1.03) |
| Mo | 235 | (201) | (0.86) |
| W | 188 | (165) | (0.88) |
| Ti | (197) | 204 | (1.04) |
| Zr | (141) | 127 | (0.90) |
In Figure 1, is plotted against for all 29 elements, along with the line for comparison. First, we note that all 29 points cluster around the line to good approximation; second, we note that most of the scatter is due to the systematic deviation of the seven materials indicated by solid circles, all but one of which (Mg) are transition metals. This could be due either to the larger uncertainty in the experimental entropy results for the transition metals or to the fact that some of these materials are weakly anomalous melters (the entropy of melting data for Mo and W particularly suggest this [5]).
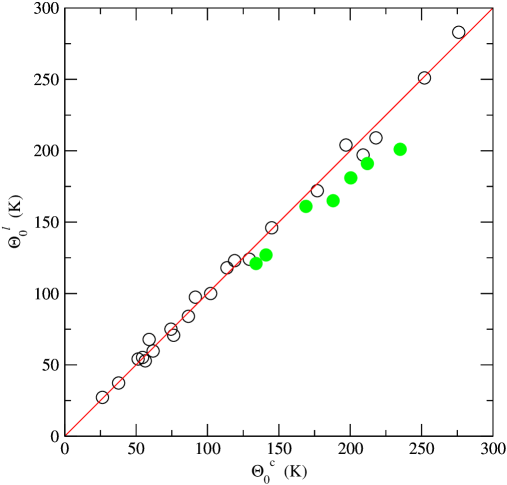
Our data for all 29 materials show
| (7) |
at , or equivalently that the rms deviation of from is at . As we explain in the Appendix, given the quality of our data we expect roughly 3% (at most 4%) errors in this ratio; so as the theory predicts, the two are equal to a high degree of approximation, and about half of the difference is accounted for by experimental error.
In contrast, if we consider analogous calculations for four anomalous melters, we find the results shown in Table 2.
| Element | (K) | (K) | |
|---|---|---|---|
| Ga | 169 | 100 | 0.59 |
| Si | 436 | 162 | 0.37 |
| Ge | 255 | 91 | 0.36 |
| Sn | 94.3 | 74 | 0.78 |
The change in electronic structure at melt results in great changes in the interatomic forces, resulting in large changes in the phonon frequencies. For these materials, the approximation would be grossly inaccurate; but as these elements are nearly-free-electron metals in the liquid phase, we expect the calculation of from entropy data to be quite reliable.
4 Conclusions
The theory used here gives us two ways to calculate , one using liquid entropy data and valid for all monatomic liquids, and the other using crystal neutron scattering data and applicable only to “normal melters,” for which the crystal and liquid values of as a function of density are expected to agree approximately. This expectation is amply fulfilled by data from 29 normal melters, which show and agreeing within a few percent. (Our expectation that and of anomalous melters should strongly disagree is also verified.) This work nicely complements calculations by Wallace and Clements [6] for pseudopotential sodium, in which they found at g/cm3
| (8) |
which agrees very well with the experimental results for Na from Table
1. These results, supporting the internal consistency
of this theory, suggest that estimates of from liquid
entropy data for anomalous melters, such as those in Table
2, will be equally trustworthy; coupled with the
theoretical result given in Eq. (8), they also show that
theoretical methods have advanced to the point that a priori
calculations of , which will be important for the
computation of transport coefficients in the liquid, are also
reliable.
Appendix: Data and Sources
All of the data used to calculate and
for the 33 elements we consider are
recorded in Table 3. The entry in the “Structure”
column indicates the structure of the crystal at melt;
is the density at which was measured; is
the high- Grüneisen parameter; is the density of
the liquid at melt at 1 bar (except for Ar; see below); is the
corresponding melting temperature; is the experimentally
measured entropy of the liquid at melt; , , and
are the additional contributions to the total entropy from
Eq. (1) ( is negligible at ); and
is the harmonic contribution to the entropy determined from the other
entropy data using Eq. (6). All densities are in g/cm3,
all temperatures are in K, and all entropies are in /atom. Data in
parentheses are generally less reliable.
| Element | Structure | ||||||||||
|---|---|---|---|---|---|---|---|---|---|---|---|
| Cs | bcc | 1.91 | 27.5 | 1.14 | 1.84 | 301.6 | 11.11 | 0.09 | 0 | 0 | 11.02 |
| Cd | hcp | 8.65 | 103 | 2.3 | 8.02 | 594.2 | 9.76 | 0.07 | 0 | 0 | 9.69 |
| Tl | bcc | 11.6 | 58.3 | [2] | 11.22 | 577 | 10.93 | 0.09 | 0 | 0 | 10.84 |
| Ga | ortho | 5.91 | 162 | 1.5 | 6.09 | 302.9 | 7.18 | 0.04 | 0 | 0 | 7.14 |
| Si | dia | 2.34 | 421 | (0.5) | 2.51 | 1687 | 11.05 | 0.22 | 0 | 0 | 10.83 |
| Ge | dia | 5.32 | 245 | 0.8 | 5.60 | 1211 | 11.72 | 0.17 | 0 | 0 | 11.55 |
| Sn | bct | 7.30 | 103.4 | 2.2 | 7.00 | 505.1 | 9.66 | 0.09 | 0 | 0 | 9.57 |
| Li | bcc | 0.546 | 265.5 | 0.88 | 0.515 | 453.7 | 5.66 | 0.04 | 0 | 0 | 5.62 |
| Na | bcc | 1.005 | 113.3 | 1.24 | 0.925 | 371.0 | 7.78 | 0.05 | 0 | 0 | 7.73 |
| K | bcc | 0.904 | 68.9 | 1.24 | 0.829 | 336.4 | 9.06 | 0.07 | 0 | 0 | 8.99 |
| Rb | bcc | 1.616 | 42.2 | 1.26 | 1.479 | 312.6 | 10.26 | 0.08 | 0 | 0 | 10.18 |
| Mg | hcp | 1.74 | 229.4 | 1.5 | 1.59 | 922 | 8.81 | 0.12 | 0 | 0 | 8.69 |
| Sr | bcc | 2.6 | 80.0 | [1] | 2.48 | 1042 | 12.10 | 0.23 | 0 | 0 | 11.87 |
| Cu | fcc | 9.018 | 225.3 | 2.02 | 8.00 | 1358 | 10.09 | 0.09 | 0 | 0 | 10.00 |
| Ag | fcc | 10.49 | 150.1 | 2.42 | 9.35 | 1235 | 10.94 | 0.10 | 0 | 0 | 10.84 |
| Au | fcc | 19.27 | 124.5 | 2.95 | 17.36 | 1338 | 11.77 | 0.11 | 0 | 0 | 11.66 |
| Zn | hcp | 7.270 | 161 | 2.2 | 6.58 | 692.7 | 9.04 | 0.07 | 0 | 0 | 8.97 |
| Hg | rhomb | 14.46 | 64.7 | 2.5 | 13.69 | 234.3 | 8.31 | 0.03 | 0 | 0 | 8.28 |
| Al | fcc | 2.731 | 283.5 | 2.25 | 2.385 | 933.5 | 8.58 | 0.11 | 0 | 0 | 8.47 |
| In | bct | 7.43 | 85.3 | 2.4 | 7.02 | 429.8 | 9.11 | 0.07 | 0 | 0 | 9.04 |
| Pb | fcc | 11.55 | 64.1 | 2.65 | 10.63 | 600.6 | 11.13 | 0.11 | 0 | 0 | 11.02 |
| Ar | fcc | 1.7705 | 59.1 | 2.6 | 1.7705 | 219 | 7.33 | 0 | 0 | 0 | 7.33 |
| V | bcc | 6.12 | 250 | 1.5 | 5.49 | 2202 | (12.12) | 0.98 | 0 | 0 | (11.14) |
| Nb | bcc | 8.58 | 198 | 1.6 | 7.76 | 2744 | 13.24 | 0.94 | 0 | 0 | 12.30 |
| Ta | bcc | 16.68 | 162 | 1.6 | 14.8 | 3293 | 14.75 | 1.03 | 0 | 0 | 13.72 |
| Pt | fcc | 21.56 | 163.5 | 2.6 | 19.1 | 2045 | 13.09 | 0.85 | 0 | 0 | 12.24 |
| Pd | fcc | 12.07 | 200 | 2.3 | 10.5 | 1827 | (12.20) | 0.82 | 0 | 0 | (11.38) |
| Ni | fcc | 8.91 | 275 | 1.9 | 7.89 | 1728 | 11.54 | 1.09 | 0 | 0.31 | 10.14 |
| Cr | bcc | 7.19 | 338 | (1.5) | (6.28) | 2133 | 11.69 | (0.84) | (0.65) | 0.34 | (9.86) |
| Mo | bcc | 10.22 | 273 | 1.6 | 9.3 | 2896 | (13.26) | 0.67 | (0.79) | 0 | (11.80) |
| W | bcc | 19.26 | 225 | 1.6 | 17.2 | 3695 | (14.52) | (0.75) | (0.65) | 0 | (13.12) |
| Ti | bcc | 4.24 | 202 | [1] | 4.14 | 1945 | 11.83 | 1.26 | NA | 0 | 10.57 |
| Zr | bcc | 6.25 | 147 | [1] | (6.0) | 2128 | 13.39 | 1.14 | NA | 0 | 12.25 |
Most of these data are taken from information collected in various tables in [5]. For example, the structure information is taken from Table 19.1, pp. 191ff. Values of for materials in the first group were determined using crystal entropy data collected in Problem 19.8, p. 207 (neutron scattering data is either unavailable or was taken in a phase other than the one from which the crystal melts); the second, third, and fourth groups were determined using neutron scattering data recorded in Table 15.1, p. 153; and the final two elements were handled by taking high- neutron scattering data from [8, 9] and inferring at (see Figure 9 of [7]). These renormalized include anharmonic contributions, so was neglected for these elements. (The fact that and are so close for these two materials [see Table 1] suggests that the crystal and liquid phases have approximately the same anharmonicity; this is also suggested by the specific heat data from Figure 1 of [3].) The corresponding values of for all materials were calculated from the experimental temperatures using extensive tables of density-temperature data at 1 bar for the elements.
The data are also found in Table 19.1 of [5] (except for the few values in square brackets, which are purely empirical estimates where data are unavailable), and the , , and data are from Table 21.1, pp. 220ff (again, except for Ar; see the next paragraph). The electronic entropy was determined for the elements in the first two groups using a free-electron model; for Ar is zero because Ar is not a metal; and results for the last two groups were computed using density of states calculations by Eriksson et al. [7]. was computed, as mentioned in the main text, by assuming it is equal to , which is negligible for all but the last five materials in the list (see Tables 19.2 and 19.3, pp. 201 and 203 of [5]). Anharmonicity in the last two is taken into account by the renormalized (see the previous paragraph), and for Cr, Mo, and W, (and thus ) was estimated by combining anharmonic entropy calculations from [7] and Table 19.3 of [5] to extrapolate to the densities in question. Finally, for ferromagnetic Ni and antiferromagnetic Cr were also taken from Table 19.3.
Special treatment was required for Ar because if is the density at which the neutron scattering data were taken and is the density of the liquid at melt at 1 bar, is far too large for Eq. (4) to be reliable. Thus we decided to set , as shown in Table 3, and used very extensive tabulated data of the Ar melt curve to find the pressure such that Ar would melt at the required density; from this we were able to infer the tabulated values for and , and from that point the calculations proceeded as with the other materials.
Finally, a few words are in order concerning the quality and accuracy of our data. On the crystal side, by comparing phonon moments computed from Born-von Kármán fits to various different sources of neutron scattering data, one sees that determinations of are typically accurate to 0.5%; given that measurements of typically have 10% error or less, an additional error of 2% or so is introduced by the computation of . These errors are independent, so the final error in lies between 2 and 2.5%. For the liquid, comparison of liquid entropy data from separate high-quality compendia, such as [10, 11] among others, indicates errors of for most values of . Various different electronic structure calculations of vary by 5-10% at most; these errors will affect our entropy results on about the 0.1% level for the materials in the first two groups and 1% for those in the last two groups. Finally, we estimate the error in to be about 0.5% of , so the harmonic part of the liquid entropy (and thus ) will be trustworthy to between 1% and 1.5%. Thus the error in the ratio is at most 3 to 4%; this is the source of the error estimate given in Section 3.
Eight materials which have been studied in connection with melting previously but are not included in this analysis are Kr and Xe, for which there are no entropy data along the melt curve at sufficiently high compression (so they cannot be treated as Ar was); and Fe, Th, Sb, Bi, Ba, and Ca, for which there are no reliable calculations or estimates of . This is a significant problem with Fe and Th, for which is expected to be large; it is not such a difficulty with the remaining four, but when combined with various other problems with their data (for example, neutron scattering was done on Ca in the fcc phase while the crystal actually melts from bcc), it is proper to neglect them here as well.
Acknowledgment
This work was supported by the U. S. Department of Energy through contract W-7405-ENG-36.
References
- [1] E. D. Chisolm, B. E. Clements, and D. C. Wallace, Phys. Rev. E 63, 031204 (2001); 64, 019902 (2001).
- [2] N. H. March and M. P. Tosi, Introduction to Liquid State Physics (World Scientific, Singapore, 2002), pp. 134-135.
- [3] E. D. Chisolm and D. C. Wallace, J. Phys.: Condens. Matter 13, R739 (2001).
- [4] D. C. Wallace, Phys. Rev. E 56, 4179 (1997).
- [5] D. C. Wallace, Statistical Physics of Crystals and Liquids (World Scientific, Singapore, 2003).
- [6] D. C. Wallace and B. E. Clements, Phys. Rev. E 59, 2942 (1999).
- [7] O. Eriksson, J. M. Wills, and D. C. Wallace, Phys. Rev. B 46, 5221 (1992).
- [8] W. Petry, A. Heiming, J. Trampenau, M. Alba, C. Herzig, H. R. Schober, and G. Vogl, Phys. Rev. B 43, 10933 (1991).
- [9] A. Heiming, W. Petry, J. Trampenau, M. Alba, C. Herzig, H. R. Schober, and G. Vogl, Phys. Rev. B 43, 10948 (1991).
- [10] M. W. Chase, Jr., C. A. Davies, J. R. Downey, Jr., D. J. Frurip, R. A. McDonald, and A. N. Syverud, J. Phys. Chem. Ref. Data 14, Suppl. 1 (1985).
- [11] R. Hultgren, P. D. Desai, D. T. Hawkins, M. Gleiser, K. K. Kelley, and D. D. Wagman, Selected Values of the Thermodynamic Properties of the Elements (American Society for Metals, Metals Park, Ohio, 1973).