Software systems as complex networks:
structure, function, and evolvability of software collaboration graphs
Abstract
Software systems emerge from mere keystrokes to form intricate functional networks connecting many collaborating modules, objects, classes, methods, and subroutines. Building on recent advances in the study of complex networks, I have examined software collaboration graphs contained within several open-source software systems, and have found them to reveal scale-free, small-world networks similar to those identified in other technological, sociological, and biological systems. I present several measures of these network topologies, and discuss their relationship to software engineering practices. I also present a simple model of software system evolution based on refactoring processes which captures some of the salient features of the observed systems. Some implications of object-oriented design for questions about network robustness, evolvability, degeneracy, and organization are discussed in the wake of these findings.
pacs:
89.75.Fb, 89.20.Ff, 87.80.VtI Introduction
In both the organic forms of nature and the engineered artifacts of human society, complex systems grow and evolve to reveal intricately networked organizations. Surprisingly, the underlying structures of these networks – including the Internet Faloutsos et al. (1999), the World Wide Web Albert et al. (1999); Broder et al. (2000), collaborations in science Newman (2001a, b) and cinema Watts and Strogatz (1998); Barabási and Albert (1999), interactions of proteins in yeast Jeong et al. (2001), and metabolic pathways in a variety of organisms Jeong et al. (2000) – have recently been found to share many “scale-free” and “small-world” qualities, which can be rather different from those found in simple random networks. These discoveries have served to draw together many disparate fields into an emerging science of “complex networks”, which aims to unravel the principles by which networked systems form, evolve, and remain robust and adaptable in the face of changing environments Strogatz (2001); Barabási (2002).
Software systems represent another important class of complex networks, which to date have received relatively little attention in this field. Software is built up out of many interacting units and subsystems at many levels of granularity (subroutines, classes, source files, libraries, etc.), and the interactions and collaborations of those pieces can be used to define networks or graphs that form a skeletal description of a system. Software systems are of course important in their own right, as the centerpiece of the information-based world in which we now find ourselves. But they also suggest some novel perspectives in the study of complex networks. Especially important is the fact that software systems are organized to be at once both highly functional and highly evolvable, with evolvability often implemented through collective and collaborative designs that target interfacial specificity as an important controlling parameter. This substantial emphasis on evolvability makes software systems somewhat different from other engineered systems, and closer in some ways to evolving biological systems.
Design is a central element of software construction, and many design methodologies deal explicitly with the structure of software networks, most often addressing the interactions of a small set of components at a time. But the combined and persistent action of implementation, refactoring, composition, extension, and adaptation leads to emergent software organizations whose structures lie outside the realm of explicit design. Understanding the large-scale structural organizations that form in software networks is increasingly important not only for applications developed by distributed, loosely coupled teams, but also for emergent computations that arise in adaptive, self-organizing systems of autonomous computing agents. More broadly, understanding the functional organization of evolvable software systems may provide models, metaphors, and tools to help us understand the forces that serve to organize other classes of complex networks, whose informational structures may not be as readily apparent.
The remainder of this section provides an overview of some relevant aspects of software design, and describes in more detail the nature of the collaboration networks examined here, specifically class collaboration graphs and subroutine call graphs from several existing open-source software systems. Section II examines the structure of those collaboration networks, describes their connection to other recently studied complex networks, and discusses some of the software engineering implications of those observations. Related work by others is discussed in section III. In section IV, I present a simple model of evolving software systems based on refactoring processes which captures some of the essential features of the observed systems. Section V highlights a few issues suggested by the synergies among software systems, object-oriented design, complex networks, and systems biology. Section VI provides a summary.
I.1 Collaboration in software systems: function and evolvability
Software engineering aims to decompose complex computational functionality into many separate but interlocking pieces. Rather than reimplementing similar computations explicitly in every new context, programmers develop abstractions of functions and data types that can be used many times, in multiple contexts. The ability to reuse existing code can both speed the process of adding new functionality (since new code need not be written) and facilitate the process of modifying existing functionality (since changes can be made to a single reused piece of code, rather than to multiple similar versions of code strewn throughout a large application). The process of computation, therefore, involves collaboration: the distribution of responsibility for computation among multiple software elements, such as objects, classes, methods, subroutines, modules, and components. These collaborations allow elaborate computational tasks to be built up in a modular and hierarchical fashion, in loose analogy with the way that sophisticated electronic circuits are built up from reusable, low-level components.
Software collaborations imply dependency relationships, in that some computational elements (e.g., classes and subroutines) need others in order to carry out pieces of their appointed task. One goal of software design and development, therefore, is to construct an optimal or near-optimal system of dependency relationships, whereby core elements are reused in different contexts to perform recurring fundamental tasks, with minimally constraining specializations added in higher functional layers in order to build upon or combine those fundamental tasks. The utility of minimal specialization (typically in the types of data being passed between subroutines and methods) is tied to the goal of code reuse: software units that function only under highly specialized conditions are generally less able to be broadly reused than those units that require only as much specialization as is required to implement a needed computation. Many factors can influence the decomposition that is actually chosen in a particular software project, however. For example, the process of subdividing computations into minimal units and generating complexity by combining those pieces does incur some overhead in computational performance. In scientific computing, the need for high performance has historically outweighed other design concerns, leading to more coarse-grained decompositions of data and functionality that enable efficient numerical processing on large chunks of data unencumbered by indirection and function calls. Ongoing research in the field of scientific computing aims to develop techniques for incorporating advanced software design methodologies without incurring excessive penalties in performance.
Building up software to carry out complex tasks is only one goal, however. The resulting system must also be evolvable, that is, transformable into a new system to accomplish new but related tasks without excessive cost or disruption to the system as a whole. The need to accommodate change is a major driving force in software engineering; this might include changes in external user requirements, underlying hardware platforms, forms of input data, or types of algorithms used. In poorly structured code, modifying or adding a single feature may require updates to many files or subroutines, which can themselves then cascade throughout the system. To combat this, many strategies have been developed to support the simultaneous demands of function and evolvability, so that code modifications remain localized. Many of these strategies hinge on instituting sufficient decoupling between subsystems, which enables developers to avoid constraints and commitments that make it difficult to change one part of a system without changing many others.
Design patterns Gamma et al. (1994), for example, are an important class of strategies to support software system evolvability. These patterns are motifs describing the relationships among collaborating classes or objects in an object-oriented (OO) software system which are effective at encapsulating variability and change. Different patterns identify different aspects of a system which are likely to change; those aspects might include how objects are created, which objects need to communicate with one another, or what particular algorithms are used to solve a problem. The highly variable elements of a system are then encapsulated behind generic interfaces or dedicated objects that act as brokers to mediate computational activity, thereby decoupling objects so as to avoid excess dependencies that can inhibit evolvability. Design patterns and related techniques are typically applied at a small scale, at the microstructural level describing interactions among a few objects. An open question, therefore, is how microstructural design methodologies conspire in the large to form macroscopic software structures.
Evolution and evolvability are of course central concepts in the description of biological systems, different in important ways from their meaning in software engineering. While software engineering involves intelligent action, biological evolution is blind, and does not. Nonetheless, from a systems perspective, there may be forms of network organization which support adaptations that are applicable to both blind biological evolution and intelligent software design. Furthermore, the software engineering community is increasingly recognizing the value of prototyping and other forms of interactive, trial-by-error design, in an effort to “embrace change” rather than struggle against the rapid pace of software evolution Beck (1999). Many of the software design patterns mentioned above, which are now codified and part of a developer’s standard repertoire, were initially emergent and recurring solutions that developers uncovered in their quest to build flexible, reusable code that could operate in rapidly changing environments.
The distributed and collaborative nature of software design is increasingly relevant at the social level of programmer interaction, as well. Many software projects begin as small efforts led by one or a few people, only to grow into large activities involving many developers scattered around the globe, a transition that has been dubbed “from the cathedral to the bazaar” Raymond (1999). While organized design methodologies that support software growth and change are useful even in the smallest projects, they become especially important in distributed multi-developer efforts where many individuals may work only on small pieces of the overall system. The work presented here does not explicitly examine the effects of transformations in the social infrastructure of developers, but examinations of that sort could prove quite interesting.
I.2 Software collaboration graphs
The interactions among software components are multidimensional and multifaceted, and any representation of a software system typically involves a slice or projection through that complex space of interactions. Call graphs that describe the calling of subroutines or methods by one another have long been used to understand the structure and execution of procedural activity in software systems, while class and/or object collaboration diagrams are used to glean insight into the relationships among abstract data types in OO systems. Static graphs typically describe the set of interactions that are possible, while dynamic graphs generated during program execution identify interactions that actually take place under specific run-time conditions. This work addresses static class collaboration graphs arising in OO systems and static call graphs arising in procedural systems, both of which can be parsed from source code.

In OO systems, the definition of objects and their interactions plays a central role. Objects represent data types that are defined to extend the basic, native data types provided by programming languages (integers, floating point numbers, characters, etc.), in order to develop more complex, application-specific, abstractions of data and their associated behaviors (which are implemented via methods). Typically, layers of objects are defined, building increasingly complex representations by aggregating simpler ones. An object representing a vector field, for example, may combine simpler objects representing vectors and spatial fields, which can themselves be defined independently of each other. (A vector object, for example, might provide support for adding two vectors and computing their dot product, whereas a spatial field object might support a coordinate-based lookup to retrieve the value of the field at a specified location. Both vectors and spatial fields might themselves be built up from even simpler objects, such as arrays.) Classes describe the form of objects in OO systems, and objects are instantiated at run time from their class descriptions.
Class collaboration is the process by which more complex, multifunctional classes are built from simpler ones. In this work, class collaboration is defined to include the interaction of classes both through inheritance – i.e., where one class is defined as a subclass of another – and through aggregation – i.e., where one class is defined to hold an instance of another class. A simple illustrative example of such a graph is shown in Figure 1. The direction of class collaboration and subroutine calling follows standard software engineering convention reflecting the flow of control in a system: an edge in a class collaboration graph is directed from class B to class A if B makes reference to A in its definition (either through inheritance or aggregation), and an edge in a call graph points from node g to f if subroutine g calls subroutine f from within its scope. The definition of class collaboration used here allows one to decompose the full class collaboration graph into two separate subgraphs, the inheritance graph and the aggregation graph.
| VTK | DM | AbiWord | Linux | MySQL | XMMS | |
| (a) | 788 | 187 | 1096 | 5420 | 1501 | 1097 |
| (b) | 1389 | 278 | 1857 | 11460 | 4245 | 1901 |
| (c) | 6 | 10 | 19 | 47 | 10 | 36 |
| (d) | 771 | 162 | 1035 | 5285 | 1480 | 971 |
| (e) | 1374 | 258 | 1798 | 11370 | 4231 | 1809 |
| (f) | 4 | 2 | 46 | 10 | 12 | 0 |
| (g) | 5 | 6 | 25 | 6 | 7 | 0 |
| (h) | 8 | 10 | 72 | 9 | 10 | 0 |
| (i) | 0.0165 | 0.0428 | 0.1332 | 0.0057 | 0.02 | 0.0 |
I have examined collaboration networks associated with six different open-source software systems. These include class collaboration graphs for three OO systems written in C++, and call graphs for three procedural systems written in C. The class collaboration graphs are from: version 4.0 of the VTK visualization library VTK ; the CVS snapshot dated 4/3/2002 of Digital Material (DM), a library for atomistic simulation of materials DigitalMaterial ; Myers et al. (1999); and version 1.0.2 of the AbiWord word processing program AbiWord . The call graphs are from: version 2.4.19 of the kernel of the Linux operating system, version 3.23.32 of the MySQL relational database system, and version 1.2.7 of the XMMS multimedia system. Details on the construction and/or origin of these networks is provided in the Appendix.
II Results
II.1 Connected components
Connected components in a graph are those subgraphs for which all nodes in the subgraph are mutually reachable by traversing edges in the subgraph. For a directed graph, one can define both weakly connected components (WCC) and strongly connected components (SCC). WCC are those connected components found in an undirected version of the graph (i.e., by treating all edges as bi-directional), while SCC are those connected components mutually reachable by traversing directed edges. By definition, every node in a directed graph will be in some WCC; not all nodes, however, belong to an SCC.
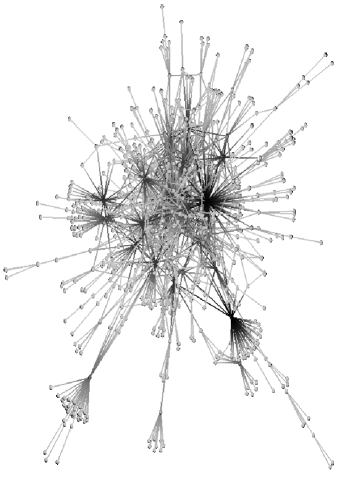
Connected component analysis reveals trends across the six systems of interest, which are summarized in Table 1. All six systems consist of a single dominant WCC, comprising a large fraction of the total nodes in the system (ranging from 86-99%), and a few (5-46) very small remaining WCCs. A picture of the largest WCC for the VTK system is shown in Figure 2. Conversely, few nodes belong to any SCC (less than about 4% in five of the six systems). The lack of strong membership in SCCs is rather different from that found in other directed complex networks, such as the WWW Broder et al. (2000) and various metabolic networks Jeong et al. (2000). This difference is perhaps not surprising, given the nature of the software graphs under investigation, which largely reflect aggregation (of data in the case of the class collaboration graphs, or function in the case of call graphs). SCCs reflect subgraphs that are mutually reachable, but the hierarchical directionality of use implicit in software aggregation makes mutually reachable clusters of this sort unlikely, and undesirable from a software development standpoint. While generic base classes are reachable from their derived subclasses, for example, the opposite is generally not true, since that would undermine the genericity inherent in those base classes. Similarly, one subroutine may call another as part of its execution, but typically, the reverse is not true.
II.2 Degree distributions
Degree distributions, summarizing the connectivity of each node in a graph, are a feature that distinguish many complex networks from simple random graphs. For each node in a directed graph, there is both an in-degree , the number of incoming edges to node , and an out-degree , the number of outgoing edges from node . The in- and out-degree distributions and indicate the probability of finding a node with a specified in-degree or out-degree , respectively, in a given graph. Many complex networks have recently been found to possess a “scale-free” degree distribution Barabási et al. (2000), indicating a lack of characteristic scale (or degree) in the distribution . This implies that obeys a power law over an extended range of degrees : , or perhaps a power law truncated by an exponential cutoff: . In contrast, a uniform random graph of nodes and links on average per node has a degree distribution with a characteristic scale , with decaying exponentially away from Erdös and Rényi (1960).
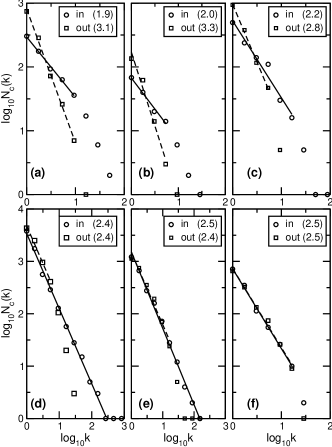
I have examined the in- and out-degree distributions of the large dominant WCC for each of the six software systems of interest. For each WCC, I have computed the unnormalized cumulative frequency distributions and , where indicates the number of nodes in a graph with degree greater than or equal to , and have plotted the logarithms of these distributions in Figure 3. ( is an unnormalized integral of the probability distribution ; for , .) These distributions reveal a power-law scaling region (straight line on a log-log plot), followed by a faster decay at large . The extents of the power-law regions are admittedly small, particularly for the out-degree distributions, which one might argue to be representative of exponential distributions. Power-law fits for all 12 distributions have been carried out over the regions for which they exhibit scaling, and the values of the exponents and are shown in the legends in Fig. 3.
Interestingly, the class collaboration graphs shown in Fig. 3 reveal a marked asymmetry between the in-degree and out-degree distributions, whereas the call graphs do not. In the class collaboration graphs, the out-degree exponent appears to be significantly larger () than the in-degree exponent (). For the procedural call graphs, . For both sets of graphs, the in-degree distributions tend to extend to higher ; that is, it is more likely to find a node with many incoming links than outgoing links.
As noted, the three class collaboration graphs also each contain an embedded inheritance graph. Since multiple inheritance is commonly avoided (due to programming difficulties that it introduces), the out-degree distributions of the inheritance graphs are strongly peaked at and . The in-degree distributions for each of the three inheritance graphs, on the other hand, also exhibit rough power-law scaling, with exponents (not shown). Therefore, insofar as the in-degree distributions are concerned, the structural forms of the overall collaboration graphs mirror those of the embedded inheritance graphs. The heavy tail in the out-degree distribution, however, arises entirely from non-inheritance-based associations of classes (such as the relationships BA, CA, CB, and DA in Fig. 1).
Classes and subroutines with small out-degree are generally simple, since they do not aggregate other elements. (If they became too complex, there would be a pressure to break them up into simpler pieces and introduce outgoing links.) Conversely, elements with large out-degree are generally more complex because they aggregate behavior from many others. Therefore, the existence of heavy-tailed and/or scale-free out-degree distributions suggests a broad spectrum of complexities. On the other hand, classes and subroutines with large in-degree are – by definition – reused in many contexts, while those with small in-degree are not. Thus, the existence of heavy-tailed in-degree distributions implies a broad spectrum of reuse. Less interesting, perhaps, are those many classes and subroutines that are neither heavily reused, nor heavily constructed from other elements.
Software engineering practice encourages reuse, that is, large in-degree; so it is not surprising that the largest degrees in these systems are for incoming links. It is not obvious, however, why the class in- and out-degree distributions should be characterized by quantitatively different scaling exponents. The fact that the procedural call graphs examined do not exhibit this in-out exponent inequality also suggests further avenues of study: first and foremost would be an examination of the call graphs associated with the three OO systems studied, to ascertain whether in-out asymmetry is a property of class collaboration or of object-oriented systems more generally.
II.3 Degree correlations
Correlations among degrees can also provide insight into the structure of complex networks. The directedness of these graphs allows us to examine the relationship between in-degrees and out-degrees. Figure 4 shows this relationship for each of the six systems of interest, where every node in each graph is represented by its () pair.
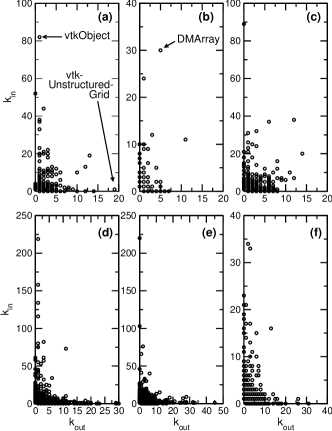
It is visually apparent in Fig. 4 that nodes with large out-degree generally have small in-degree, and those with large in-degree have small out-degree. This trend can be verified by evaluating the linear (Pearson) correlation coefficient between the sets and for those nodes with either a large in-degree or large out-degree (or both); a threshold value of at least ten edges has been chosen as a filter, somewhat arbitrarily as a demarcation between the dense core of low-degree nodes and the sparser set of high-degree nodes. Table 2(a) shows the correlation coefficient for each of the six software systems studied, demonstrating a negative correlation between in- and out-degree for nodes with large degree in five of the six data sets. Including the entire set of nodes for each data set (i.e., not selecting only those nodes with ) reveals, however, almost no correlation in the call graph data (Linux, MySQL, XMMS), and weak positive correlation in the class collaboration data (VTK, DM, AbiWord). This anticorrelation of large in- and out-degree implies that, for the most part, there is a clear distinction between large-scale producers of information (with high in-degree) and large-scale consumers (with high out-degree). Simple components tend to be heavily reused, presumably because they are generic and applicable to many different contexts, whereas complex components do not, because they are highly specialized and only applicable in limited contexts.
There are, however, outliers to that trend of separation; classes with both large in-degree and large out-degree are evident in Fig. 4(a)-(c). These classes have both significant internal complexity (associated with aggregating the behavior of several other classes), and significant external responsibility. There is reason to expect that such classes could be problematic insofar as software development is concerned. By way of informal case study, my experience with development of the Digital Material (DM) system (Fig. 4(b)) confirms such a suspicion. The DMArray class identified implements both array-like and tree-like functionalities, and is intended to be a primitive data structure for much of the numerical computation in the system. Curiously, DMArray caused the most persistent trouble within the DM development group. The source of the difficulty largely centered around the conflicting roles that DMArray plays. On the one hand, the class is intended to be a primitive black box onto which more complicated functionality is to be layered, while at the same time, it is itself a complicated datatype with substantial internal structure and external behavior. It would be interesting to know whether other items with large in- and out-degrees apparent in Fig. 4 have played similarly problematic roles in the development of those various systems. The complexity of software components with large in- and out-degrees is highlighted in the software metrics literature, for example, by the “fan-in fan-out complexity” metric Henry and Kafura (1981), which states that complexity of a code module is proportional to the square of the product of the fan-in (in-degree) and the fan-out (out-degree) of the module.
| VTK | DM | Abi | Linux | MySQL | XMMS | |
| (a) In/out | ||||||
| -0.48 | 0.01 | -0.16 | -0.18 | -0.23 | -0.75 | |
| all | 0.09 | 0.10 | 0.18 | -0.01 | -0.03 | -0.07 |
| (b) Mixing | ||||||
| in – in | 0.088 | -0.043 | 0.065 | -0.005 | 0.114 | 0.067 |
| in – out | -0.034 | -0.010 | 0.083 | -0.009 | -0.067 | -0.036 |
| out – in | -0.169 | 0.020 | 0.042 | -0.098 | -0.101 | -0.180 |
| out – out | 0.137 | 0.098 | 0.111 | 0.014 | 0.179 | 0.093 |
| undirected | -0.194 | -0.192 | -0.084 | -0.067 | -0.083 | -0.114 |
Another measure of degree correlation is the mixing by degree of a graph Newman (2002). This quantity measures the linear correlation of degrees over all edges of a graph, i.e., the correlation of degrees and for all sites and that define an edge in a given graph, aggregated over all edges in that graph. This reflects the tendency of nodes of similar degree to be connected to one another. Most work on mixing by degree has focused on undirected graphs or undirected versions of directed graphs, for which there is a single correlation coefficient of interest: , relating and for the node pair that are linked by an edge in the graph. In a directed graph, there are four possible correlation coefficients: , , , and , where the index refers to the source node of the directed edge, and refers to the destination node. Table 2(b) shows the values of each of these correlation coefficients, for each of the six graphs in question. Also computed is the degree mixing of the undirected version of each software graph. The undirected versions all show a weak negative correlation (dissortativity) which suggests that nodes with similar degrees tend not to be connected to each other. The directed graphs, however, tell a different story. There, we find – most significantly – a weak positive correlation (assortativity) among out-degrees, that is, a tendency for nodes with similar out-degree to be connected. There is a yet weaker positive correlation among in-degrees. While these correlations are rather weak, their magnitudes are typical of those seen in a variety of other complex networks Newman (2002).
The weak positive assortativity among out-degrees seen in the software networks is due in part to the hierarchical layering of functionality. For example, in the VTK system, a complex aggregated class with large out-degree such as the vtkUnstructuredGrid does not collaborate directly with very low-level objects (such as vtkObject); instead, it is built up out of collaborations with “mid-level” objects (such as vtkPolygon and vtkHexahedron), which themselves are aggregates built up from lower-level classes. Similarly, the weaker positive assortativity among in-degrees for some of the graphs probably reflects the tendency for simpler objects with large in-degree to collaborate with each other at the base of a hierarchy of functional layers. In the undirected versions of these graphs, the negative correlation observed reflects in part the fact that nodes with a large out-degree are not linked to the nodes with a large in-degree, because of the functional separation between producers and consumers described above. These results further emphasize that the directedness of these graphs is important. Newman Newman (2002) has noted that sociological networks (e.g., scientific collaborations) tend to be assortative (positively correlated), but that technological and biological networks are generally disassortative. Clearly, for these software graphs, teasing out the degree correlations requires examining directed edges.
II.4 Clustering and hierarchical organization
Clustering – the tendency of a node’s neighbors to be themselves neighbors in the graph – is a significant characteristic of small-world networks. While the results above indicated the importance of graph directedness, clustering is typically measured on undirected graphs. For such a graph, the clustering coefficient of node is defined as , where is the number of pairs of neighbors of node that are linked, and is the degree of node . This quantity is simply the fraction of all possible pairs of neighbors of node that are themselves linked in the graph.
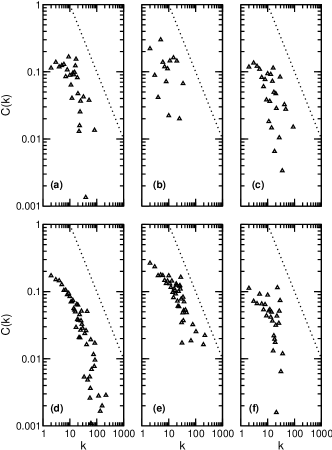
Recent work by Ravasz et al. Ravasz et al. (2002); Ravasz and Barabási (2003) suggests that degree-dependent clustering of the form is a signature of hierarchical organization in networks, and can serve to distinguish hierarchical from non-hierarchical scale-free networks. They also suggest that hierarchical organization serves to resolve the apparent dilemma between scale-free degree distributions on the one hand (which imply no characteristic scale of connectivity) and modular structure on the other (which suggest connectivities at the scale of those consistent with modular units). Figure 5 plots, for each of the six software graphs of interest, the degree-dependent clustering , defined as the average clustering for nodes in the undirected graph with degree . These data are roughly consistent with those presented in refs. Ravasz et al. (2002); Ravasz and Barabási (2003), typically showing a flat for small which rolls over to a tail at large (more clearly defined for the larger graphs). The tail is derived in refs. Ravasz et al. (2002); Ravasz and Barabási (2003) for a specifically constructed hierarchical model; therefore, the existence of scaling in real graphs would appear to be an indirect indicator of hierarchical organization. Nonetheless, given the hierarchical nature of software design, further investigation of this sort of clustering in software graphs is warranted. Methods for extracting modules and subsystems using the clustering data may also provide insight into the organization of these systems Ravasz et al. (2002).
II.5 Topology, complexity, and evolution
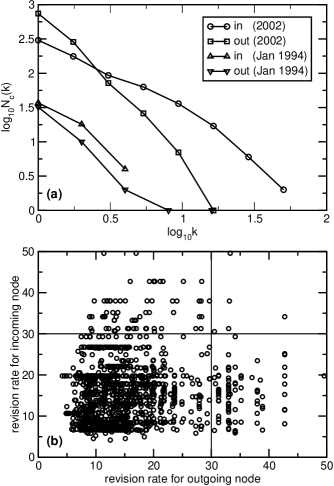
Software systems can be characterized by a variety of metrics, which can be compared to the underlying collaboration network topology. The VTK system, in particular, has been developed in a manner that facilitates such measurements. For every class in the VTK system, I have calculated three quantities of interest: (a) total source file size for each class; (b) total number of methods defined for each class (including inherited methods), and (c) average revision rate for each class over the lifetime of the VTK project (average number of source file revisions per year, since initial commitment to the VTK CVS source code repository). Details on these calculations are presented in the Appendix.
| VTK class complexity measures | in | out |
|---|---|---|
| source file size | -0.28 | 0.58 |
| number of methods | -0.26 | 0.61 |
| average revision rate | -0.28 | 0.68 |
For each class, these three metrics can be related to the in- and out-degrees of that class; the linear correlation of these metrics with degree is reported in Table 3. We see that all three metrics have a strong and positive correlation with out-degree, and a weaker, negative correlation with in-degree. Each of these metrics reflects a different facet of class complexity (implementation size, interface size, revision rate), and we see that nodes with large out-degrees tend to be more complex than those with large in-degrees, consistent with the scenario outlined previously.
The evolution of complex networks is a problem of great interest, and the class revision history data for the VTK system provide some insight into the evolutionary processes of software development, which are summarized in Figure 6. Figure 6(a) shows a comparison of the collaboration graph degree distributions for the current VTK system (circa 2002) with those for the system in its nascent state, at the end of January 1994 (the VTK “reptile brain”, so to speak). We see that the heavy-tailed collaborative structure of the system was in place from the outset, although the in-out asymmetry was less pronounced. Figure 6(b) examines the coevolution of classes that collaborate in the VTK system. For every edge in the VTK graph, the revision rates of the outgoing source node and the incoming destination node are plotted against each other. From these data, we find an interesting, and perhaps unexpected, trend. For the entire dataset, there is a weak positive correlation among revision rates for connected classes (correlation = 0.10), indicating a weak tendency for collaborating classes to evolve at the same rate. But if we restrict our focus to only those classes with large revision rate, e.g., greater than 30 revisions per year on average, we find a strong negative correlation (correlation = -0.72). This implies that classes that evolve most quickly tend not to interact directly with each other.
The data in Table 3 reveal that, in the VTK system, classes with large out-degree tend to evolve more rapidly than do classes with large in-degree. On the one hand, one might imagine that the information consumers with large out-degree evolve more rapidly simply because they have greater implementation sizes and a larger number of methods subject to revision. Alternatively, one might imagine that evolution rate is primarily governed by the nature of connections to other classes: information producers with large in-degree are constrained to remain stationary (since other classes depend on them), while information consumers are generally forced to evolve to keep pace with changes in all the other classes that they aggregate but are generally unconstrained by large numbers of users. This latter scenario would suggest signatures of coevolution, that is, correlation of evolution rates that are connected in the collaboration graph.
We saw in Fig. 6(b) that there was a weak coevolutionary tendency on average for the entire VTK system, but a strong anticorrelation of coevolution among rapidly evolving classes. The rapidly evolving classes are primarily (as seen in Table 3) information consumers with large out-degree, which are part of specialized functional subsystems rather than the more generic functional substrate. The strong anticorrelation of interactions among highly evolving classes may thus reflect a degree of modularity within the system, that is, the functional separation of different specialized subsystems. Whatever weak coevolution there is appears to be confined to the more generic substrate. Further work is needed to explore the relationships among evolution, connectivity, and constraint. Similar explorations are taking place within biology, to explore the relationship between network connectivity (e.g., graphs of protein interactions) and evolution rate Fraser et al. (2002).
III Related work
The fields of software metrics and reverse engineering examine software systems in the aggregate, with significant emphasis on measures of nodal degree in various software graphs. By and large, however, their scale-free nature appears to have escaped notice within those communities. Distributions of component connectivity are often summarized in terms of means and variances, which are poor characterizations of scale-free distributions. The asymmetry between large in-degree and large out-degree has long been identified by software engineers as an important element of design, since large out-degree indicates significant code reuse while large in-degree indicates excessive object complexity Henderson-Sellers (1996).
The existence of scale-free, small-world networks in software graphs has been noted recently by a few groups, however. Valverde and coworkers Valverde et al. (2002); Solé et al. (2002) have examined class collaboration graphs derived from the Java Development Framework 1.2 (JDK1.2) and the UbiSoft ProRally 2002 game system. They have noted scale-free degree distributions and larger-than-random clustering characteristic of small worlds. Their work does not distinguish, however, between incoming and outgoing links in the software networks they have studied; that is, they have formed undirected graphs by ignoring edge directionality. With undirected graphs, they could not detect either the asymmetry between the in-degree and out-degree exponents evident in Fig. 3, or the anticorrelation of large in-degree and large out-degree seen in Fig. 4. Perhaps more importantly, ignoring the directionality of edges leads to different sorts of conclusions about the implications of software engineering guidelines. They claim that software design is predicated in part on the “rule of avoiding hubs (classes with large number of dependencies, that is, large degree)” Valverde et al. (2002), which does not recognize that large out-degree and large in-degree have very different software engineering implications. Valverde et al. Valverde et al. (2002), however, do propose an interesting scenario by which minimization of development costs might lead to an optimal trade-off between developing a small number of large, expensive components with few interconnections and a large number of small, inexpensive components with many interconnections. They suggest that only sub-optimal solutions can be found in large, complex systems, leading to scale-free/small-world behavior; this is an interesting conjecture deserving further study, perhaps within the context of synthetic models of software systems, such as the one that I will introduce below.
Potanin et al. Potanin et al. (2003) have examined the structure of object graphs, representing run-time snapshots of object interactions in several OO programs. Object graphs are the dynamic, run-time analogs of the static class collaboration graphs studied here. Potanin et al. observed power-law in-degree and out-degree distributions, noting a tendency for in-degree exponents to be clustered near 2.5, and out-degree exponents near 3, somewhat like the trend that I have observed for class collaborations in this work. They also note the strong separation of large in-degree and large out-degree, similar to that presented here in Fig. 4. Ultimately, developing a theory of the relationships between static class graphs and dynamic object graphs might prove useful to the software engineering community.
Wheeldon and Counsell Wheeldon and Counsell (2003) have identified power-law relationships in several OO measures, including inheritance and aggregation graph degrees, and numbers of methods, fields, and constructors defined by classes in OO systems. They treat inheritance and aggregation as two separate types of class collaboration (which they are), while I have chosen to define collaboration more broadly to include both. They fit power laws to the full range of their distribution data, even when there are apparent transitions between scaling behaviors (e.g., from power-law to exponential), making comparison with the present work difficult. The numerical values of the degree-distribution exponents they quote () are rather different from those found here and in the work of Valverde et al. Valverde et al. (2002) (), but it is not clear whether or not they have corrected for the exponential bin sizes that they use to deal with sparse statistics in the tails of the distributions.
Both Potanin et al. and Wheeldon and Counsell make reference to the process of preferable attachment as a mechanism for generating scale-free networks, as outlined by Barabási and Albert (BA) Barabási and Albert (1999). Preferential attachment was originally proposed to describe the growth of the World Wide Web, but seems less well-suited to describe the growth of software systems, although such attachment is indirectly related in that low-specificity “hubs” will generally attract more incoming links if they present broadly reusable abstractions. But the BA preferential attachment model is acknowledged to be incapable of generating hierarchical structure, which is clearly relevant for software design, and which is evident in power-law, degree-dependent clustering such as seen here in Fig. 5.
Several features of the present research – including examinations of degree-dependent clustering, correlation of network topology with various class complexity measures, and the evolutionary history of class collaborations – have not been explored in the other works cited above. Also, the present work introduces – in the following section – a model of software evolution based on a set of standard practices that captures some of the salient features of the observed software networks.
IV A refactoring-based model of software evolution
As suggested earlier, software systems have a complex structure not only to support the implementation of complicated functionality, but also to allow for low-cost evolvability. It is an interesting question to ask, therefore, how software engineering practices used to enhance system evolvability might alter the topological structure of software collaboration graphs. An intriguing framework for addressing such a question, and for generating models of evolving software systems, is the set of processes collectively known as refactoring Fowler et al. (1999), which aim to remove “bad smells” from code that inhibit evolvability (e.g., extendability, modifiability, maintainability, and readability). Refactoring tends to encourage the development of smaller, more concise, single-purpose fragments of code (classes, methods, and subroutines) that can be reused in a wider range of contexts, as opposed to larger, multipurpose pieces of code that often contain duplicated program logic. Large methods and classes are often broken up into collections of smaller ones, with appropriate indirection from the former to the latter, leading to the creation of more nodes and more edges in the resulting software graphs. Duplicated pieces of code are extracted from multiple locations in the source code, and localized in a single place to which other pieces of code refer. (In some instances, however, a developer may deem such indirection excessive and not worth the overhead; in those cases, refactoring techniques would suggest the removal of nodes and/or the collapsing of hierarchies.) Many refactoring techniques can be cast in the language of optimization, by minimizing (or altogether removing) bad smells that pervade software.
Motivated by the basic observation that refactoring improves code evolvability by reorganizing its internal structure, I have implemented a simple model of an evolving software system, based on a few refactoring techniques. The model is overly simplified, insofar as its treatment of software systems and practices is concerned, and can never replicate the detailed structures of real software systems, which are certainly history- and project-dependent. Nevertheless, some coarse features of the observed software networks can be replicated with the simple refactoring model, which points the way toward more sophisticated models of this sort, as well as further empirical study of actual software systems undergoing refactoring.
In the model, binary strings of arbitrary length (i.e., strings composed of ’s and ’s) serve as proxies for the subroutines in call graphs and the classes in class collaboration graphs. No attempt is made here to distinguish between call graphs and class collaboration graphs, so I will generically refer to these binary strings as “functions” or “strings”, and to the network of their interactions as a “call graph”. Aggregation of functions is achieved through concatenation of strings (represented here via the addition operator). Therefore, a larger, more complex, string can be built up from smaller, simpler strings: e.g., . Such a concatenation also has a call-graph-based interpretation: the original parent node () has a link to each of the child nodes from which it is composed ( and ), as do the second-generation parent nodes to their children. One can think of the original parent node (before decomposition) as a single long function which calls no other functions; after decomposition, the original function consists only of calls to the new child nodes. (Obviously, such a decomposition is not unique, but that is true of software systems as well.)

In this model, three refactoring processes are implemented within the framework of a Monte Carlo simulation, as schematically represented in Figure 7: (1) functions that are excessively long tend to be decomposed into a set of smaller functions; (2) functions that already exist are used by others, rather than having duplicated versions of the same function within the system; and (3) some functions that are deemed to support “excessive indirection” are removed, with appropriate rerouting of the call graph. More precisely, these processes are implemented as follows. With probability , a randomly selected function in the call graph is decomposed into two smaller subfunctions with probability given by where is the length of the string under consideration, and and are adjustable parameters. This probability is constructed in analogy with the Fermi-Dirac distribution of statistical mechanics, and reduces in the limit to the rule that any function with length greater than will be decomposed (but which allows that threshold to be fuzzy for non-zero temperature ). A function that is selected for decomposition is split into two subfunctions, with the breakpoint selected at random (uniformly) anywhere in the string, as long as each subfunction has at least unit length. If either of the two subfunctions already exists (i.e., is a defined node in the call graph), a link from the parent function to that child subfunction is created. If a subfunction does not exist, a new node in the call graph is created, and the parent is linked to it. In this model, therefore, no duplication of code is allowed (respecting the proclamation of Beck and Fowler that duplicated code is “Number one in the stink parade” Fowler et al. (1999)). The final refactoring process (removing “excessive indirection”) is carried out with probability . Specifically targeted are nodes in the call graph that have only one parent (i.e., are called by only one other function) and only two children; I will refer to such nodes as “one-off functions”. One such node from the set of eligible nodes is chosen at random, and is removed from the system, such that its one parent node is linked directly to its two child nodes. This specification is admittedly arbitrary, and could be further parameterized; but the general purpose of such a process is to remove functions that do not represent broadly useful abstractions (i.e., are not used by many parent functions in different contexts) and that do little more than to simply aggregate a small number of other functions (i.e., two).
In the version of the model studied to date, the evolution process is begun by constructing a call graph consisting of uniformly random binary strings, each of length , with no function calls among them. One could think of this initial set as a group of long functions that are written explicitly in low-level code, with no subroutines defined to abstract subunits of the computations. As the refactoring process unfolds, these overly long functions are decomposed into sets of smaller functions, with links developing in the call graph, and with smaller functions separated out for reuse by others. Initially, the only active refactoring processes are long function decomposition and reuse of existing functions, since there are no one-off functions to be removed at first. Over time, however, one-off functions become available for removal. Such a system will eventually reach an asymptotic steady state where all possible refactorings have been carried out, although the decomposition of strings with length can be very slow for small, nonzero . In the present work, I have stopped the refactoring process once the size of the call graph ceases to change for at least 10000 consecutive refactoring steps.
Results from one such simulation are shown in Fig. 8, which plots the in- and out-degree distributions [part (a)], the in- vs out-degree correlation [part (b)], the relationship between nodal degree and string length [part (c)], and the degree-dependent clustering [part (d)] for the refactored software graph, in analogy with the results presented in Figs. 3, 4, and 5.
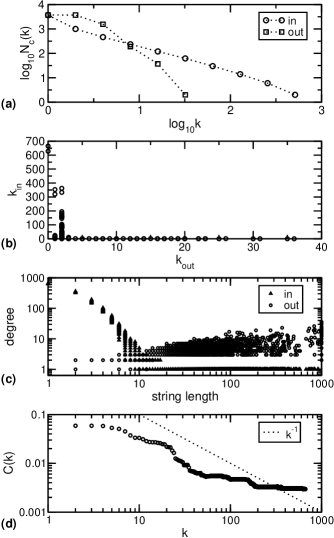
This simple refactoring model captures many of the salient features of the observed systems. Fig. 8(a) demonstrates heavy-tailed degree distributions similar to those in the three class collaboration graphs shown in Fig. 3 (with in-degree exponent and out-degree exponent ), although – as noted above – there is nothing specifically in the model that distinguishes class collaboration graphs from call graphs. A detailed examination of the refactoring process reveals that the heavy tail with large in-degree is generated by the process of large function decomposition and associated reuse of existing functions (no code duplication). The tail with large out-degree arises from the process of one-off function removal. Fig. 8(b) reveals an in-out degree correlation similar to that seen in Fig. 4, with the large in-degree and the large out-degree separated from one another. Furthermore, the significance of these large degrees is similar to what was identified previously, as is supported by Figure 8(c), which plots nodal degree as a function of string length for the resulting call graph. Large in-degree/small out-degrees represent small, simple functions (short strings) that can be and, in fact, are reused in many contexts by many other larger functions; whereas large out-degree/small in-degrees represent large, complex functions that aggregate many smaller functions but which are themselves used in few contexts. Finally, Fig. 8(d) reveals degree-dependent clustering similar to that suggested by the hierarchical organization scenario and as seen in the data in Fig. 5, although the source of the flattening of at large is unknown. As noted, the large out-degree tail in Fig. 8(a) is generated by one-off function removal. Were this process not included, the out-degree for every function would be either 0 (not decomposed) or 2 (decomposed into two substrings). Alternative rules for decomposing large strings might produce heavy-tailed out-degree distributions even in the absence of one-off function removal, but further work is needed to explore in detail the behaviors of models inspired by refactoring techniques. Those interested in the tradeoffs between indirection and computational performance might be motivated to construct a variant of this model whereby long string decompositions incur a penalty cost associated with performance degradation; other studies might try to quantify the suboptimality suggested by Valverde et al. Valverde et al. (2002) which could be associated with frustration of the sort seen in other complex, disordered systems.
V Software systems and complex networks: the implications of object-oriented design
V.1 Robustness, fault tolerance, and evolvability
Researchers grappling to understand the structure, function and evolution of complex networks highlight robustness as an important theme in complex networks. Studies have indicated Jeong et al. (2001); Carlson and Doyle (2002) that one by-product of scale-free networks in certain systems is enhanced robustness in the face of random node failure (although with increased fragility to failures of highly connected nodes). Analyses that highlight the similarities between biological systems and engineering systems often emphasize redundancy in networks as a mechanism for fault tolerance Csete and Doyle (2002). Software systems, on the other hand, are notoriously fragile, and at many scales (e.g., single point mutations at the level of a typographical error, inability to find a library needed for linking, cascading modifications that follow from changes to a single class). Of course, there are specialized applications which absolutely require fault tolerance or are capable of exploiting redundant resources in the case of network disruption (e.g., in distributed processing applications).
By and large, however, the complexity that lurks within software systems is not responsible for implementing fault tolerance and robust control, as is the case for many complex engineering systems. Rather, much of the structural complexity of large software systems – and in object-oriented systems in particular – is to support evolvability. The need to continually accommodate and incorporate changes in the external environment (user requirements, hardware platforms, etc.) lead to software designs that support modularity, decoupling, and encapsulation Gamma et al. (1994). This connection between environmental changes and adaptation toward modular network structure has been noted in several other contexts, such as in models of biological evolution Lipson et al. (2002) and neural networks Seth and Edelman (2003). In contrast, very little of the complexity inherent in complex engineering systems Csete and Doyle (2002) is in place to support evolvability and the construction of the next generation system (despite the fact that design elements do get reused).
Much of the evolvability that is organized within software systems arises from carefully planned genericity and associated decoupling, using polymorphism and encapsulation to negotiate the inherent trade-offs between specificity and evolvability of interactions. While naive notions of object orientation suggest the proliferation of increasingly deep class hierarchies that implement increasingly specialized objects, the software engineering community has learned that systems based on those sorts of objects and interactions are often hard to modify Gamma et al. (1994). Design patterns aim to organize the interactions of objects in such a way as to ensure sufficient specificity for regulation and control without unduly freezing a system into commitments and constraints that are difficult to evolve. Viewed in this manner, design patterns are similar to biochemical processes such as regulated recruitment Ptashne and Gann (2002) that serve to ensure specificity through the cooperative action of several, more generic chemical constituents, rather than the specific action of a single, complex component. It may be that scale-free network topologies help to mediate the trade-offs between specificity and evolvability, and present a mechanism for minimizing constraint while ensuring the specificity required for regulation and control.
V.2 Degeneracy and redundancy
The biological community has begun to make distinctions between redundancy, involving the ability of identical elements to perform identical functions, and degeneracy, involving the ability of different elements to perform similar (or perhaps identical) functions Tononi et al. (1999); Edelman and Gally (2001). This distinction emphasizes the role that degeneracy can play in evolvability; whereas identical and redundant elements are unable to provide any novel function in the face of changing environments, similar and degenerate elements offer avenues for adaptation because they offer the potential to provide different behaviors in different contexts. Degeneracy in biological networks is in fact similar to polymorphism in object-oriented systems, in that different objects can substitute for one another to perform structurally similar functions which nonetheless differ in detail. This polymorphism imbues OO systems with evolvability by enabling them to be more easily adapted to changing needs and environments. Tononi et al. Tononi et al. (1999) have developed information-theoretic measures to quantify redundancy and degeneracy in neuronal networks, and it is an interesting open question as to whether connections between degeneracy and polymorphism might suggest novel ways of analyzing and interpreting software systems based on similar sorts of measures.
Curiously, Solé et al. Solé et al. (2002) have commented that software collaboration networks have “a certain degree of [redundancy] but no [degeneracy]”. Their assertion of redundancy is based on the existence of duplicated code, but this confuses duplicated code with redundant code; duplicated code is not redundant unless it is embedded in the same computational context, in the same way that two identical resistors serving distinct roles in an electrical circuit are not redundant to each other. They claim that there is no degeneracy in software because “degeneracy is very common [in] natural systems…but totally unknown with the context of technological evolution”. They further note that “degeneracy is intimately associated with tinkering in evolution: it reflects the re-use that is made of different parts of a system in order to achieve similar functions.” I would argue that degeneracy is in fact quite common in some software systems, largely in the form of polymorphism, but perhaps through other mechanisms as well. Furthermore, generalizing from other technological systems to software systems is problematic, in part because software is softer and more abstract than other engineered systems. And software design does itself involve a significant amount of evolutionary “tinkering”, which is becomingly increasingly recognized and formalized through processes such as refactoring Fowler et al. (1999) and extreme programming Beck (1999).
V.3 Motifs, patterns, and emergent computational structures
There is growing interest in scanning large, emergent networks to locate statistically significant, recurring motifs, and ultimately identifying the functional significance of those motifs Shen-Orr et al. (2002); Milo et al. (2002). Information processing systems – including gene transcription networks, neuronal systems, and electronic circuits – are seen to make use of recurring motifs such as feed-forward loops and bi-fans (and in some cases, bi-parallel subgraphs) Milo et al. (2002). A preliminary examination of recurring motifs in the six software graphs studied here, using the motif finding algorithm of Alon and co-workers Milo et al. (2002), identifies these same motifs as being prevalent, but further study is needed to examine their significance. It remains to be seen, however, whether such techniques will be able to identify meaningful software motifs (e.g., design patterns) in all their glory, given the relatively crude representations of software networks presented here. The software reverse engineering community is beginning to tackle the problem of extracting complex design patterns from existing software systems, but such work relies largely on detailed, a priori specifications of the structure of those patterns and more detailed class information than is contained in the graphs studied here Asencio et al. (2002). An interesting challenge for the software engineering community would be to develop systems and algorithms capable of extracting important patterns and motifs from large software networks without such detailed prior information. Such an effort would not only be useful for software design and analysis, but might also help to guide the field of complex networks in identifying functionally important motifs.
One other interesting connection between software and complex networks involves the very notion of “software engineering”. As software systems move increasingly into the realm of the emergent and the unpredictable, a new notion of “software science” may unfold, emphasizing fundamental phenomena to be explored, as opposed to cut and dried systems to be built. An interesting question concerns the formation of structures akin to software design patterns. In the same way that recurring spatial patterns (vortices, dislocations, fronts, and solitons) can arise in physical systems under stress, it may be that recurring functional patterns (adapters, factories, mediators, and proxies) can arise in appropriately defined computational systems driven far from equilibrium.
VI Summary and conclusions
In this paper, I have examined several aspects of software collaboration networks, inspired by questions in complex networks, software engineering, and systems biology. Not unlike findings by others, the software collaboration networks studied all exhibit scale-free and/or heavy-tailed degree distributions qualitatively similar to those observed in recently studied biological and technological networks. An examination of these software systems reveals that the hierarchical nature of software design has an impact on the overall network topology. Simpler, more generic classes and subroutines form the heavy tail of the in-degree distribution, and complex, more specialized aggregates populate the heavy tail of the out-degree distribution, with the two generally well separated from one another. While the process of aggregation facilitates the coregulation of many constituent elements, such control is also constraining, and more difficult to evolve. Design patterns, polymorphism, refactoring, and related techniques aim to minimize specificity of interactions while still enabling specific control, and it may be that the scale-free nature of software collaboration networks reflects these sorts of trade-offs in the large.
The work presented here highlights the need to preserve edge directions in studies of directed software graphs, a fact that has long been recognized within the software engineering community. Edge directionality is required to uncover several network features, such as: differences between in- and out-degree distributions, the anticorrelation between large in-degree and large out-degree, and the positive assortative mixing among out-degrees. Software collaboration is inherently directed, and any attempt to explain network topologies from software engineering principles or processes without recognizing that asymmetry will most likely fall short.
More work is needed to better abstract and characterize the software development process, and to uncover the implications of that process for large-scale network topology. Lehman’s laws of software evolution and their associated interpretation in the context of feedback and self-regulation Lehman et al. (1997) might form the basis of theories or models aimed at uncovering large-scale structure from small-scale process. Further archaeology of existing software systems would also help us to better understand relationships among network structure, object complexities, object interactions, development processes, and system evolution, and to unravel the differences between class collaboration graphs and call graphs presented here. Systems that have undergone large-scale refactoring could be mined to ascertain whether real-world refactoring processes change the nature of software graphs (as they have in my simple model system), and large open-source development projects such as Linux and AbiWord that have made transitions from the “cathedral” to the “bazaar” Raymond (1999) could be investigated for network-level signatures of such transitions.
Combining insights from empirical studies of existing systems with those gleaned from more abstracted models of software systems – such as the refactoring model presented here – should be more fruitful than either approach in isolation. It would be interesting to learn whether emergent, automatically generated computational systems, such as those uncovered by genetic programming techniques Koza (1992, 1994) or algorithmic chemistries Fontana and Buss (1996), give rise to the sorts of topologies that are observed here. It remains to be seen, however, whether practical insights into the design and development of software can arise from the consideration of software systems as complex networks, more broadly construed.
Software systems present novel perspectives to the study of complex networks. Software is designed to be both functional and evolvable, and those dual needs suggest particular forms of network organization. Whereas other complex networks emphasize redundancy to support fault tolerance, software networks highlight other degrees of freedom that play a central role in supporting evolvability, such as genericity, polymorphism, encapsulation, and collaboration. If those degrees of freedom are relevant to the organization and evolution of biochemical networks, software systems may be useful in suggesting novel insights into collective biological function.
Acknowledgments
This work is supported by the USDA Agricultural Research Service under project 1907-21000-009-04S (Specific Cooperative Agreement 58-1907-9-017). Resources of the Cornell Theory Center (CTC) were used in this research; the CTC receives funding from Cornell University, New York State, federal agencies, foundations, and corporate partners. I would like to thank David Schneider, Sam Cartinhour, Jim Sethna, Josh Waterfall, Kevin Brown, Jon Kleinberg, Shalev Itzkovitz, and Alex Iskold for useful conversations, Maria Nemchuk for writing a web-crawler to extract VTK CVS revision history data, Mel Gorman for making call graph data available and clarifying its construction, and Uri Alon for making his group’s motif finding tool available. I would also like to thank the developers of the many software systems that contributed to this effort: including: VTK, Digital Material, AbiWord, Linux, MySQL, XMMS, Doxygen, Graphviz, CVS, Python, kjbuckets, NumPy, Scientific Python, Grace, and Tulip.
References
- Faloutsos et al. (1999) M. Faloutsos, P. Faloutsos, and C. Faloutsos, ACM SIGCOMM Computer Communication Review 29, 251 (1999).
- Albert et al. (1999) R. Albert, H. Jeong, and A.-L. Barabási, Nature 401, 130 (1999).
- Broder et al. (2000) A. Broder, R. Kumar, F. Maghoul, P. Raghavan, S. Rajagopalan, R. Stata, A. Tomkins, and J. Wiener, WWW9/Computer Networks 33 (2000).
- Newman (2001a) M. E. J. Newman, Phys. Rev. E 64, 016131 (2001a).
- Newman (2001b) M. E. J. Newman, Phys. Rev. E 64, 016132 (2001b).
- Watts and Strogatz (1998) D. J. Watts and S. H. Strogatz, Nature 393, 440 (1998).
- Barabási and Albert (1999) A.-L. Barabási and R. Albert, Science 286, 509 (1999).
- Jeong et al. (2001) H. Jeong, S. Mason, A.-L. Barabási, and Z. N. Oltvai, Nature 411, 41 (2001).
- Jeong et al. (2000) H. Jeong, B. Tombor, R. Albert, Z. N. Oltvai, and A.-L. Barabási, Nature 407, 651 (2000).
- Strogatz (2001) S. H. Strogatz, Nature 410, 268 (2001).
- Barabási (2002) A.-L. Barabási, Linked: The New Science of Networks (Perseus Publishing, Cambridge, MA, 2002).
- Gamma et al. (1994) E. Gamma, R. Helm, R. Johnson, and J. Vlissides, Design Patterns: Elements of Reusable Object-Oriented Software (Addison-Wesley, Reading, MA, 1994).
- Beck (1999) K. Beck, Extreme Programming Explained: Embrace Change (Addison-Wesley, Boston, MA, 1999).
- Raymond (1999) E. Raymond, The Cathedral and the Bazaar: Musings on Linux and Open Source by an Accidental Revolutionary (O’Reilly & Associates, Sebastopol, CA, 1999).
- (15) VTK, eprint www.vtk.org/.
-
(16)
DigitalMaterial,
eprint www.tc.cornell.edu/Research/
Multiscale/DigitalMaterial/. - Myers et al. (1999) C. R. Myers, S. R. Arwade, E. Iesulauro, P. A. Wawrzynek, M. Grigoriu, A. R. Ingraffea, P. R. Dawson, M. P. Miller, and J. P. Sethna, Mat. Res. Soc. Symp. Proc. 538, 508 (1999).
- (18) AbiWord, eprint www.abisource.com/.
- Barabási et al. (2000) A.-L. Barabási, R. Albert, and H. Jeong, Physica A 281, 69 (2000).
- Erdös and Rényi (1960) P. Erdös and A. Rényi, Publ. Math. Inst. Hung. Acad. Sci. 5, 17 (1960).
- Henry and Kafura (1981) S. M. Henry and D. G. Kafura, IEEE Transactions on Software Engineering 7(5), 510 (1981).
- Newman (2002) M. E. J. Newman, Phys. Rev. Lett. 89, 208701 (2002).
- Ravasz et al. (2002) E. Ravasz, A. Somera, D. Mongru, Z. Oltvai, and A.-L. Barabási, Science 297, 1551 (2002).
- Ravasz and Barabási (2003) E. Ravasz and A.-L. Barabási, Phys. Rev. E 67, 026112 (2003).
- Fraser et al. (2002) H. Fraser, A. Hirsh, L. Steinmetz, C. Scharfe, and M. Feldman, Science 296, 750 (2002).
- Henderson-Sellers (1996) B. Henderson-Sellers, Object-Oriented Metrics: Measures of Complexity (Prentice-Hall PTR, Upper Saddle Revier, NJ, 1996).
- Valverde et al. (2002) S. Valverde, R. Ferrer-Cancho, and R. V. Solé, Europhys. Lett. 60, 512 (2002).
- Solé et al. (2002) R. V. Solé, R. Ferrer, J. M. Montoya, and S. Valverde, Complexity 8, 20 (2002).
-
Potanin et al. (2003)
A. Potanin,
J. Noble,
M. Frean, and
R. Biddle,
Scale-free geometry in object-oriented programs
(2003), eprint see
www.mcs.vuw.ac.nz/alex/files/
PotaninNobleFreanBiddleCACM2003.pdf. - Wheeldon and Counsell (2003) R. Wheeldon and S. Counsell, Power law distributions in class relationships (2003), eprint arXiv:cs.SE/0305037.
- Fowler et al. (1999) M. Fowler, K. Beck, J. Brant, W. Opdyke, and D. Roberts, Refactoring: Improving the Design of Existing Code (Addison-Wesley, Reading, MA, 1999).
- Carlson and Doyle (2002) J. M. Carlson and J. C. Doyle, Proc. Nat. Acad. Sci. 99, 2538 (2002).
- Csete and Doyle (2002) M. C. Csete and J. C. Doyle, Science 295, 1664 (2002).
- Lipson et al. (2002) H. Lipson, J. Pollack, and N. Suh, Evolution 56/8, 1549 (2002).
- Seth and Edelman (2003) A. Seth and G. Edelman, in Proceedings of the 23rd Annual Conference of the Center for Nonlinear Dynamical Systems, Los Alamos National Laboratory, NM, USA. (2003).
- Ptashne and Gann (2002) M. Ptashne and A. Gann, Genes & Signals (Cold Spring Harbor Laboratory Press, Cold Spring Harbor, NY, 2002).
- Tononi et al. (1999) G. Tononi, O. Sporns, and G. M. Edelman, Proc. Nat. Acad. Sci. USA 96, 3257 (1999).
- Edelman and Gally (2001) G. M. Edelman and J. A. Gally, Proc. Nat. Acad. Sci. USA 98, 13673 (2001).
- Shen-Orr et al. (2002) S. Shen-Orr, R. Milo, S. Mangan, and U. Alon, Nature Genet. 31, 64 (2002).
- Milo et al. (2002) R. Milo, S. Shen-Orr, S. Itzkovitz, N. Kashtan, D. Chklovskii, and U. Alon, Science 298, 824 (2002).
- Asencio et al. (2002) A. Asencio, S. Cardman, D. Harris, and E. Laderman, in Proceedings of the Ninth Working Conference on Reverse Engineering (IEEE Computer Society, Washington, D.C., 2002), pp. 87–96.
- Lehman et al. (1997) M. Lehman, J. Ramil, P. Wernick, D. Perry, and W. Turski, in Proceedings of the Fourth International Software Metrics Symposium (METRICS 97) (IEEE Computer Society, Washington, D.C., 1997), p. 20.
- Koza (1992) J. Koza, Genetic Programming: On the Programming of Computers by Means of Natural Selection (The MIT Press, Cambridge, MA, 1992).
- Koza (1994) J. Koza, Genetic programming II : automatic discovery of reusable programs (The MIT Press, Cambridge, MA, 1994).
- Fontana and Buss (1996) W. Fontana and L. Buss, in Boundaries and Barriers, edited by J. Casti and A. Karlqvist (Addison-Wesley, 1996), pp. 56–116.
- (46) Doxygen, eprint www.doxygen.org/.
- (47) Graphviz, eprint www.research.att.com/sw/tools/graphviz/.
- (48) CodeViz, eprint www.csn.ul.ie/mel/projects/codeviz/.
- (49) eprint See, www.tc.cornell.edu/myers/Data/SoftwareGraphs.
-
(50)
VTK-CVS-Repository,
eprint
public.kitware.com/cgi-bin/cvsweb.cgi/.
Appendix: Materials and methods
The class collaboration graphs presented here (VTK, Digital Material, AbiWord) are all based on subgraphs generated by Doxygen Doxygen , an automatic document generation tool that parses C++ header files to describe classes, their methods, inheritance, and collaborations. Doxygen generates a set of files describing collaboration graphs in the “dot” format Graphviz , and Doxygen’s definition of collaboration to include inheritance plus association was used for this particular study. Each class collaboration graph is generated independently of all others, so all the subgraphs must be assembled into a global collaboration graph. Some minor typographic changes to class names were required to enable programs in the Graphviz package to process the resulting graph files.
The call graphs (Linux, MySQL, XMMS) were available for download on the Web as demonstration data associated with the CodeViz package, developed by Mel Gorman CodeViz . CodeViz includes patches to the gcc compiler that enable the extraction of static call graphs of functions and macros. As such, CodeViz does not include calls through function pointers, nor does it capture inline functions or naming collisions between functions with the same name in multiple files.
Connected component analysis was done using the ccomps and sccmap tools in the Graphviz package Graphviz , for weak and strong connected component analysis, respectively. As noted, subsequent analyses were carried out on the single, dominant weak connected component found in each system. Graph data and associated information are available online Mye .
The various class metrics for the VTK system presented in section II.5 were extracted as follows. Almost every class in VTK is declared and defined in two separate source files (header .h and implementation .cpp) whose names correspond to the associated class. Two exceptions are inner classes (which are defined within their parent source files, but which are identified by Doxygen as unique classes), and templated classes (which in principle can produce multiple classes emanating from a single pair of source files). They are excluded from the analysis relating class metrics to graph degrees, although they do contribute to the source file sizes of their parent classes (introducing some error to those sizes). The computed source code file size for each class is the sum of the total number of lines of code (including comments and blank lines) in the two source files. The number of methods defined for each class are derived by combining Doxygen information on class methods and the embedded inheritance graph defined for each system. Doxygen documents only those methods defined within a class, which does not include methods inherited from base classes. The inheritance graph is thus traced to add to this list of methods defined for each class those public methods defined by its base classes. Finally, because VTK has been developed within the framework of the CVS source code revision system, information is available describing the revision history of every source file in the system (and hence, for each class in the system, because of the strict mapping of classes to two source files). This CVS revision information is available on the Web VTK-CVS-Repository , which can be crawled and parsed. Any change to either the header or implementation file of a class resulting in a new CVS version number for either of those files was counted as a revision to the class; this, therefore, counts twice any change to a method signature that would necessitate an update to both the header and implementation files, leading to an overestimation of rates, which may or may not be offset by the fact that multiple source revisions could be swept under a single update to the CVS system. From these data, counts of the total number of revisions of each class were generated, and divided by that class’s total lifetime in the CVS repository, to arrive at an average revision rate since inception (expressed as average number of revisions per year). Classes that had been in the CVS repository for less than 3 million seconds (roughly 35 days) were excluded from the analysis, since their short lifetime tended to introduce large errors in the calculation of their revision rates.