Polyelectrolyte Multilayering on a Charged Planar Surface
Abstract
The adsorption of highly oppositely charged flexible polyelectrolytes (PEs) on a charged planar substrate is investigated by means of Monte Carlo (MC) simulations. We study in detail the equilibrium structure of the first few PE layers. The influence of the chain length and of a (extra) non-electrostatic short range attraction between the polycations and the negatively charged substrate is considered. We show that the stability as well as the microstructure of the PE layers are especially sensitive to the strength of this latter interaction. Qualitative agreement is reached with some recent experiments.
I Introduction
PE multilayer structures are often obtained in a so-called layer-by-layer method by alternating exposure of a charged substrate to solutions of polycations (PCs) and polyanions (PAs). This widely used technique was first introduced by Decher and coworkers Decher_1992 ; Decher_1997 , and its simplicity and versatility trigger a large interest in the engineering community. As examples of technological applications, one can mention: biosensing Caruso_Langmuir_1998 , catalysis Onda_1999 , non-linear optical devices Wu_JACS_1999 , nanoparticles coating Caruso_Science_1998 ; Caruso_JPCB_2001 , etc.
On the theoretical side, there exit a few analytical works about PE multilayers on charged planar surfaces based on different levels of approximation Solis_JCP_1999 ; Netz_Macromol_1999b ; Castelnovo_2000 . Solis and Olvera de la Cruz considered the conditions under which the spontaneous formation of polyelectrolyte layered structures can be induced by a charged wall Solis_JCP_1999 . Based on Debye-Hückel approximations for the electrostatic interactions and including some lateral correlations by the consideration of given adsorbed PE structures, Netz and JoannyNetz_Macromol_1999b found a remarkable stability of the (semi-flexible) PE multilayers supported by scaling laws. For weakly charged flexible polyelectrolytes at high ionic strength qualitative agreements between theory Castelnovo_2000 , also based on scaling laws, and experimental observations Ladam_Langmuir_2000 (such as the predicted thickness and net charge of the PE multilayer) have been provided.
The important driving force for all these PE multilayering processes is of electrostatic origin. More precisely, it is based on an overcharging mechanism, where the first layer overcharges the substrate and, along the PE multilayering process, the top layer overcharges the adsorbed PE layers underneath. Nevertheless, the strong correlations existing between oppositely charged polyions, especially for highly charged PEs, provide a formidable challenge for the understanding of the PE multilayer microstructures. In this respect, numerical simulations are of great help. It is only recently, that MC simulations were carried out to study such PE structures built up on spherical charged surfaces Messina_Langmuir_2003 .
In this paper, we provide a detailed study of the PE multilayer structure adsorbed on a charged planar surface and discuss the basic mechanisms that are involved there by means of MC simulations. Our paper is organized as follows: Sec. II is devoted to the description of our MC simulation technique. The measured quantities are specified in Sec. III. The PE monolayering is studied in Sec. IV, and the PE bilayering in Sec. V. Then the PE multilayering process is addressed in Sec. VI. Finally, Sec. VII contains some brief concluding remarks.
II Simulation details
The setup of the system under consideration is similar to that recently investigated with a spherical substrate Messina_Langmuir_2003 . Within the framework of the primitive model we consider a PE solution near a charged hard wall with an implicit solvent (water) of relative dielectric permittivity . This charged substrate located at is characterized by a negative surface bare charge density , where is the (positive) elementary charge and is the number of charges per unit area. Electroneutrality is always ensured by the presence of explicit monovalent () plate’s counterions of diameter . PE chains ( PCs and PAs) are made up of monovalent monomers () of diameter . Hence, all microions are monovalent: . For the sake of simplicity, we only consider here symmetrical complexes where PC and PA chains have the same length and carry the same charge in absolute value.
All these particles making up the system are confined in a box. Periodic conditions are applied in the directions, whereas hard walls are present at (location of the charged plate) and (location of an uncharged wall). To avoid the appearance of image charges Torrie_JCP_1982 ; Messina_image_2002 , we assume that on both parts of the charged plate (at ) the dielectric constants are the same.
The total energy of interaction of the system can be written as
where the first (single) sum stems from the interaction between an ion (located at ) and the charged plate, and the second (double) sum stems from the pair interaction between ions and with . All these contributions to in Eq. (II) are described in detail below.
Excluded volume interactions are modeled via a hardcore potential defined as follows
| (2) |
for the microion-microion one, except for the monomer-monomer one note_HS , and
| (3) |
for the plate-microion one.
The electrostatic energy of interaction between two ions and reads
| (4) |
where +(-) applies to charges of the same (opposite) sign, and is the Bjerrum length corresponding to the distance at which two monovalent ions interact with . The electrostatic energy of interaction between an ion and the (uniformly) charged plate reads
| (5) |
where +(-) applies to positively (negatively) charged ions. An appropriate and efficient modified Lekner sum was utilized to compute the electrostatic interactions with periodicity in two directions Brodka_MolPhys_2002 ; note_Lekner . To link our simulation parameters to experimental units and room temperature (K) we choose Å leading to the Bjerrum length of water Å. The surface charge density of the planar macroion was chosen as .
The polyelectrolyte chain connectivity is modeled by employing a standard FENE potential in good solvent (see, e.g., Kremer_FENE_1993 ), which reads
| (6) |
with and . The excluded volume interaction between chain monomers is taken into account via a purely repulsive Lennard-Jones (LJ) potential given by
| (7) |
where . These parameter values lead to an equilibrium bond length .
An important interaction in PE multilayering is the non-electrostatic short ranged attraction, , between the planar macroion and the PC chain. To include this kind of interaction, we choose without loss of generality a (microscopic) van der Waals (VDW) potential of interaction between the planar macroion and a PC monomer that is given by
| (8) |
where is a positive dimensionless parameter describing the strength of this attraction. Thereby, at contact (i.e., ), the magnitude of the attraction is which is, in fact, the relevant characteristic of this potential. Since it is not straightforward to directly link this strength of adsorption to experimental values, we choose (also considered among other values in the case of a spherical macroion Messina_Langmuir_2003 ), so as to mimic good “anchoring” properties to the planar substrate.
All the simulation parameters are gathered in Table 1. The set of simulated systems can be found in Table 2. The equilibrium properties of our model system were obtained by using standard canonical MC simulations following the Metropolis scheme Metropolis_JCP_1953 ; Allen_book_1987 . Single-particle moves were considered with an acceptance ratio of for the monomers and for the counterions. Typically, about to MC steps per particle were required for equilibration, and about subsequent MC steps were used to perform measurements. To improve the computational efficiency, we omitted the presence of PE counterions when so that the system is still globally electroneutral. We have systematically checked for (system ) that the (average) PE configurations (especially the monomer distribution) are indistinguishable, within the statistical uncertainty, from those where PE counterions are explicitly taken into account, as it should be.
III Measured quantities
We briefly describe the different observables that are going to be measured. In order to characterize the PE adsorption, we compute the monomer density that is normalized as follows
| (9) |
where applies to PCs (PAs). This quantity is of special interest to characterize the degree of ordering in the vicinity of the planar macroion surface.
The total number of accumulated monomers within a distance from the planar macroion is given by
| (10) |
where applies to PCs (PAs). This observable will be addressed in the study of PE monolayer (Sec. IV) and PE bilayer (Sec. V).
Another relevant quantity is the global net fluid charge which is defined as follows
| (11) |
where () stand for the density of all the positive (negative) microions (i.e., monomers and counterions). Thus, corresponds to the net fluid charge per unit area (omitting the bare macroion surface-charge ) within a distance from the charged wall. At the uncharged wall, electroneutrality imposes . By simple application of the Gauss’ law, is directly proportional to the mean electric field at . Therefore can measure the screening strength of the macroion-plate charge by the neighboring solute charged species.
IV Monolayer
In this part, we study the adsorption of PC chains for two chain lengths (system ) and (system ), and for two different couplings and . Experimentally, this would correspond to the formation of the first polyelectrolyte layer. This is a decisive step to elucidate the even more complex PE multilayer structures where additionally PAs are also present.
Here, where (i.e., no polyanions), global electroneutrality is ensured by the presence of explicit PC’s counterions (i.e., monovalent anions) and the macroion-plate’s counterions (i.e., monovalent cations). Also, we recall that the total number of monomers, , is identical for both systems and under consideration (see Table 2). Hence, the total monomer charge is the same for systems and .
The profiles of the monomer density are depicted in Fig. 1. At , the density near contact () is basically independent on the chain size . But away from the surface, the density of monomers is slightly higher for larger . This is a combined effect of (i) entropy and (ii) electrostatic correlations. These underlying mechanisms at can be explained with simple ideas as follows:
-
•
At fixed number of total monomers, entropic effects are larger the shorter the chains, and in the limiting case of (i.e., the electrolyte limit) entropy effects are maximal leading to the highest monomer “release”. It is to say that the chain connectivity lowers the entropy of the system.
-
•
In parallel, electrostatic correlations Shklowskii_PRE_1999b ; Messina_PRE_2001 ; Levin_RepProgPhys_2002 are also higher the higher the valence of the adsorbed particles. In our case plays the role of the polyion valence.
The density near contact increases considerably with (here about one order of magnitude) as expected. It turns out that with , the -profiles are basically identical for and . This is due to the sufficiently strong non-electrostatic attractive force that can overcompensate the antagonistic entropic effects that were more efficient at .
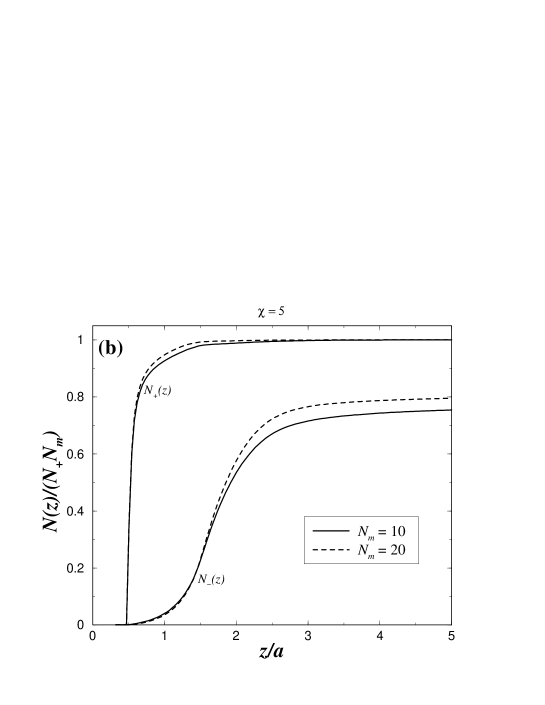
The fraction of adsorbed monomers can be found in Fig. 2. At a -distance of from the planar macroion surface (corresponding to a width of two monomers), about 90% of the monomers are adsorbed for against only for . Again, at given , is larger for longer chains due to the same coupled effects of entropy and electrostatic correlations explained above.
The (global) net fluid charge is reported in Fig. 3. In all cases we observe a macroion-surface charge reversal (i.e., ). The position at which gets its maximal value decreases with , due to the -enhanced adsorption of the PCs. Concomitantly, this overcharging increases with , since the (extra) gain in energy by macroion-monomer VDW interactions can better overcome (the higher ) the cost of the self-energy stemming from the adsorbed excess charge Messina_Langmuir_2003 . More quantitatively, we have at against only at . Note that the maximal value of charge reversal of (i.e., ) allowed by the total charge of PCs can not be reached due to a slight accumulation of microanions. In agreement with the profiles of and (see Fig. 1 and Fig. 2), at given , the overcharging gets higher the higher the chain length. Those (locally) overcharged states should be the driving force for the building of subsequent PE bilayers when PA chains are added.
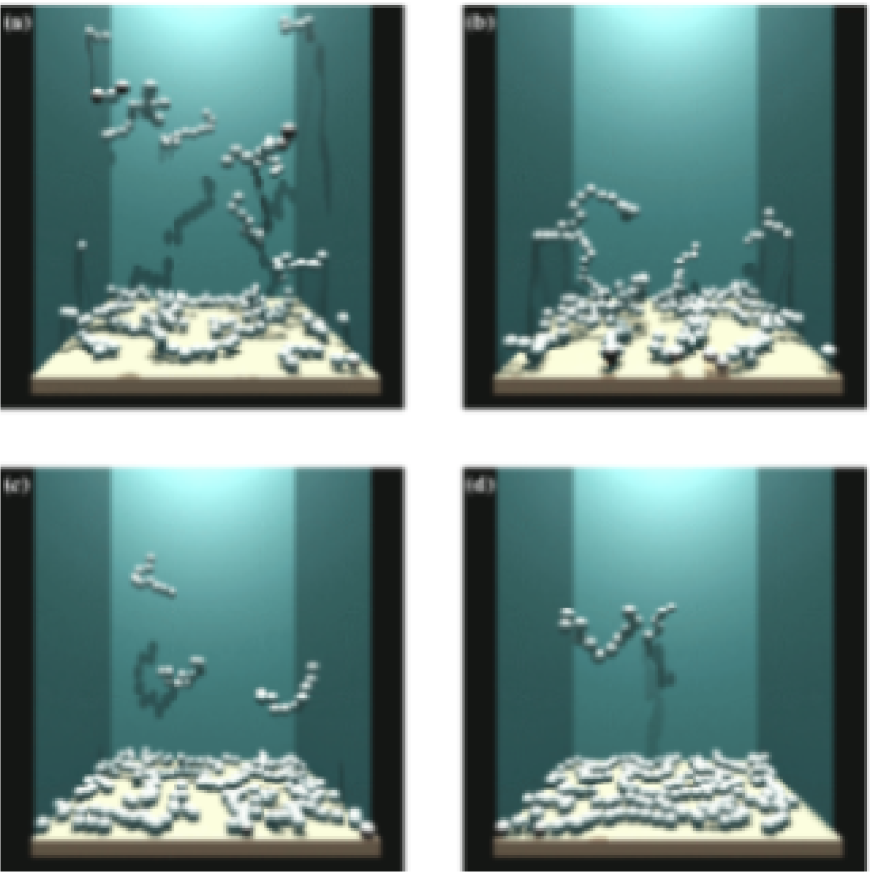
Typical equilibrium configurations can be found in Fig. 4. The qualitative difference between [Figs. 4(a) and (b)] and [Figs. 4(c) and (d)] is rather spectacular. Without additional VDW attraction () the adsorption is much weaker than at , where in the latter situation the -fluctuation is very weak within the adsorbed layer. Basically the first layer is glued at , and the excess PC chains float in the solution. It is typically this type of configurations for the first layer that is wanted in experimental situations.
The next section (Sec. V) that concerns bilayering will show that the (enhanced) stability of this first layer is decisive for the onset of multilayers.
V Bilayer
We now consider the case where additionally PA chains are present (systems and ), so that we have a neutral polyelectrolyte complex (i.e., ). Global electroneutrality is ensured by the counterions of the planar macroion as usual. For such parameters, the final equilibrium structure consists essentially of bilayers with sometimes the onset of a weakly stable third layer. Experimentally this would correspond to the process of the second polyelectrolyte layer formation (with system or as the initial state). We stress the fact that this process is fully reversible for the parameters investigated in our present study. In particular, we checked that the same final equilibrium configuration is obtained either by (i) starting from system or and then adding PAs or (ii) starting directly with the mixture of oppositely charged polyelectrolytes.
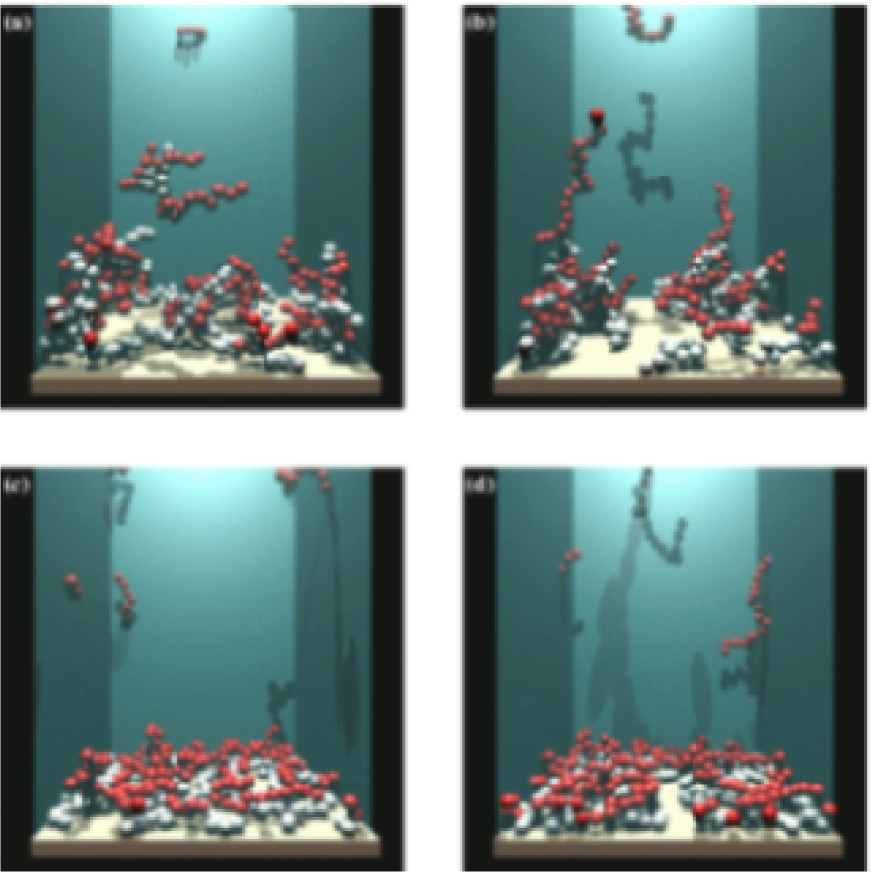
The profiles of the monomer density at and are depicted in Fig. 5(a) and Fig. 5(b), respectively. The corresponding microstructures are sketched in Fig. 6. The density of PC monomers near contact increases considerably with as expected. Interestingly, at , a comparison with systems and (see Fig. 1) indicates that the adsorption of PC monomers is weaker when additional PAs are present. This effect was already observed with spherical substrates Messina_Langmuir_2003 , and the same mechanisms apply here to planar surfaces. More explicitly, the PC chain tends to build up a globular state (reminiscent of the classical bulk PE collapse Hayashi_JCP_2002 ) by getting complexed to the PA chain, as well illustrated in Fig. 6(a) and Fig. 6(b). Thereby, the mean monomer coordination number (or the mean number of monomer neighbors) gets higher which is both (i) entropically and (ii) energetically (at least from the PE complex viewpoint) favorable. This PC desorption is only appreciable at sufficiently low where the energy loss stemming from the PC desorption is well balanced (or even overcompensated depending generally on the parameters) by the energy gained in building a PC-PA globular structure. This “auto-globalization” is also enhanced by increasing as it should be [compare Fig. 6(a) and (b)]. Note also that there is a small second peak in at [see Fig. 5(a)], which is rather the signature of a strong PC-PA globalization than a third PE layer. Besides, the peak in the PA density located at [see Fig. 5(a)], which is relatively far from that of a compact bilayer where , indicates the diffuse character of the bilayer at .
At , the -profiles are basically identical for and . In contrast to , near contact is somewhat larger at and it is going to be explained later in the discussion of . As far as the PA density is concerned, we see that the peak is roughly 2-3 times higher (depending on ) with than with . Also, its position () corresponds to that of a compact bilayer. A visual inspection of Fig. 6(c) and (d) confirms this feature. This again shows how important is the role of extra non-electrostatic attractive force for the stability of bilayers.
An intermediate conclusion can be drawn from the above findings and especially from the microstructures depicted in Fig. 6:
-
•
True bilayering (i.e., flat and dense layers) can only occur at non-zero , as already reported for spherical charged substrates Messina_Langmuir_2003 with large curvature.
An interesting common characteristic of the microstructures at and is the formation of small islands (along the substrate) made up of more or less flat (depending on ) PC-PA complexes, easily identifiable at [see Fig. 6(b) and Fig. 6(d)].
The fraction of adsorbed monomers at and can be found in Fig. 7(a) and (b), respectively. A close look at Fig. 7(a) reveals a smaller PC monomer accumulation (at ) up to (independently of ) than in the case where PA chains were absent (compare with Fig. 2). This is fully consistent with the formation of PC-PA globules (relevant at ) leading to the effective PC desorption already discussed above. In parallel, this PC-PA globalization tends to cancel the effect of chain length on . On the other hand, at , the situation is qualitatively different where the presence of PAs now induces an increase of [compare Fig. 7(b) and Fig. 2]. This phenomenon can be explained by electrostatic correlation effects. Indeed, at , the highly stable PC layer attracts more PA monomers than at , and thereby, ”super” dipoles made of PC-PA monomer pairs build up, that are perceptible in Fig. 6(c) and Fig. 6(d). This leads to a strong attractive correlation interaction between the plate and those dipoles. In other terms the effect of finite is to (strongly) polarize the adsorbed charged chains. Note also that a the PC-PA globalization is much less favorable than at due to the higher cost of PC desorption energy in the former case. As a net effect there can be more adsorbed PC monomers compared to . In that case of , it is precisely this mechanism that tends to cancel the effect of on . As far as the PA monomer fraction is concerned, Fig. 7 shows that the adsorption of monomers is much weaker and more diffuse at than at , as expected from Figs. 5 and 6.
The net fluid charge is reported in Fig. 8. In all cases, the planar macroion gets overcharged and undercharged as one gets away from its surface. That is we have to deal with charge oscillations. Our results clearly show that the amplitude of those oscillations is systematically larger at high , as also observed without PAs (see Fig. 3). This is consistent with the idea that lateral electrostatic correlations are enhanced by increasing the valence of the polyions (here ). Nevertheless, as soon as oppositely charged polyions can interact, there is a subtle interplay between clustering and the lateral correlations of polyions that governs the degree of overcharging near the planar macroion. At , we observe a significantly higher overcharging than without PAs (compare with Fig. 3). This is in agreement with the profiles of discussed previously. However, the positions of the first peak ( for and for ) in remain nearly unchanged by the presence of PAs (compare Fig. 8 with Fig. 3).
VI Multilayer
Presently, we consider the case where there are enough polyelectrolytes () in the system to produce multilayers (systems and ). Hence, compared to systems and , we have now doubled the polyelectrolyte concentration. Global electroneutrality is ensured by the counterions of the planar macroion as usual.
The density profiles of for and are depicted in Fig. 9(a) and Fig. 9(b), respectively. The corresponding microstructures are sketched in Fig. 10. In general, the densities of PC and PA monomers are systematically larger than those found for systems and corresponding to a lower PE concentration. This effect is due to the fact that, at higher concentration of oppositely charged chains, the number of dipoles (i.e., PC-PA monomer pairs) are also larger, and from this it results larger plate-dipole correlations.
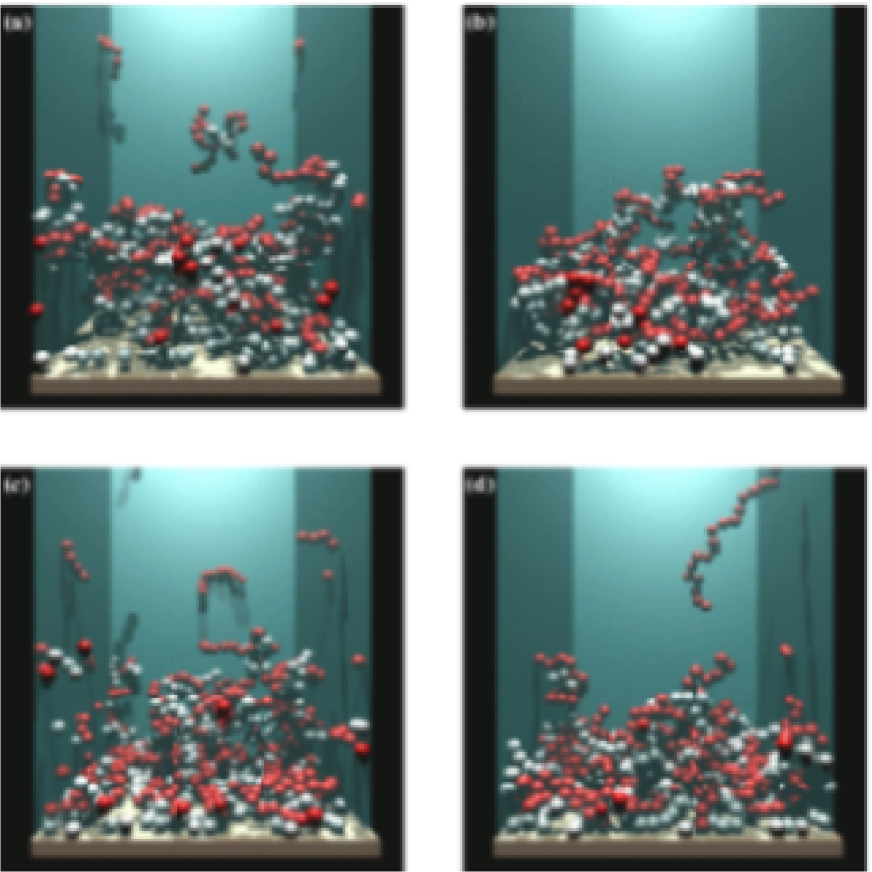
Even at with , we can observe a non-negligible second peak in (located at ) which is the signature of a third layer. This finding contrasts with what was observed at spherical substrates Messina_Langmuir_2003 (also with , , and with a similar macroion surface charge density), where not even a stable bilayer could build up. This radically different behavior can be accounted by geometrical arguments. Indeed, the potential of electrostatic interaction scales like in spherical geometry against in planar one. Hence, at sufficiently high curvature (as it was the case in Ref. Messina_Langmuir_2003 where note_curvature with being the radius of the spherical macroion), qualitative differences from the planar case are then expected. However, the corresponding microstructure [see Fig. 10(a)] suggests a relatively large formation of PC-PA globules leading to a diffuse and porous multilayer. Always at , but with longer chains (), Fig. 9(a) shows that the degree of layering is higher as expected. This feature is well illustrated by Fig. 10(b), where the PA monomers are visibly more attracted to the planar macroion surface.
At , the adsorption of monomers is drastically increased due to the enhanced stability of the first PC layer that, in turn, induces a larger adsorption of the subsequent PAs and PCs. Compared to , all the peaks in are shifted to smaller , indicating a higher compaction. These higher ordering and compaction at can be visually checked in Fig. 10(c) and (d).
The net fluid charge is reported in Fig. 11. As expected charge oscillations are detected. However in all cases, the corresponding amplitude is decaying (as also found in Ref. Messina_Langmuir_2003 for spherical geometry). Compared to the bilayer situation (see Fig. 8), one remarks that the charge oscillations are now larger due to the enhanced “plate-dipole” correlations occurring at higher chain concentrations (as discussed above). On the other hand the positions of the extrema in the charge oscillations remain quasi unchanged.
VII Concluding remarks
We first would like to briefly discuss our findings with some experimental examples. Our results concerning the first layer (i.e., single PC layer) show that an additional non-electrostatic force is needed to enhance its stability. Experimentally, this is achieved by choosing PCs with good ”anchoring” properties to a given substrate. In our model this was done by taking . This being said, the case is from a fundamental point of view interesting, since it corresponds to a purely electrostatic regime.
Recently, Menchaca et al. found, by means of ”liquid-cell AFM”, that PE-complex grains appear at the first PE-layers Perez_CollSurf_2003 . This kind of structure (that we referred to as small islands - see Fig. 6) are confirmed by our simulations. Concomitantly, a significant roughness of the deposited bilayer was also detected in this experiment, which is directly linked to the presence of those grains. This microstructure seems also to be (indirectly) reported in other experiments using ellipsometry Harris_Langmuir_2000 , where it is found that the structure of the two first bilayers are more porous than that of later bilayers. This is also in qualitative agreement with our microstructures depicted in Fig. 6 and Fig. 10. However, more simulation data are needed to understand the PE structure beyond two bilayers.
The degree of charge inversion of the substrate can be indirectly obtained by measuring the -potential via electrophoresis Ladam_Langmuir_2000 . In their experiment, Ladam et al. Ladam_Langmuir_2000 observed that, after a few deposited PE layers note_thickness , the -potential profile is symmetrically oscillating. This reveals a “stationary” regime where, successively, polycations and polyanions are adsorbed with the same strength. Unfortunately, it is not possible for us to investigate numerically this regime due to the highly prohibitive computation time required there. However, the charge oscillations observed in our -profiles indicate that by increasing the amount of layers, one first increases the amplitude of these oscillations. This confirms at least the general experimental evidence of the non-stationary regime a the early stage of PE multilayering.
We also would like to mention the possible effect of image charges stemming from the dielectric discontinuity between the substrate (typically ) and the solvent (here ), as is the case under experimental conditions. It is expected that image forces become especially relevant for PE monolayering (i.e., when PCs solely are present) messina_PE_image . Indeed for multivalent ions, a strong self-image repulsion occurs and leads to a shifted density-profile with a maximum located somewhat further than the contact region Messina_image_2002 ; Torrie_JCP_1982 . However for PE multilayering, due to the presence of oppositely charged PEs the effect of image forces is considerably reduced (especially sufficiently away from the wall) due to the (self-)screening of the image charges.
In summary, we have investigated by means of extensive MC simulations the equilibrium buildup of the few first layers adsorbed on a charged planar substrate. Two parameters were considered: (i) the chain length and (ii) the extra non-electrostatic short-range attraction (characterized here by ) between the planar macroion surface and the polycation chains.
For the bilayering, it was demonstrated that, within the electrostatic regime (i.e., ), significant PC-PA globules build up leading to a very “porous” and diffuse bilayer structure. The PC-PA globalization is enhanced with . At sufficiently large (here ), the bilayer is much less diffuse and the oppositely charged chains are more polarized, leading to a high stability of the structure.
The same qualitatively applies to the case of the two-bilayer (i.e., four PE layers) adsorption. Within this regime of layering as investigated here (up to four layers), we also found a non-linear regime, where for instance the separation of the peaks in the monomer densities are not identical. This is in qualitative agreement with the finding of Ladam et al. Ladam_Langmuir_2000 where they reported a non-linear regime in the so-called “region I” corresponding to the PE multilayer-region close to the buffer note_thickness . The effect of is to globally enhance the stability of the multilayer structure due to the higher electrostatic correlations and also due to entropic effects.
A future study should take into account the rigidity of the chain, which can drastically change the multilayer structure depending the stiffness. The formation of PE multilayers on cylindrical substrates seems also to be a promising research area, and to our knowledge it has never been investigated so far messina_rod .
Acknowledgements.
The author thanks F. Caruso, H. Löwen, S. K. Mayya and E. Pérez for helpful and stimulating discussions.References
- (1) Schmitt, J.; Decher, G.; Hong, G. Thin Solid Films 1992, 210/211, 831.
- (2) Decher, G. Science 1997, 277, 1232.
- (3) Caruso, F.; Furlong, D. N.; Ariga, K.; Ichinose, I.; Kunitake, T. Langmuir 1998, 14, 4559.
- (4) Onda, M.; Ariga, K.; Kunitake, T. Biosci. Bioeng. 1999, 87, 69.
- (5) Wu, A.; Yoo, D.; Lee, J. K.; Rubner, M. F. J. Am. Chem. Soc. 1999, 121, 4883.
- (6) Caruso, F.; Caruso, R. A.; Möhwald, H. Science 1998, 282, 1111.
- (7) Gittins, D. I.; Caruso, F. J. Phys. Chem. B 2001, 105, 6846.
- (8) Solis, F. J.; de la Cruz, M. O. J. Chem. Phys. 1999, 110, 11517.
- (9) Netz, R. R.; Joanny, J. F. Macromolecules 1999, 32, 9013.
- (10) Castelnovo, M.; Joanny, J. F. Langmuir 2000, 16, 7524.
- (11) Ladam, G.; Schaad, P.; Voegel, J. C.; Schaaf, P.; Decher, G.; Cuisinier, F. Langmuir 2000, 16, 1249.
- (12) Messina, R.; Holm, C.; Kremer, K. Langmuir 2003, 19, 4473.
- (13) Messina, R. J. Chem. Phys. 2002, 117, 11062.
- (14) Torrie, G. M.; Valleau, J. P.; Patey, G. N. J. Chem. Phys. 1982, 76, 4615.
- (15) Only the monomer-monomer excluded volume interaction was not modeled by a hard-sphere potential. There, a purely (truncated and shifted) repulsive Lennard-Jones potential was used [see Eq. (7)] so as to be compatible with the FENE potential employed to generate the chain connectivity.
- (16) Grzybowsky, A.; Brodka, A. Molec. Phys. 2002, 100, 1017.
- (17) To further improve the computational efficiency, the corresponding electrostatic energies were initially stored into tables. Bear in mind, that such simulations (despite of this initial storage) involving Lekner sums are extremely time consuming. As an example, the equilibration of system with a satisfactory statistical accuracy requires about one month CPU time with a Pentium4 processor of 2.0 Ghz.
- (18) Kremer, K. Computer Simulation in Chemical Physics; Kluwer Academic Publishers: Amsterdam, 1993.
- (19) Metropolis, N.; Rosenbluth, A. W.; Rosenbluth, M. N.; Teller, A. N.; Teller, E. J. Chem. Phys. 1953, 21, 1087.
- (20) Allen, M. P.; Tildesley, D. J. Computer Simulations of Liquids; Clarendon Press: Oxford, 1987.
- (21) Shklovskii, B. Phys. Rev. E 1999, 60, 5802.
- (22) Messina, R.; Holm, C.; Kremer, K. Phys. Rev. E 2001, 64, 021405.
- (23) Levin, Y. Rep. Prog. Phys. 2002, 65, 1577.
- (24) Hayashi, Y.; Ullner, M.; Linse, P. J. Chem. Phys. 2002, 116, 6836.
- (25) Note that in the opposite limit of low curvature where , the spherical case can be well approximated by a planar interface.
- (26) Menchaca, J. L.; Jachimska, B.; Cuisinier, F.; Pérez, E. Colloids Surf. A 2003, 222, 185.
- (27) Harris, J. J.; Bruening, M. L. Langmuir 2000, 16, 2006.
- (28) Experimentally, Ladam et al. Ladam_Langmuir_2000 reported a linear regime for the PE multilayer thickness as a function of the number of PE layers after the deposition of six PE layers (see also Fig. 4 of Ref. Ladam_Langmuir_2000 ). After a similar number of deposited PE layers, the -potential alternates nearly symmetrically keeping the same absolute value (see Fig. 3 of Ref. Ladam_Langmuir_2000 ).
- (29) Messina R.; manuscript in preparation.
- (30) Messina R.; J. Chem. Phys. 2003, 119, 8133.
TABLES
| Parameters | |
|---|---|
| room temperature | |
| macroion surface charge | |
| microion valence | |
| Å | microion diameter |
| Å | Bjerrum length |
| -box length | |
| -box length | |
| number of PCs | |
| number of PAs | |
| total number of PEs | |
| number of monomers per chain | |
| strength of the specific VDW attraction |
| System | ||||
|---|---|---|---|---|
FIGURE CAPTIONS
-
1.
Profiles of PC monomer-density at different couplings (systems and ). The inset corresponds to where the two curves ( and 20) are nearly indistinguishable.
-
2.
Fraction of adsorbed PC monomers at different couplings (systems and ).
-
3.
Net fluid charge at different couplings (systems and ).
-
4.
Typical equilibrium configurations for PC chains adsorbed onto an oppositely charged planar macroion (systems and ). The little counterions are omitted for clarity. (a) , (b) , (c) , (d) , .
-
5.
Profiles of monomer density for oppositely charged polyelectrolytes (systems and ). (a) . (b) .
-
6.
Typical equilibrium configurations for the adsorption of oppositely charged PE chains (systems and ) onto a planar macroion. The polycations are in white and the polyanions in red. The little ions are omitted for clarity. (a) , (b) , (c) , (d) , .
-
7.
Fraction of adsorbed monomers for oppositely charged polyelectrolytes (systems and ). (a) . (b) .
-
8.
Net fluid charge at different couplings (systems and ).
-
9.
Profiles of monomer density for oppositely charged polyelectrolytes (systems and ). (a) . (b) .
-
10.
Typical equilibrium configurations for the adsorption of oppositely charged PE chains (systems and ) onto a planar macroion. The polycations are in white and the polyanions in red. The little ions are omitted for clarity. (a) , (b) , (c) , (d) , .
-
11.
Net fluid charge at different couplings (systems and ).