Influence of charge ordering on the magnetocaloric effect of (Pr,Ca)MnO3 manganites
Abstract
In the present work we analyze the influence of the charge-ordering on the magnetocaloric effect of Pr1-xCaxMnO3 manganites. The results for the samples with 0.30 present the usual ferromagnetic behavior, peaking at the Curie temperature TC. In contrast, for the samples above the onset concentration for the charge-ordering (0.30), an anomalous magnetic entropy change was observed below the charge-ordering temperature , persisting for lower temperatures. This effect is associated to a positive contribution to the magnetic entropy change due to charge-ordering, which is superimposed to the negative contribution from the spin ordering. We found that the charge-ordering component peaks at and is negligible above . Moreover, around T⋆ (temperature below which the insulator-metal transition induced by magnetic field becomes completely irreversible, where the system remains in such state even after the external magnetic field has been removed), we found extremely large values for the magnetic entropy change, establishing a ‘colossal’ magnetocaloric effect on CMR manganites.
pacs:
75.30.Sg, 75.47.Lx, 75.47.GkI Introduction
The magnetocaloric effect (MCE) is intrinsic to magnetic materials, and is induced via coupling of the magnetic sublattice with the magnetic field, which alters the magnetic part of the total entropy due to a corresponding change of the magnetic field. The MCE can be estimated via the magnetic entropy change , and is a function of both, temperature and the magnetic field change , being usually recorded as a function of temperature, at a constant . In addition, the MCE has a significant technological importance, since magnetic materials with large MCE values could be employed in various thermal devicesPecharsky and Gschneidner (1999).
The magnetic entropy is related to the magnetization , magnetic field strength and absolute temperature through the Maxwell relation Morrish (1965):
| (1) |
which after integration yields:
| (2) |
Hence, can be numerically calculated for any temperature, using Eq.2 and the measured magnetization as a function of magnetic field and temperature. Generally, since temperature stabilization is the longest step in the process of collecting magnetization data, the measurements are usually carried out isothermally by varying the magnetic field, for a range of temperature values.
Several authors, through many decades, have studied the magnetocaloric effect in a large variety of magnetic materials. However, more recently, an enormous amount of work Sun et al. (2002, 2000); Wang et al. (2001); Gu et al. (1998); Zhang et al. (1996); Reis et al. (2002a); Xu et al. (2002); Chen et al. (2000); Mira et al. (2002); Hueso et al. (2002); Morelli et al. (1996); Szewczyk et al. (2000); Guo et al. (1997); Huang et al. (1997); Bohigas et al. (1998, 2000) were devoted to explore the MCE in the mixed-valency manganites AMnO3, where is a trivalent rare-earth mixed with a divalent alkaline-earth.
Particularly interesting as candidates to technological applications are the Pr1-xCaxMnO3 manganites, since their phase diagram exhibit a rich variety of magnetic, electric and crystallographic structures. In this direction, we aim to explore the magnetocaloric effect through the concentration range of phase competition between the antiferromagnetic-insulator-charge-ordered state and ferromagnetic-insulator state, and analyze the influence of the charge ordering on the magnetocaloric properties of these compounds.
Hence, the next section is devoted to a brief survey of the magnetic, electric and crystallographic properties of the Pr1-xCaxMnO3 manganites. Following, the section after is dedicated to the experimental details. In section IV a complete description of the experimental results is given, with a thorough discussion and analysis in the following sections.
II A brief survey
For 0.30 an orthorhombic (c/ab) crystal structure establishes below 950 K, for 0.0, and 325 K, for 0.30, whereas for 0.300.75 the crystal phase arisen is a pseudo-tetragonal compressed (c/a), for temperatures below the onset temperature for the charge-ordering TCO. For high temperatures, the crystal phase is always orthorhombic of type (abc/)Jirák et al. (1985). For 0.30, at low temperatures, a strong crystal phase competition arises between the orthorhombic and the pseudo-tetragonal compressed Jirák et al. (1985).
However, the phase coexistence around 0.30 is not limited to the crystallographic aspects, but a remarkable electric Reis et al. (2003a) and magnetic Tokura et al. (1996); Cox et al. (1998); Frontera et al. (2000); Roy et al. (2000); Hardy et al. (2001); Tomioka et al. (1996); Martin et al. (1999); Renard and Anane (1999); Roy et al. (2001) phase competition can also be found. In this direction, neutron diffraction Cox et al. (1998) and muon spin relaxation (SR) Frontera et al. (2000) recognized, for 0.30, two magnetic transition, around 140 K and 120 K. The first transition, at higher temperature, corresponds to the antiferromagnetic arrangement, and the other represents an ferromagnetic contribution. Hence, two different interpretations are, in principal, possible: two separated magnetic phases with different critical temperatures, or, alternatively, a collinear-antiferromagnetic phase with TN at higher temperature, with an additional magnetic transition to a canted-antiferromagnetic structure, at lower temperature. However, de Gennes de Gennes (1960) stressed out that an uniform canting can be achieved only in the presence of free carriers, i.e., in a metal, whereas the present system is an insulator. Bound carriers would give rise to a local ferromagnetic distortion of the spin system, which would therefore become inhomogeneous de Gennes (1960). In an insulator, the bound electrons would form small ferromagnetic cluster in a antiferromagnetic matrix, and the cluster of spins would then align parallel to each other at TC Cox et al. (1998). Additionally, the presence of the phase boundary between two different crystallographic types ( and ), lead us to conclude that the coexistence of two phases is more probable than a canted-antiferromagnetic structure. Finally, NMR Reis et al. (2003a), SR Frontera et al. (2000) and neutron diffraction Cox et al. (1998); Jirák et al. (1985), add and support our suggestion. Thus, this view will be assumed in the further discussions.
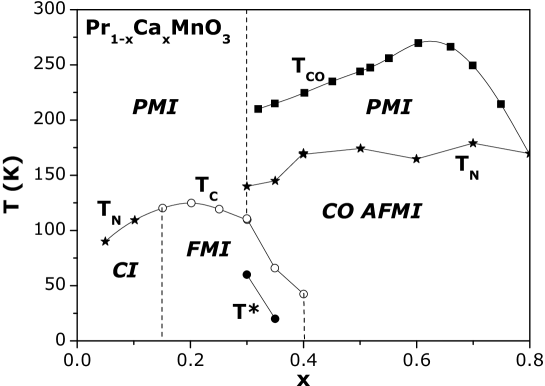
For 0.15, a spin-canted insulator CI phase establishes below 100 K Tomioka et al. (1996); Tokura et al. (1996); Renard and Anane (1999); Jirák et al. (1985), whereas for 0.150.30 a ferromagnetic insulator FMI phase arises, with Curie temperature around 120 K Martin et al. (1999); Tomioka et al. (1996); Tokura et al. (1996); Renard and Anane (1999). For 0.300.80, an antiferromagnetic-insulator AFMI phase arises for temperatures typically below 170 K Jirák et al. (1985); Martin et al. (1999); Tomioka et al. (1996), coexisting with a charge-ordered CO state with onset temperature TCO between 210 K, for x=0.30, and 170 K, for x=0.80 Martin et al. (1999). Additionally, it is well establishedCox et al. (1998); Frontera et al. (2000); Jirák et al. (1985) that the clusters embedded in the antiferromagnetic matrix achieve the ferromagnetic order around 110 K, for 0.30, and 42 K, for Tomioka et al. (1996). In this direction, our recent work using NMR Reis et al. (2003a), gives the ferromagnetic fraction within the antiferromagnetic matrix, as a function of Ca content, .
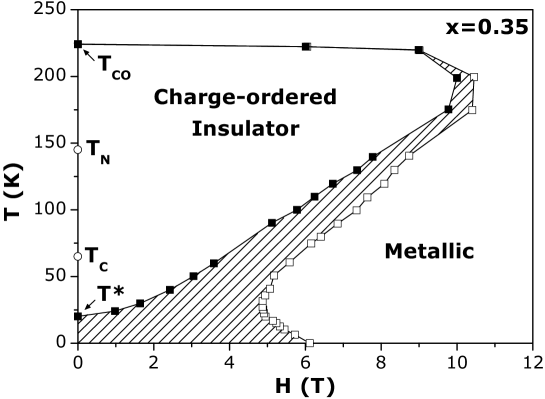
For temperatures below than a characteristic temperature T⋆, ranging from 60 K for 0.30 and 20 K for 0.35 Tomioka et al. (1996), the application of a magnetic field induces a first-order and completely irreversible transition to a fully ferromagnetic-metallic FMM state Tomioka et al. (1995); Tokura et al. (1996); Tomioka et al. (1996); Tokura and Tomioka (1999), where the system remains in such state even after the external magnetic field has been removed. However, for temperature ranges TTTCO, the system return to the insulator state, with hysteresis, after the increase-decreasing magnetic field cycle. The strong hysteresis associated with this transition is indicated by the shaded region in the diagram sketched in figure 1, for 0.35. Additionally, this insulating state can also be driven metallic by an applied electric field Asamitsu et al. (1997); Stankiewicz et al. (2000), high pressure Morimoto et al. (1997), visible light Fiebig et al. (1998); Miyano et al. (1997) or x-ray Kiryukhin et al. (1997); Cox et al. (1998).
However, all values mentioned above are slightly dependent on the sample preparation procedure, and the differences in results can be attributed to the grain size Hueso et al. (2002); Rivas et al. (2000); Levy et al. (2000); Hueso et al. (1998), oxygen content Hueso et al. (1998); Mitchell et al. (1996); Alonso et al. (2000); Ju and Sohn (1997); Trukhanov et al. (2001), vacancy on the lattice Allodi et al. (1998), etc. Additionally, the phase diagram presented here (figure 2), is not completely established, since the magnetic structure for several values of Ca concentration is still a matter of discussion Tokura et al. (1996); Cox et al. (1998); Frontera et al. (2000); Roy et al. (2000); Hardy et al. (2001); Tomioka et al. (1996); Martin et al. (1999); Renard and Anane (1999); Roy et al. (2001).
III Experimental Procedure
The samples 0.20, 0.25, 0.30, 0.32, 0.35 and 0.40, were prepared by the ceramic route, starting from the stoichiometric amount of Pr2O3 (99.9 %), CaCO3 (>99 %) and MnO2 (>99 %), and heated in air, with five intermediate crushing/pressing steps. The final crushed powders were compressed and sintered in air at 1350 C during 45 hours, with a subsequent fast freezing of the samples. X-ray diffraction patterns confirmed that the samples lie in the Pbnm space group, without vestige of spurious phase.
The temperature and external magnetic field dependence of the magnetization were carried out using a commercial SQUID magnetometer. The data were acquired after the sample had been zero-field cooled, under the isothermal regime (M vs. H curves), varying the applied magnetic field from zero up to 50 kOe, and temperature ranges from 10 K up to 400 K. After each M vs. H curve, the sample was heated without the influence of the external magnetic field. For the DC-susceptibility (M/H at low field), the measurements were performed at a fixed magnetic field (H=10 Oe), sweeping the temperature.
IV Results
In this section we will describe the field and temperature dependence of the magnetization M(T,H), since it is one of the best experimental tools to understand the magnetocaloric potential of the system under study.
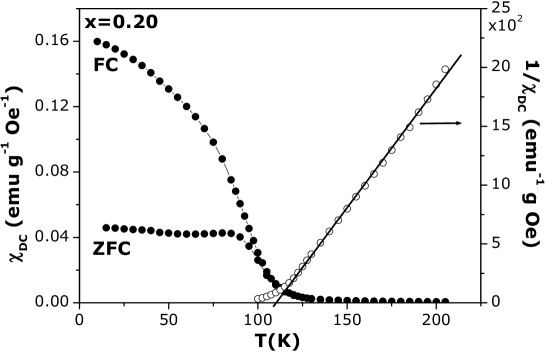
The zero-field-cooled (ZFC) and field-cooled (FC) DC-susceptibility (=M/H, with H=10 Oe), were measured for all samples available. We observed a similar behavior for those below the onset concentration for charge ordering (0.30), with a well defined transition from the paramagnetic to the ferromagnetic phase. While the DC-susceptibility , after field cooling, increase with decreasing temperature, after the sample had been zero-field-cooled, it keeps an almost temperature independence feature. Additionally, from the quantity , we could observe the usual Curie-Weiss law, allowing to estimate the value of the paramagnetic effective moment and the paramagnetic Curie temperature . Thus, figure 3 sketched the behavior above described, representative for all samples 0.30.
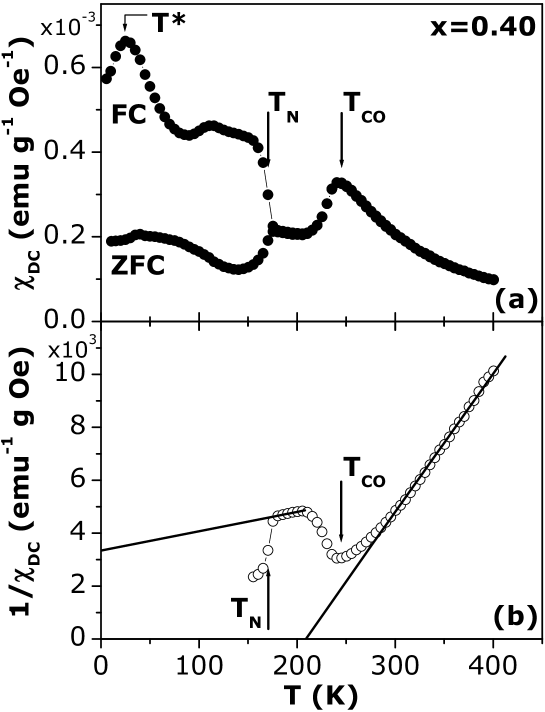
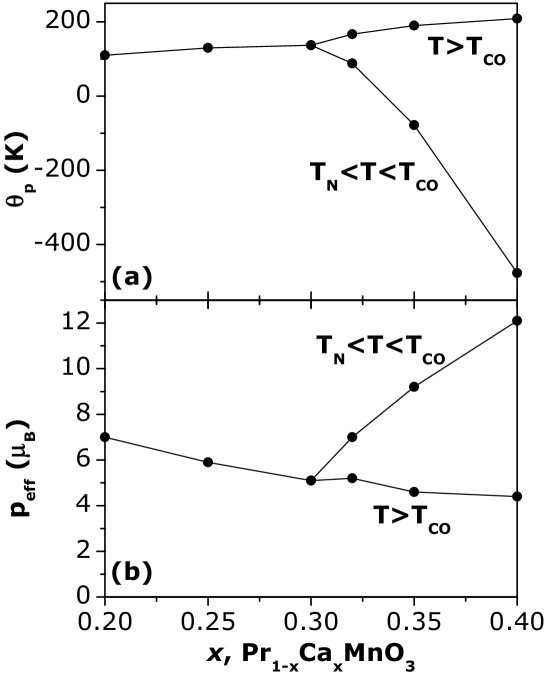
On other hand, for 0.30 the DC-susceptibility change its slope when the sample is cooled down through the CO transition, implying in two different Curie-Weiss law, depending on the temperature range: one for TTCO and other for TTTCO. This behavior, already reported Frontera et al. (2000), is illustrated in figure 4, for 0.40. In addition, a well defined transition from the paramagnetic phase to the antiferromagnetic phase are also observed, as well as the characteristic temperature T⋆, below which the field-induced insulator-metal transition is completely irreversible (see section II). The quantities obtained from the analysis of the DC-susceptibility are summarized on table I. Figure 5 sketched the concentration dependence of (a) the paramagnetic Curie temperature and (b) the paramagnetic effective moment . The two branches curve displayed is consequence of the two Curie-Weiss law found for 0.30.
| T⋆ (K) | TCO (K) | Tcrit (K) | (K) | peff () | |||||
| 0.20 | - | - | 100111Curie temperature | 110 | 7.0 | ||||
| 0.25 | - | - | 120111Curie temperature | 130 | 5.9 | ||||
| 0.30 | - | - | 128111Curie temperature | 137 | 5.1 | ||||
| 0.32 | 26 | 210 | 113222N el temperature |
|
|
||||
| 0.35 | 19 | 222 | 152222N el temperature |
|
|
||||
| 0.40 | 11 | 244 | 170222N el temperature |
|
|
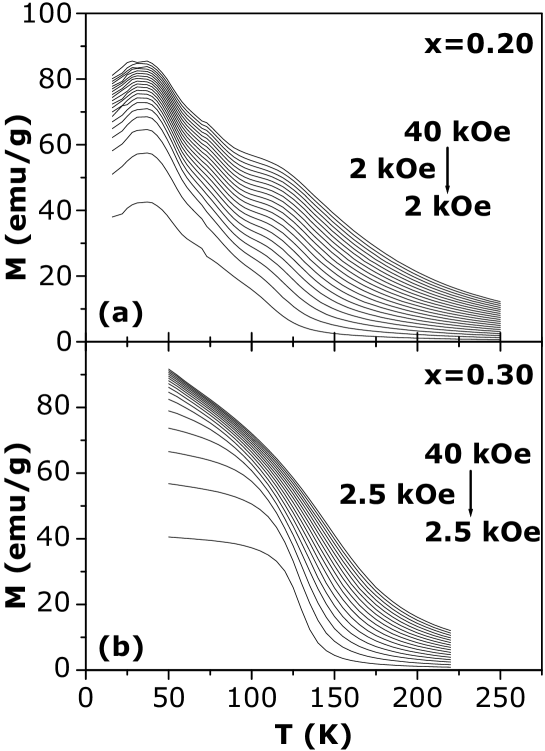
The temperature and field dependence of the magnetization M(T,H) were also measured for all samples. From the data analysis of the several M vs. H isotherms, we could build the curves for the thermal dependence of the magnetization, at a fixed magnetic field. For 0.20, as the temperature is further decreased, one observes that the magnetization starts to increase faster below 100 K, peaking at around 35 K, as displayed in figure 6(a). It can be related to the vicinity of this sample to the onset concentration to spin-canted order (0.15) Tokura et al. (1996); Tomioka et al. (1996). On the other hand, for 0.25 and 0.30 an usual behavior for the thermal dependence of the magnetization is found, as in figure 6(b).
However, for Ca concentration above the onset concentration for charge ordering (0.30), the temperature dependence of the magnetization have interesting features. For 0.32, for instance, the two peaks around 220 K and 130 K correspond to the establishment of the charge ordering and the antiferromagnetic spin ordering, respectively, in accordance with several works Tokura et al. (1996); Tomioka et al. (1996), including those using neutron diffraction Jirák et al. (1985); Lees et al. (1998); Yoshizawa et al. (1995); Cox et al. (1998). As the temperature is further decreased, we can verify a remarkable increasing of the magnetization below 50 K, peaking at around T⋆=26 K, with a subsequent lost of magnetic moment, reaching 40 emu/g at 5 K and 40 kOe. A similar behavior had been found for all samples with 0.30. This features, that can be seen in figure 7 for (a) 0.32 and (b) 0.40, was already observed for 0.37 Hardy et al. (2001).
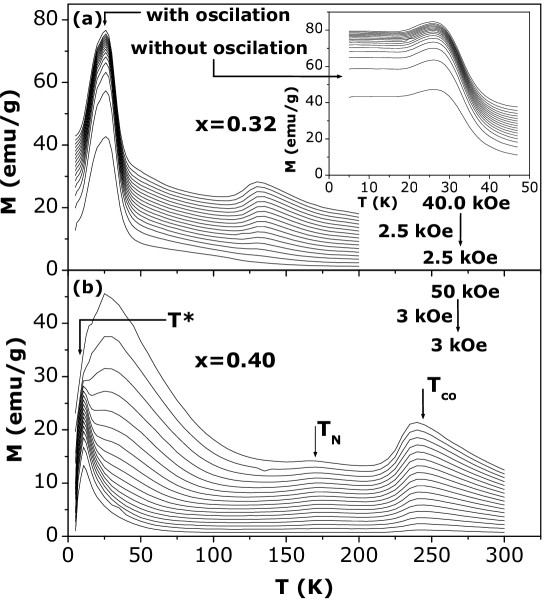
For all measurements, when the magnetic field is turned off, it oscillates around zero field in order to avoid residual field to the next M vs. H curve. If this procedure is not performed, a remarkable difference is found for the magnetization values at low temperatures. The M vs. T curves also peaks around T⋆=26 K, although keeps a high magnetization value for temperature below the peak (80 emu/g for 5 K and 40 kOe). This feature can be seen in the inset of the figure 7(a).
Following, the next section is devoted to analyze the influence of the charge-ordering on the magnetocaloric effect, which will be derived from the magnetization data, using Eq.2.
V Influence of the Charge-Ordering on the Magnetocaloric Effect
In the previous sections, we provided detailed information referred to the magnetic properties of the Pr1-xCaxMnO3 manganites. The aim of this section is the discussion concerning the analysis of the magnetocaloric potential of these manganites, obtained from the previously presented magnetic data.
V.1 MCE around Tcrit
The magnetic entropy change (T) can be estimated using Eq.2, and are sketched in figure 8 for all samples available (0.20; 0.25; 0.30; 0.32; 0.35; 0.40).
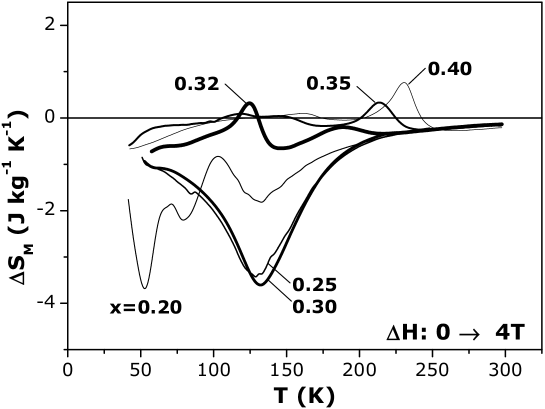
For 0.20, the magnetic entropy change has an usual behavior for temperatures above 100 K, where the magnetization data (figure 6(a)) has also a well shaped feature. However, below 100 K, the magnetization starts to increase faster as the temperature is further decreased, as already discussed in Section IV, and it is possibly related to the closed vicinity of this sample to the spin-canted structure that arise below 0.15 Tomioka et al. (1996); Tokura et al. (1996); Renard and Anane (1999); Jirák et al. (1985) (see figure 2). Thus, the anomalous behavior found for T100 K on the magnetic entropy change of =0.20 can also be explained considering the influence of the spin-canted structure. On the other hand, for 0.25 and 0.30, concentrations completely embedded within the ferromagnetic region, a very usual behavior for are found for both, as sketched in figure 8. We consider, in the case of 0.25 and 0.30, that the contribution to the magnetic entropy change is purely due to the spin magnetic moment of the sample. However, for samples with concentrations above 0.30, the charge-ordering arrangement plays a decisive role. When the temperature is further decreased, the magnetic entropy change follows an usual shape until reach the onset temperature for the charge-ordering , below which such behavior is completely broken, as can be observed in figure 8.
To analyze this intriguingly feature, we consider two different contributions to the total magnetic entropy change : one refers to the spin rearrangement , and the other concerns to the charge ordering rearrangement , as follow:
| (3) |
Thus, considering that the spin contribution to the total magnetic entropy change of 0.30 is almost similar to the purely spin contribution of 0.30, shifted to its Tcrit, we can satisfactorily estimate the charge-ordering contribution. Thus, figure 9 presents the CO and spin contribution to the total magnetic entropy change , for (a)0.32, (b)0.35 and (c)0.40.
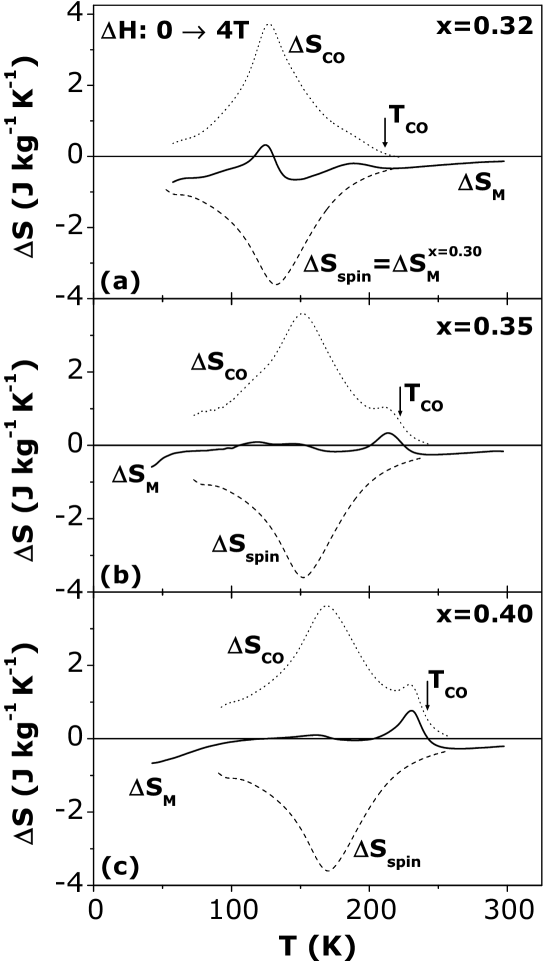
The behavior of the positive charge-ordering contribution, that peaks at TN, can be understood as follow. For TTTCO, i.e., in the paramagnetic phase, the applied magnetic field force a rude alignment of the spins, increasing the Mn3+-Mn4+ electron hopping and decreasing the concentration of Mn3+-Mn4+ charge-ordered, when compared with the zero field case. Consequently, the entropy due the CO increase under an external applied magnetic field, allowing an positive CO entropy change. However, for temperatures immediately below TN, the applied magnetic field favors the increasing of the antiferromagnetic spin arrangement, comparing to the case without field, and, consequently, the decreasing of the Mn3+-Mn4+ electron mobility. Thus, the concentration of Mn3+-Mn4+ charge-ordered increases, implying in the decreasing of the entropy change due the charge-order, under an applied magnetic field.
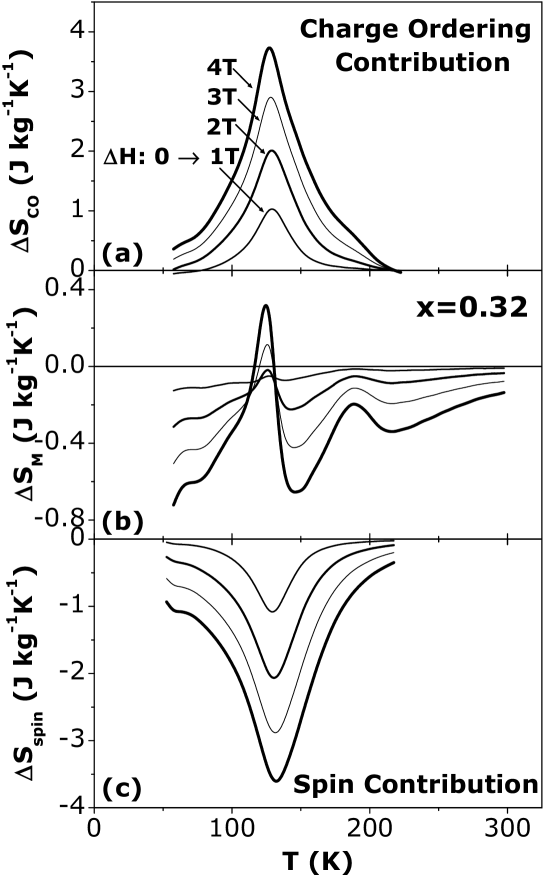
The magnetic entropy change for several values of magnetic field change (H: 0 1; 2; 3 and 4 T) are sketched in figure 10, for 0.32. Both contributions: charge-order (estimated) and spin (0.30), follow the usual magnetic field dependence.
V.2 MCE around T⋆
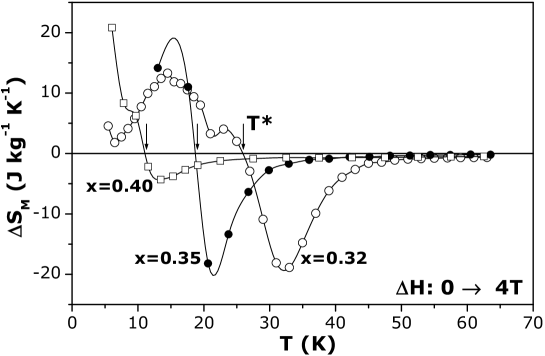
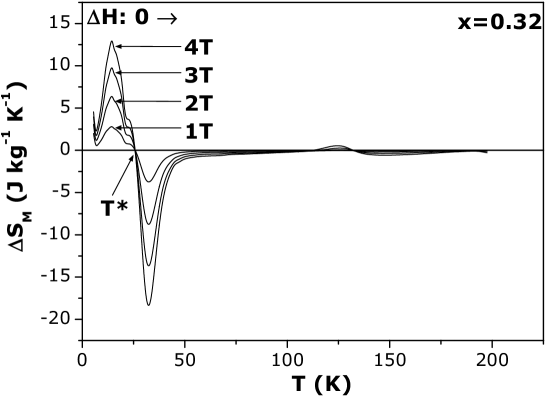
The larger values of magnetic entropy change were obtained around T⋆, where, again, the charge-ordering features found in these manganites plays a decisive role to the MCE (see figure 1). The value of vanishes exactly at T⋆, being highly negative (positive) for higher (lower) temperatures. For 0.32, for instance, reach -19.4 J kg-1 K-1 at 32 K, and 13.4 J kg-1 K-1 at 14 K. Figure 11 sketched these features for 0.32, 0.35 and 0.40, under 4 T of magnetic field change. For the sake of clearness, table II presents the larger values of found in these samples, comparing with reported values of others metals and manganites.
| Material | (J kg-1 K-1) | H (kOe) | TC (K) | Ref. |
|---|---|---|---|---|
| La0.67Ca0.33MnO3 | 6.4 | 30 | 267 | [Sun et al. (2000)] |
| La0.60Y0.07Ca0.33MnO3 | 1.5 | 30 | 230 | [Zhang et al. (1996)] |
| La0.80Ag0.20MnO3 | 3.4 | 30 | 270 | [Tang et al. (2000)] |
| Pr0.60Ca0.40MnO3 | 4.3 | 40 | 13333Around T⋆, instead TC | present work |
| Pr0.65Ca0.35MnO3 | 20.1 | 40 | 21333Around T⋆, instead TC | present work |
| Pr0.68Ca0.32MnO3 | 19.4 | 40 | 32333Around T⋆, instead TC | present work |
| Dy | 19.5 | 65 | 174 | [Foldeaki et al. (1995)] |
| Gd | 7.1 | 30 | 294 | [Dan’kov et al. (1998)] |
| Gd0.73Dy0.27 | 10 | 50 | 265 | [Pecharsky and Gschneidner (1997)] |
| Gd5(Si2Ge2)111Prepared using commercial purity Gd (95-98% pure) | 7 | 50 | 300 | [Gschneidner and Pecharsky (1999)] |
| Gd5(Si2Ge2)222Prepared using high purity Gd (99.8% pure) | 14 | 20 | 276 | [Gschneidner and Pecharsky (1999)] |
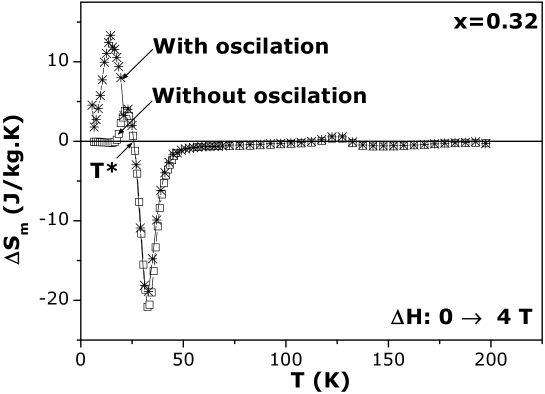
However, the positive below T⋆ can assume different values, depending on the process in which the magnetization data were obtained. As already discussed in section IV, the M vs. T curves, build from several M vs. H curves, have different features depending if the experimental setup performs or not a magnetic field oscillation, around zero field, to avoid residual field on the coils for the next M vs. H curve (see figure 7(a)). Thus, figure 12 presents the magnetic entropy change, under 4 T of magnetic field change and 0.32, with both cases: with and without the oscillating magnetic field. For the last case, the positive is almost suppressed, and this feature are probably related to the metallic state in which is the sample (for TT⋆), since an applied magnetic field induce a completely irreversible insulator-metal transition for temperatures below T⋆, as already discussed in section II.
The temperature dependence of the magnetic entropy change has an usual tendency with respect to several values of magnetic field change, as presented in figure 13, for 0.32 and H:01; 2; 3 and 4 T.
VI Conclusion
In the present work, we found an anomalous magnetic entropy change for 0.30 (concentrations exhibiting charge-ordering phenomenon).The results could be explained considering a spin and charge-ordering contributions to the total magnetic entropy change. Moreover, we found an extremely large value for the entropy variation, that occurs at a characteristic temperature T⋆. Other manganites showing the characteristic temperature T⋆ (see ref. Tokura and Tomioka (1999)), can also present large magnetic entropy change, and, consequently, a great potential to be employed in various thermal devices.
In some previous publications Reis et al. (2002b, c, 2003b) we pointed out that the unusual properties of manganites result from their magnetic non-extensivity, in the sense of Tsallis statistics Tsallis et al. (1998). Such an approach is being applied to the analysis of the present results and will be published elsewhere.
Acknowledgements.
The authors thanks FAPERJ/Brasil, FCT/Portugal (contract POCTI/CTM/35462/99) and ICCTI/CAPES (Portugal-Brasil bilateral cooperation), for financial support.References
- Pecharsky and Gschneidner (1999) V. K. Pecharsky and K. A. Gschneidner, J. Appl. Phys. 86, 565 (1999).
- Morrish (1965) A. H. Morrish, The Physical Principles of Magnetism (Wiley, New York, 1965), chap. 3.
- Sun et al. (2002) Y. Sun, W. Tong, N. Liu, and Y. Zhang, J. Magn. Magn. Mater. 238, 25 (2002).
- Sun et al. (2000) Y. Sun, X. Xu, and Y. Zhang, J. Magn. Magn. Mater. 219, 183 (2000).
- Wang et al. (2001) Z. M. Wang, G. Ni, Q. Y. Xu, H. Sang, and Y. W. Du, J. Appl. Phys. 90, 5689 (2001).
- Gu et al. (1998) G. Gu, J. Cai, W. Yang, and Y. Du, J. Appl. Phys. 84, 3798 (1998).
- Zhang et al. (1996) X. X. Zhang, J. Tajada, Y. Xin, G. F. Sun, K. W. Wong, and X. Bohigas, Appl. Phys. Lett. 69, 3596 (1996).
- Reis et al. (2002a) M. S. Reis, J. C. C. Freitas, M. T. D. Orlando, A. M. Gomes, A. L. Lima, I. S. Oliveira, A. P. Guimaraes, and A. Y. Takeuchi, J. Magn. Magn. Mater. 242, 668 (2002a).
- Xu et al. (2002) Y. Xu, U. Memmert, and U. Hartmann, J. Magn. Magn. Mater. 242, 698 (2002).
- Chen et al. (2000) P. Chen, Y. W. Du, and G. Ni, Europhys. Lett. 52, 589 (2000).
- Mira et al. (2002) J. Mira, J. Rivas, L. E. Hueso, F. Rivadulla, and M. A. López-Quintela, J. Appl. Phys. 91, 8903 (2002).
- Hueso et al. (2002) L. E. Hueso, P. Sande, D. R. Miguéns, J. Rivas, F. Rivadulla, and M. A. López-Quintela, J. Appl. Phys. 91, 9943 (2002).
- Morelli et al. (1996) D. T. Morelli, A. M. Mance, J. V. Mantese, and A. L. Micheli, J. Appl. Phys. 79, 373 (1996).
- Szewczyk et al. (2000) A. Szewczyk, H. Szymczac, A. Wisniewski, K. Piotrowski, R. Kartaszynski, B. Dabrowski, S. Kolesnik, and Z. Bukowski, Appl. Phys. Lett. 77, 1026 (2000).
- Guo et al. (1997) Z. B. Guo, Y. W. Du, J. S. Zhu, H. Huang, W. P. Ding, and D. Feng, Phys. Rev. Lett. 78, 1142 (1997).
- Huang et al. (1997) H. Huang, Z. B. Guo, D. H. Wang, and Y. W. Du, J. Magn. Magn. Mater. 173, 302 (1997).
- Bohigas et al. (1998) X. Bohigas, J. Tejada, E. del Barco, X. X. Zhang, and M. Sales, Appl. Phys. Lett. 73, 390 (1998).
- Bohigas et al. (2000) X. Bohigas, J. Tejada, M. L. Marínez-Sarrión, S. Tripp, and R. Black, J. Magn. Magn. Mater. 208, 85 (2000).
- Jirák et al. (1985) Z. Jirák, S. Krupicka, Z. Simsa, M. Dlouhá, and S. Vratislav, J. Magn. Magn. Mater. 53, 153 (1985).
- Reis et al. (2003a) M. S. Reis, V. S. Amaral, P. B. Tavares, A. M. Gomes, A. Y. Takeuchi, A. P. Guimaraes, I. S. Oliveira, and P. Panissod (2003a), cond-mat/0211143.
- Tokura et al. (1996) Y. Tokura, Y. Tomioka, H. Kuwahara, A. Asamitsu, Y. Moritomo, and M. Kasai, J. Appl. Phys. 79, 5288 (1996).
- Cox et al. (1998) D. E. Cox, P. G. Radaelli, M. Marezio, and S. W. Cheong, Phys. Rev. B 57, 3305 (1998).
- Frontera et al. (2000) C. Frontera, J. L. García-Mu oz, A. Llobet, M. Respaud, J. M. Broto, J. S. Lord, and A. Planes, Phys. Rev. B 62, 3381 (2000).
- Roy et al. (2000) M. Roy, J. F. Mitchell, A. P. Ramirez, and P. Schiffer, Phys. Rev. B 62, 13876 (2000).
- Hardy et al. (2001) V. Hardy, A. Wahl, C. Martin, and C. Simon, Phys. Rev. B 63, 224403 (2001).
- Tomioka et al. (1996) Y. Tomioka, A. Asamitsu, H. Kuwahara, Y. Moritomo, and Y. Tokura, Phys. Rev. B 53, R1689 (1996).
- Martin et al. (1999) C. Martin, A. Maignan, M. Hervieu, and B. Raveau, Phys. Rev. B 60, 12191 (1999).
- Renard and Anane (1999) J. P. Renard and A. Anane, Materials Science and Engineering B 63, 22 (1999).
- Roy et al. (2001) M. Roy, J. F. Mitchell, A. P. Ramirez, and P. Schiffer, Philosophical Magazine B 81, 417 (2001).
- de Gennes (1960) P. G. de Gennes, Phys. Rev. 118, 141 (1960).
- Tomioka et al. (1995) Y. Tomioka, A. Asamitsu, Y. Moritomo, and Y. Tokura, J. Phys. Soc. Jpn. 64, 3626 (1995).
- Tokura and Tomioka (1999) Y. Tokura and Y. Tomioka, J. Magn. Magn. Mater. 200, 1 (1999).
- Asamitsu et al. (1997) A. Asamitsu, Y. Tomioka, H. Kuwahara, and Y. Tokura, Nature 388, 50 (1997).
- Stankiewicz et al. (2000) J. Stankiewicz, J. Sese, J. Garcia, J. Blasco, and C. Rillo, Phys. Rev. B 61, 11236 (2000).
- Morimoto et al. (1997) Y. Morimoto, H. Kuwahara, Y. Tomioka, and Y. Tokura, Phys. Rev. B 55, 7549 (1997).
- Fiebig et al. (1998) M. Fiebig, K. Miyano, Y. Tomioka, and Y. Tokura, Science 280, 12 (1998).
- Miyano et al. (1997) K. Miyano, T. Tanaka, Y. Tomioka, and Y. Tokura, Phys. Rev. Lett. 78, 4257 (1997).
- Kiryukhin et al. (1997) V. Kiryukhin, D. Casa, J. P. Hill, B. Keimer, A. Vigliante, Y. Tomioka, and Y. Tokura, Nature 386, 813 (1997).
- Rivas et al. (2000) J. Rivas, L. E. Hueso, A. Fondado, F. Rivadulla, and M. A. López-Quintela, J. Magn. Magn. Mater. 221, 57 (2000).
- Levy et al. (2000) P. Levy, F. Parisi, G. Polla, D. Vega, G. Leyva, H. Lanza, R. S. Freitas, and L. Ghivelder, Phys. Rev. B 62, 6437 (2000).
- Hueso et al. (1998) L. E. Hueso, F. Rivadulla, R. D. Sánchez, D. Caeiro, C. Jardón, C. Vázquez-Vázquez, J. Rivas, and M. A. López-Quintela, J. Magn. Magn. Mater. 189, 321 (1998).
- Mitchell et al. (1996) J. F. Mitchell, D. N. Argyriou, C. D. Potter, D. G. Hinks, J. D. Jorgensen, and S. D. Bader, Phys. Rev. B 54, 6172 (1996).
- Alonso et al. (2000) J. Alonso, E. Herrero, J. M. Gonzalez-Calbet, M. Vallet-Regi, J. L. Martinez, J. M. Rojo, and A. Hernando, Phys. Rev. B 62, 11328 (2000).
- Ju and Sohn (1997) H. L. Ju and H. Sohn, J. Magn. Magn. Mater. 167, 200 (1997).
- Trukhanov et al. (2001) S. V. Trukhanov, I. O. Troyanchuk, F. P. Korshunov, V. A. Sirenko, H. Szymczak, and K. Baerner, Low Temp. Phys. 27, 283 (2001).
- Allodi et al. (1998) G. Allodi, R. DeRenzi, and G. Guidi, Phys. Rev. B 57, 1024 (1998).
- Lees et al. (1998) M. R. Lees, J. Barratt, G. Balakrishnan, D. M. Paul, and C. Ritter, Phys. Rev. B 58, 8694 (1998).
- Yoshizawa et al. (1995) H. Yoshizawa, H. Kawano, Y. Tomioka, and Y. Tokura, Phys. Rev. B 52, 13145 (1995).
- Tang et al. (2000) T. Tang, K. M. Gu, Q. Q. Cao, D. H. Wang, S. Y. Zhang, and Y. W. Du, J. Magn. Magn. Mater. 222, 110 (2000).
- Foldeaki et al. (1995) M. Foldeaki, R. Chahine, and T. K. Bose, J. Appl. Phys. 77, 3528 (1995).
- Dan’kov et al. (1998) S. Y. Dan’kov, A. M. Tishin, V. K. Pecharsky, and K. A. Gschneidner, Phys. Rev. B 57, 3478 (1998).
- Pecharsky and Gschneidner (1997) V. K. Pecharsky and K. A. Gschneidner, Appl. Phys. Lett. 70, 3299 (1997).
- Gschneidner and Pecharsky (1999) K. A. Gschneidner and V. K. Pecharsky, J. Appl. Phys. 85, 5365 (1999).
- Reis et al. (2002b) M. S. Reis, J. C. C. Freitas, M. T. D. Orlando, E. K. Lenzi, and I. S. Oliveira, Europhys. Lett. 58, 42 (2002b).
- Reis et al. (2002c) M. S. Reis, J. P. Araújo, V. S. Amaral, E. K. Lenzi, and I. S. Oliveira, Phys. Rev. B 66, 134417 (2002c).
- Reis et al. (2003b) M. S. Reis, V. S. Amaral, J. P. Araújo, and I. S. Oliveira, Phys. Rev. B (2003b), in press - available at cond-mat/0301239.
- Tsallis et al. (1998) C. Tsallis, R. S. Mendes, and A. R. Plastino, Physica A 261, 534 (1998).