Antiferromagnetic Vortex Core of Tl2Ba2CuO6+δ Studied by NMR
Abstract
Spatially-resolved NMR is used to probe the magnetism in and around vortex cores of nearly optimally-doped Tl2Ba2CuO6+δ (=85 K). The NMR relaxation rate at 205Tl site provides a direct evidence that the AF spin correlation is significantly enhanced in the vortex core region. In the core region Cu spins show a local AF ordering with moments parallel to the layers at =20 K. Above the core region is in the paramagnetic state which is a reminiscence of the state above the pseudogap temperature (120 K), indicating that the pseudogap disappears within cores.
pacs:
74.20.Rp, 74.25.Fy, 74.25.Jb, 74.70.TxIn high- cuprates (HTC) the superconductivity with -wave symmetry appears when carriers are doped into the antiferromagnetic (AF) Mott insulators. It is well established that the strong AF fluctuation plays a crucial role in determining many physical properties. Therefore the relation between superconductivity and magnetism has been a central issue in the physics of HTC. Especially, how the antiferromagnetism emerges when the -wave superconducting order parameter is suppressed is a fundamental problem in the superconducting state so5 ; sachdev . In this respect, the microscopic structure of vortex core, which is a local normal region created by destroying the superconductivity by magnetic field, turns out to be a very interesting subject.
Within the framework of the semiclassical approximation, in which the electron correlation effects are ignored, vortex cores in -wave superconductors are in the normal metallic state which is same as the state above , similar to -wave superconductors semiclassic . However, recent high resolution STM experiments have revealed many unexpected properties in the spectrum of vortex cores, which are fundamentally different from these semiclassical -wave vortex cores stm . For instance, a checkerboard halo of the local density of states (LDOS) around the core has been reported in Bi2Sr2CaCu2O8+δ hoffman . A new class of theories has pointed out that the strong electron correlation effects change the vortex core structure dramatically. For example, possible competing orders, such as AF AF , staggered flux stag , and stripe sachdev ; stripe orderings in and around cores have been discussed. Therefore it is crucial for gaining an understanding of the vortex state of HTC to clarify how the AF correlation and pseudogap phenomena, which characterize the magnetic excitation in the normal state, appear in and around vortex cores.
Despite extensive studies, little is known about the microscopic electronic structure of the vortices, especially concerning the magnetism. The main reason for this is that STM experiments do not directly reflect the magnetism. Neutron scattering experiments on La2-xSrxCuO4 have reported that an applied magnetic field enhances the AF correlation in the superconducting state lake . However, the relation between the observed AF ordering and the magnetism within vortex cores is not clear, because the neutron experiments lack spatial resolution. Recent SR experiments on underdoped YBa2Cu3O6.5 have reported the presence of static magnetism in vortex core region miller , but the detailed nature of this magnetism is still not clear.
Recent experimental curro ; mitrovic ; kakuyanagi and theoretical takigawa NMR studies have established that the frequency dependence of spin-lattice relaxation rate in the vortex state serves as a probe for the low energy excitation spectrum which can resolve different spatial regions of the vortex lattice. Unfortunately, up to now, all of these spatially-resolved NMR measurements have been carried out at the planar 17O sites curro ; mitrovic ; kakuyanagi , at which the AF fluctuations are filtered due to the location of O-atoms in the middle of neighboring Cu atoms with antiparallel spins masashi .
In this Letter we provide local information on the AF correlation in the different regions of the vortex lattice extending the measurements to the vortex core region, by performing a spatially resolved NMR imaging experiments on 205Tl-nuclei in nearly optimally-doped Tl2Ba2CuO6+δ. This attempt is particularly suitable for the above purpose because at the Tl-site, , can monitor AF fluctuations sensitively. Quite generally, is expressed in terms of the dynamical susceptibility as , where is the nuclear gyromagnetic ratio, is the hyperfine coupling between nuclear and electronic spins, and is the Larmor frequency. Because Tl atoms are located just above the Cu atoms and there exist large transferred hyperfine interactions between Tl nuclei and Cu spin moments through apical oxygen, Tl sees the full wavelength spectrum of Cu magnetic spin fluctuation; is dominated by () at , i.e. AF fluctuations. This should be contrasted to the O-sites at which () is dominated by uniform fluctuations at .
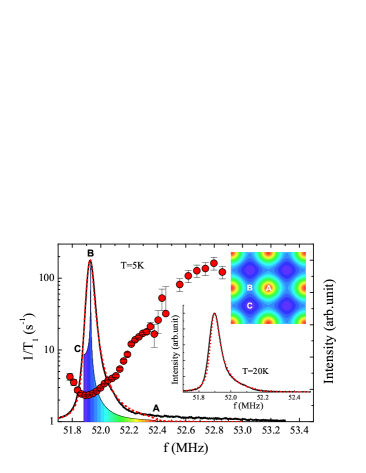
NMR measurements were carried out on the -axis oriented polycrystalline powder of high quality Tl2Ba2CuO6+δ (=85 K) in the external field (=2.1 T) along the -axis. The 205Tl spin echo signals were obtained by a pulse NMR spectrometer. The spectra was obtained by convolution of the respective Fourier-transform-spectra of the spin echo signals measured with an increment of 50 kHz. A very sharp spectrum ( 50 kHz) above becomes broad below due to the development of vortices. The solid lines in Fig. 1 and lower inset depict the NMR spectra at 5 K and 20 K, respectively. A clear asymmetric pattern of the NMR spectrum, which originates from the local field distribution associated with the vortex lattice is observed below the vortex lattice melting temperature (60 K at ) FCC . The local field profile in the vortex state is given by approximating with the London result,
| (1) |
where is a reciprocal vector of the vortex lattice, the distance from the center of the core, the in-plane coherence length, and the in-plane penetration length. The thin solid lines in Fig. 1 depicts the histogram at a particular local field which is given by the local field distribution in Eq.(1) assuming the square vortex lattice, where is the magnetic unit cell. The upper inset shows the image of the field distribution in the vortex lattice. In the prefect vortex lattice and without magnetism within cores which will be discussed later, the histogram shows the low and high frequency cutoffs at the center of the vortex lattice (C-point) and at the center of cores (A-point), respectively, and shows a peak at the field corresponding to the saddle point (B-point). This characteristic spectrum (Redfield pattern) demonstrates that the NMR frequency depends on the position of the vortex lattice. We therefore can obtain the spatially-resolved information of the low energy excitation by analyzing the frequency distribution of the corresponding NMR spectrum.
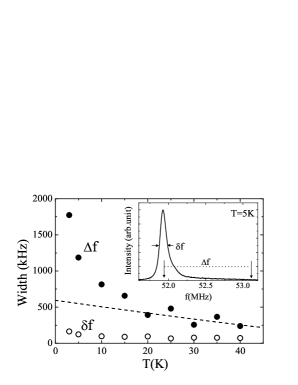
We first discuss the observed NMR spectra. The real spectrum broadens due to the imperfect orientation of the power and distortion of the vortex lattice. The red dotted lines in Fig. 1 and the lower inset represent the simulation spectra in which the Lorentzian broadening function, , is convoluted to Redfield pattern using =42 kHz. The theoretical curve reproduces the data well in the whole frequency range at =20 K (inset). On the other hand, the spectrum at 5 K shows significant broadening at high frequency region (core region), while it can be well fitted below 52.1 MHz (main panel). The filled circles in Fig. 2 display the line width at the high frequency tail, , which is defined as a difference between the frequency at the peak intensity and the frequency at which the intensity becomes 1% of the peak. For the comparison, the line width calculated from the simulation spectra with Lorentzian broadening function is plotted by the dashed line. At high temperatures agrees well with the calculation, while below 20 K it becomes much larger. We also plot which represents the line width at the half intensity (open circles). The fact that changes little below 20 K confirms that the line broadening occurs only in the high frequency core region. In SR experiments, the high frequency tail was attributed to the static magnetism around cores, which causes additional broadening miller . It should be noted that because of large transfer hyperfine coupling between Tl nuclei and Cu moment, the broadening of Tl-NMR spectrum associated with the static magnetism is more pronounced than that of SR spectrum. Therefore the observed broadening below 20 K is naturally explained by the appearance of static magnetism within cores below 20 K. To obtain deep insight into this phenomena, the measurements of are crucial.
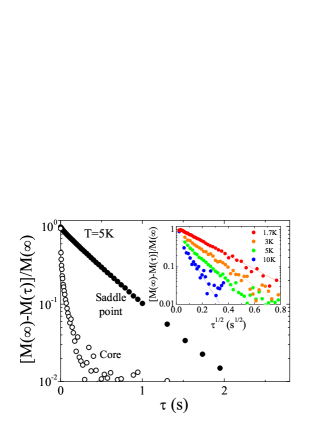
For 205Tl with nuclear spin =1/2, the recovery curve of the nuclear magnetization fits well to a single exponential relation, in the normal state. In the vortex state, on the other hand, the feature of the recovery curves is strongly position dependent as shown in Fig. 3. The spin echo intensities are measured as a function of after saturation pulses. Then the nuclear magnetization recovery curves are obtained from each frequency component of the Fourier transform spectra. We obtained the data set of the recovery intensity for each frequency point at the 28 kHz interval with a gaussian weight function of =10 kHz. There are two distinct features. First, the decay time at cores is much faster than at saddle points. Second, while the recovery curves show the single exponential at the saddle point, they show a dependence at the core region as shown in the inset of Fig. 3. We will discuss this dependence later. In what follows, we defined as the time required for the nuclear magnetization to decay by a factor 1/, in order to define uniquely for either decay curve.
The red filled circles in Fig. 1 show the frequency dependence of . On scanning from outside into cores, increases rapidly after showing a minimum near saddle points. The magnitude of in the core region is almost two orders of magnitude larger than that near saddle point. This large enhancement of is in striking contrast to at 17O sites reported in YBa2Cu3O7 curro ; mitrovic and YBa2Cu4O8 kakuyanagi , in which the enhancement of at the core region is 2-3 times at most and has been attributed to LDOS produced by a Doppler shift of the QP energy spectrum by supercurrents around the vortices volovik . It should be noted that the LDOS effect is absent in , because there are no conduction electrons at 205Tl-site. Therefore, the remarkable enhancement of provides a direct evidence that the AF correlation is strongly enhanced near the vortex core region vib . The decrease of well outside the core when going from point C to B was also reported in mitrovic ; kakuyanagi .
Figures 4 (a) and (b) depict the -dependences of and within cores (filled circles) and at the frequency corresponding to saddle points (open circles), respectively. In these figures, within cores, , were determined with using integrated intensities over the high frequency region beyond the A point. From high temperatures down to about 120 K, obeys the Curie-Weiss law, . The lowest at which this law holds is conveniently called the pseudogap temperature . Below , decreases rapidly without showing any anomaly associated with the superconducting transition at , similar to other HTC masashi .
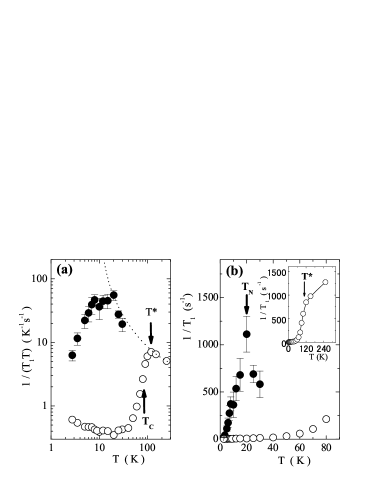
The -dependence of contains some key features for understanding the core magnetism. The first important signature is that exhibits a sharp peak at =20 K, which we label as for future reference (Fig. 4(a)). Below decreases rapidly with decreasing . There are two possible origins for this peak. One is the reappearance of the pseudogap and the other is the occurrence of a local static AF (or SDW) ordering in the core region. Generally shows a sharp peak when the AF ordering occurs. The fact that the sharp peak of is observed at while at the saddle points shows neither a peak nor broad maximum at * as shown in the inset of Fig. 4(b) excludes the possibility of pseudogap, supporting the AF ordering. Moreover, as shown in Fig. 2, broadening of the NMR spectrum starts at 20 K, which coincides with . This fact gives an additional strong evidence on AF ordering. We also point out that the appearance of the local AF ordering is also consistent with the dependent nuclear magnetization decay curve shown in the inset of Fig. 3. In fact, the dependence has been observed when the microscopic imhomogeneous distribution of due to strong magnetic scattering centers is present sil . On basis of these results, we are lead to conclude that the local AF ordering takes place in the core region at =20 K; corresponds to the Néel temperature within the core. This AF ordering is consistent with the prediction of recent theories based on the and SO(5) models AF . The present results also should be distinguished from those of the neutron scattering experiments on La2-xSrxCuO4 lake , in which the static SDW coexists with superconductivity even in zero field just below . In the present compound, on the other hand, we do not observe such a static SDW ordering and the vortex core region is in the paramagnetic state in a wide -region between and .
As discussed before, the broadening occurs only at high frequencies. This fact indicates that the AF spins are oriented parallel to the CuO2 layers. This follows by observing that the broadening should occur at both high and low frequency sides if the AF ordering occurs perpendicular to the layers, because in this case the direction of the alternating transferred hyperfine fields are parallel and antiparallel to the applied field. Using the hyperfine coupling constant, = 65kOe/, the magnetic moments induced within the core is estimated to be 0.1 at . The detailed analysis will be published in elsewhere.
The second important signature for the core magnetism is that, as shown by the dotted line in Fig. 4(a), above nearly lies on the Curie-Weiss law line extrapolated above . This fact indicates that the vortex core region appears to be in the paramagnetic state which is a reminiscence of the state above ; the pseudogap is absent in the core region. This result seems to be inconsistent with the recent theories which predict local orbital currents, in which the pseudogap phenomenon within cores is assumed AF .
Summarizing the salient features of spatially-resolved NMR results in the vortex lattice;(1) NMR spectrum near the core region broadens below =20 K (Figs. 1 and 2). (2) Upon approaching the vortex core, is strongly enhanced (Fig. 1). (3) Near the core region, the NMR recovery curves show the -dependence (Fig. 3). (4) exhibits a sharp peak at =20 K (Fig. 4), All of these results provide direct evidence that in the vortex core region the AF spin correlation is extremely enhanced, and that the paramagnetic-AF ordering transition of the Cu spins takes place at K. We also find the pseudogap disappears within the core. The present results offer a new perspective on how the AF vortex core competes with the -wave superconductivity.
We acknowledge helpful discussions with M. Franz, M. Imada, J. Kishine, K. Machida, D.K. Morr, M. Ogata, S.H. Pan, M. Takigawa, A. Tanaka, Z. Tesanović, and O.M. Vyaselev.
References
- (1) S.C. Zhang, Science 275, 1089(1997)
- (2) Y. Zhang, E. Demler, and S. Sachdev, Phys. Rev. B. 66, 094501 (2001) and references therein.
- (3) N. Schopohl, and K. Maki, Phys. Rev. B 52, 490 (1995), M. Ichioka, et al. Phys. Rev. B 53, 15316 (1996).
- (4) I. Maggio-Aprile, et al. Phys. Rev. Lett. 75, 2754 (1995), S.H. Pan,et al. ibid 85, 1536 (2000).
- (5) J.E. Hoffman et al., Science 295, 466 (2002).
- (6) D.P. Arovas, et al. Phys. Rev. Lett. 79, 2871 (1997), J.H. Han and D.H. Lee, ibid. 85, 1100 (2000), Jian-Xin Zhu and C. S. Ting, ibid 87, 147002 (2001), Jian-Xin Zhu, et al. ibid. 89, 067003 (2002), M. Ogata, Int. J. Mod. Phys. B 13, 3560 (1999), H. Tsuchiura et al. cond-mat/0302030.
- (7) J. Kishine et al., P.A. Lee PA, X.G. Wen, Phys. Rev. Lett. 86, 5365 (2001), Q.H. Wang et al. ibid. 87, 167004 (2001).
- (8) M. Takigawa et al. Phys. Rev. Lett. 90, 047001 (2003).
- (9) B. Lake,et al. Science 291, 1759 (2001), B. Lake, et al. Nature, 415, 299 (2002), B. Khaykovich et al. Phys. Rev. B 66, 014528 (2002).
- (10) R.I.Miller et al. Phys. Rev. Lett. 88 137002, (2002).
- (11) N.J. Curro, et al. Phys. Rev. B 62, 3473 (2000).
- (12) V. F. Mitrovic, et al., Nature 413, 501 (2001), V. F. Mitrovic, et al. cond-mat/0202368
- (13) K. Kakuyanagi et al., Phys. Rev. B 65, 060503 (2002).
- (14) M. Takigawa et al., Phys. Rev. Lett. 83, 3057 (1999), R. Wortis et al. Phys. Rev. B 61, 12342 (2000), D.K. Morr and R. Wortis, Phys. Rev. B 61, R882 (2000), and D.K. Morr, Phys. Rev. B 63, 214509 (2001), Y. Chenet al. cond-mat/0302114
- (15) V. Barzykin and D. Pines Phys. Rev. B 52, 13585 (1995).
- (16) We stress the importance of the measurements under field cooling condition in the vortex lattice phase to observe the asymmetric field profile.
- (17) G.E. Volovik, JETP Lett. 58, 469 (1993).
- (18) We note that is two orders of magnitude larger than that expected solely from vortex vibration at all temperatures (see Fig. 2 in Ref.VV ).
- (19) L.N. Bulaevskii et al. Phys. Rev. Lett. 71, 1891 (1993).
- (20) M.R. McHenry et al., Phys.Rev. B5, 2958 (1972).