Coherent Dynamics of a Josephson Charge Qubit
Abstract
We have fabricated a Josephson charge qubit by capacitively coupling a single-Cooper-pair box (SCB) to an electrometer based upon a single-electron transistor configured for radio-frequency readout (RF-SET). Charge quantization of is observed and microwave spectroscopy is used to extract the Josephson and charging energies of the box. We perform coherent manipulation of the SCB by using very fast DC pulses and observe quantum oscillations in time of the charge that persist to . The observed contrast of the oscillations is high and agrees with that expected from the finite ratio and finite rise-time of the DC pulses. In addition, we are able to demonstrate nearly initial charge state polarization. We also present a method to determine the relaxation time when it is shorter than the measurement time .
Although a large number of physical systems have been suggested as potential implementations of qubits, solid state systems are attractive in that they offer a realistic possibility of scaling to a large number of interacting qubits. Recently there has been considerable experimental progress using superconducting microelectronic circuits to construct artificial two-level systems. A variety of relative Josephson and Coloumb energy scales have been used to construct qubits based upon a single-Cooper-pair box Nakamura et al. (1999); Vion et al. (2002) and flux qubits based upon a 3-junction loop van der Wal et al. (2000); Chiorescu et al. (2003). Coherence times of the order of 0.5 microseconds have been achieved for a single-Cooper-pair box qubitVion et al. (2002). Rabi oscillations between energy levels of a single large tunnel junction have also been observed Yu et al. (2002); Martinis et al. (2002). Despite the encouraging results, one aspect that is not well understood concerns the contrast of the oscillations, which in all previously reported experiments is smaller than expected.
The experimental systems reported so far can also be distinguished by the readout method and the manner of performing single qubit rotations. The first demonstration of coherent control of a single-Cooper-pair box (SCB) Nakamura et al. (1999) employed a weakly coupled probe junction to determine the charge on the island. In the more recent experiment reported by Vion et al.Vion et al. (2002), the SCB was incorporated into a loop containing a large tunnel junction, for which the switching current depends on the state of the SCB. Switching current measurements of SQUIDS have also been used for flux and phase-type qubitsvan der Wal et al. (2000); Chiorescu et al. (2003); Yu et al. (2002); Martinis et al. (2002). Nakamura et al.Nakamura et al. (1999) performed single qubit rotations by applying very fast DC pulses to a gate lead in order to quickly move the SCB into, and away from the charge degeneracy point. This technique produces qubit rotations with an operation time that can be of the order of the natural oscillation period. Other experiments utilize microwave pulses to perform NMR-like rotations of the qubit Vion et al. (2002); Yu et al. (2002); Martinis et al. (2002); Chiorescu et al. (2003). The latter approach requires less stringent microwave engineering, since RF-rotations can be accomplished with pulses that are more than order of magnitude slower in rise time and duration than the natural oscillation period. By using fast pulses, however, single qubit rotations can be performed approximately 20 times faster than with RF-rotations.
In this letter, we report measurements made on a SCB-type qubit with very fast DC pulses used to effect the qubit rotations, as in Nakamura et al.Nakamura et al. (1999). For our qubit, however, the readout system consists of a single-electron-transistor (SET) capacitively coupled to the SCB and configured for radio-frequency readout (RF-SET). By incorporating a SET into a tank circuit, RF-SET electrometers can be made that are both fastSchoelkopf et al. (1998) and sensitiveAassime et al. (2001), and are well-suited for SCB-qubit readoutAassime et al. (2001); Lehnert et al. (2003). One advantage of using RF-SET readout is that it can easily be turned on and off, although for the measurements reported here it is operated in a continuousLehnert et al. (2003). More significanly, the RF-SET is fundamentally different from qubit readout based on swithing currents in that it involves a weak measurement of the charge in contrast to a yes or no answer. This could be a significant advantage for readout of multiple qubit systems. For example, a switching current measurement on one qubit would also directly affect the other qubits due to its strong interaction. Furthermore, switching current measurements are inherently stochastic in time—an important consideration if one is interested in measuring time correlations.
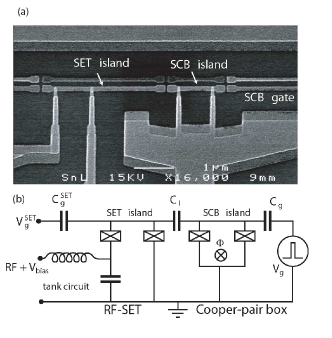
Electron beam lithography and double-angle shadow evaporation of aluminum films onto an oxidized silicon substrate were used to fabricate the combined SCB-SET system (see Fig. 1)Bladh et al. (2002). The SCB box consists of a low-capacitance superconducting island connected to a superconducting reservoir by two parallel junctions that define a low-inductance SQUID loop. An additional gate lead placed near the island is used to change the electrostatic potential of the island by a gate voltage through a gate capacitance . By adjusting the magnetic flux through the loop, the effective Josephson energy is tunable as , where is the magnetic flux quantum (). Coupling of the SCB to the SET was accomplished by extending part of the SET island to the proximity of the box island and resulted in a weak dimensionless coupling, of for samples with slightly different geometries and total SCB capacitances . is the capacitance between the SCB and SET islands.
The samples were placed at the mixing chamber of a dilution refrigerator with a base temperature of approximately 20mK. An external superconducting magnet was used to produce a large field parallel to the plane of the samples and a small superconducting coil close to the sample was used to produce a field perpendicular to the SQUID loop. This allowed us to independently suppress the superconducting gap of the aluminum film, and change the effective Josephson energy of the Cooper-pair box. All control lines were filtered by a combination of low-pass and stainless steel and copper-powder filters. To present sharp pulses to the SCB gate, a high frequency coaxial line was used having dB attenuation at K and dB at K. The tank circuit had a resonant frequency of MHz and the RF-SET electrometer was biased near a feature in the versus landscape known as the double Josephson quasi-particle peak (DJQP) Clerk et al. (2001), such that the bias current through the SET was typically 200-300pA. Under these conditions, the electrometer sensitivity for the combined SCB-SET system was found to be 50 with a bandwidth of 10MHz.
To make an artificial two-level system, the energy scales of the SCB must be chosen so that , where is the energy cost required to add a single electron to the island and is set by total capacitance of the island . If is large enough compared to , then the ground states will be even parity states that differ only by the average number of Cooper-pairs on the island. The effective Hamiltonian of the box, including the Josephson coupling, is given by
| (1) |
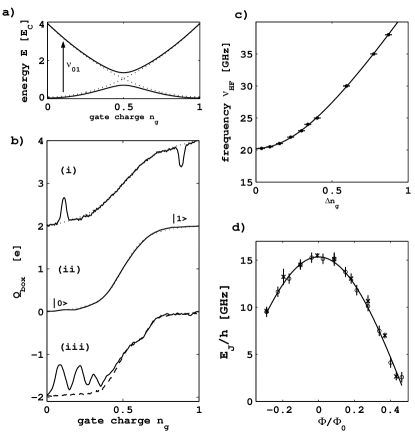
where we define gate charge as , and is the offset charge due to stray charges near the box. Fig. 2(a) shows the ground state and first excited state energy bands calculated using the Hamiltonian in Eqn.(1). On account of the periodicity of the system, we limit the discussion to gate charge .
In thermodynamic equilibrium, the actual quantity that determines the island parity is the even-odd free energy difference , which differs from due to entropic considerations.Lafarge et al. (1993). Measurements were made for several different samples with Coulomb enegies ranging from 0.43 to 1.65 (9-34GHz) and ratios of 0.4 to 2.25. Coloumb staircases were measured by slowly ramping the box gate charge (at a rate of ), and measuring the power reflected from the RF-SET tank circuit. Examples of the measured box charge is shown in Fig. 2b. Our samples show periodicity when , well below the gap K. For samples with larger , the staircases acquire an extra step around due to poisoning by non-equilibrium quasiparticles.
The characteristic energies and of the SCB can be determined directly using microwave spectroscopyLehnert et al. (2003). When monochromatic microwaves are applied to the SCB gate, resonant peaks and dips occur in the measured vs staircase when the microwave photon energy matches the energy level splitting (see Fig. 2(b)). As the microwave frequency is reduced, the positions of these peaks exhibit an avoided level crossing. Within the two-level approximation, the positions of the single-photon resonances depend on the applied frequency as where we used . An example of such an avoided level crossing is shown in Fig 2(c) where we have used least-squares fits to this equation to estimate the Coloumb and Josephson energies.
Measurements of time-resolved, coherent oscillations of the charge on the SCB are made by slowly ramping the SCB gate charge as before, while applying fast (non-adiabatic) rectangular DC-voltage pulses of amplitude in the form of a pulse train to the SCB gate. When is far away from the charge degeneracy, and such that places the system at the charge degeneracy, the leading and trailing edges of each pulse act as successive Hadamard transformations. In between, the system coherently oscillates between charge eigenstates for a time . The trailing edge of the pulse returns the gate charge to with the system in a superposition of ground and excited states corresponding to the phase of the oscillation acquired during . After the pulse, the excited state component decays with a relaxation time . The pulses are separated by a repetition time , typically greater than .
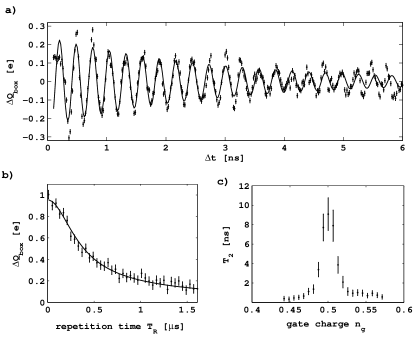
Since the staircase is acquired by ramping on a timescale much slower than , one measures an enhanced charge , that is time-averaged over the pulse train and proportional to the probability of finding the system in the excited state. Peaks in vs will be located at gate charges such that approximately a half-integer number of oscillations occur at gate charge during the time . Fig. 2(b) (bottom curve) shows a measured staircase using such a pulse train. When one measures such staircases for varying , then time-domain oscillations are evident in the cross-sections of vs . This is shown in Fig. 4(a), where we plot the time evolution near the charge degeneracy point. As is increased, the pulse-induced charge contributes less to the time average. A simple calculation which ignores coherence effects remaining after a time leads to the dependence
| (2) |
where is the initial peak amplitude. One can estimate at the readout gate voltage by measuring the dependence of the peak amplitude on and fitting the data to this formula.
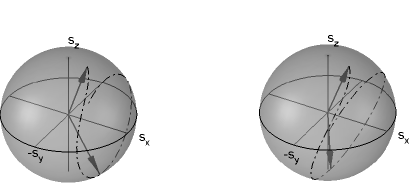
Using such a pulse-train allows a measurement of the excited state probability even when the relaxation time is shorter than the measurement time. Population averaging and mixing limit the maximum observed amplitude of the oscillations to rather than , and this occurs only for an ideal rectangular pulse, short repetition times and vanishing ratio. We have numerically integrated the Schrödinger equation using pulses with a finite risetime to study the various factors affecting both the contrast of the oscillations and the degree of charge state polarization. The results are best understood when plotted on the Bloch sphere as shown in Fig. 3. The dash-dotted lines show the evolution in time of the state vector starting from an initial condition (upward pointing arrows) and evolving through a maximum polarization of the charge state (downward arrows). The initial state differs from pure due to a finite . Fig. 3(a) shows evolution for a pulse that takes the system to the charge degeneracy. One finds that a finite pulse rise-time mimics a higher ratio and reduces the oscillation contrast. Nonetheless, Fig. 3(b) shows that by pulsing past the charge degeneracy, one can achieve nearly polarization.
Measurements of the dependence of are shown in Fig. 4(b), where we have used an appropriate pulse amplitude and duration to achieve nearly initial polarization. We find ns at the readout point using a least-squares fit to Eqn.(2). The data of Fig. 4(a) shows an oscillation contrast of approximately . Taking in to account the experimentally determined and , along with the measured risetime ps of our pulse generator (Anritsu MP1763C), we find good agreement between the observed and expected initial oscillation contrast. Numerical solutions of Schrödinger equation show that the reduction of contrast due to the pulse risetime depends strongly on . This was checked experimentally by varying and found to be in agreement with the calculations. A fit of the data of Fig. 4(a) to an exponentially decaying sinusoid gives a oscillation frequency GHz and decoherence time of 2.9ns.
Using fast DC pulse trains, we were able to observe oscillations in time out to 10ns. The dependence of decoherence time on gate charge at the top of the pulse is shown in Fig. 4(c) and has a sharp maximum at the charge degeneracy. This tells us that low frequency charge noise is the dominant source of dephasing in our qubit. As discussed and demonstrated by Vion et al.Vion et al. (2002), dephasing due to charge fluctuations is minimum at the charge degeneracy. The coherence time found by Vion et al. is much larger than that found in our measurements although their initial oscillation amplitude is much smaller. If we extrapolate the gate charge dependence of (not shown) to the charge degeneracy, we expect ns. This implies that the decoherence time we measure at the charge degeneracy is dominated by the short relaxation time rather than pure dephasing.
Our measured was also found to be independent of SET bias current in the sub-gap regime. Previously, a considerably larger was measured in a similar sample using a spectroscopic techniqueLehnert et al. (2003), and found to agree with the theoretical expected from quantum fluctuations of a environment. The reduced observed here could be attributed to several factors. One is coupling to the relatively unfiltered high frequency coaxial line, in addition to unwanted coupling to other metal traces and the microwave environment of our sample. In practice it is difficult to estimate the actual real part of the impedance on these leads at such high transition frequencies. Another possibility concerns quasiparticles. Our samples were fabricated without quasiparticle traps and despite the observed static -periodicity, there could be considerable non-equilibrium quasiparticle dynamics occuring on these time scales. Finally, it may be that the use of fast DC pulses leaves the bath of charge fluctuators in a configuration having additional channels for relaxtion of the qubit. Clearly what is needed is measurements using a variety of techniues—RF-rotations, spectroscopy, as well as fast DC-pulse—on the same sample.
In conclusion, we have fabricated and measured a solid state qubit based upon a SCB combined with a RF-SET readout system. Due to a relatively short , continuous measurement of the SCB was employed. Fast DC pulses were used to coherently manipulate the qubit and time-coherent oscillations of the charge were observed. The initial contrast of the oscillations is relatively large and quantitatively understood as due to finite combined with the finite pulse risetime. Furthermore, nearly charge state polarization can be achieved. The oscillations show a maximum decoherence time at the charge degeneracy which indicates that charge fluctuations dominate the dephasing rate.
Acknowledgements.
We would like to acknowledge fruitful discussions with R. Schoelkopf, K. Lehnert, A. Wallraff, G. Johansson, A Käck, G. Wendin and Y. Nakamura. The samples were made at the MC2 cleanroom. The work was supported by the Swedish SSF and VR, by the Wallenberg and Göran Gustafsson foundations and by the EU under the IST-SQUBIT programme.References
- Nakamura et al. (1999) Y. Nakamura, Y. A. Pashkin, and J. S. Tsai, Nature 398, 786 (1999).
- Vion et al. (2002) D. Vion, A. Aassime, A. Cottet, P. Joyez, H. Pothier, C. Urbina, D. Esteve, and M. H. Devoret, Science 296, 886 (2002).
- van der Wal et al. (2000) C. H. van der Wal et al., Science 290, 773 (2000).
- Chiorescu et al. (2003) I. Chiorescu, Y. Nakamura, C. J. P. M Harmans, J. E. Mooij, Science (2003).
- Yu et al. (2002) Y. Yu, S. Han, X. Chu, S.-I. Chu, and Y. Wang, Science 296, 889 (2002).
- Martinis et al. (2002) J. M. Martinis, S. Nam, J. Aumentado, and C. Urbina, Phys. Rev. Lett. 89, 117901-1 (2002).
- Schoelkopf et al. (1998) R. J. Schoelkopf, P. Walgren, A. A. Kozhevnikov, P. Delsing, and D. E. Prober, Science 280, 1238 (1998).
- Aassime et al. (2001) A. Aassime, D. Gunnarsson, K. Bladh, and P. Delsing, Appl. Phys. Lett. 79, 4031 (2001).
- Aassime et al. (2001) A. Aassime, G. Johansson, G. Wendin, H. Schoelkopf, and P. Delsing, Phys. Rev. Lett. 86, 3376 (2001).
- Lehnert et al. (2003) K. W. Lehnert, K. Bladh, L. F. Spietz, D. Gunnarsson, D. I. Schuster, P. Delsing, and R. J. Schoelkopf, Phys. Rev. Lett. 90, 027002(2003).
- Bladh et al. (2002) K. Bladh et al. , Physica Scripta T102, 167 (2002).
- Clerk et al. (2001) A. A. Clerk, S. M. Girvin, A. K. Nguyen, and A. D. Stone, Phys. Rev. Lett. 89, 176804-1 (2002).
- Lafarge et al. (1993) P. Lafarge, P. Joyez, D. Esteve, C. Urbina, M. H. Devoret, Nature 365, 6445 (1993).