Molecular dynamics study of melting of a bcc metal-vanadium II : thermodynamic melting
Abstract
We present molecular dynamics simulations of the thermodynamic melting transition of a bcc metal, vanadium using the Finnis-Sinclair potential. We studied the structural, transport and energetic properties of slabs made of 27 atomic layers with a free surface. We investigated premelting phenomena at the low-index surfaces of vanadium; V(111), V(001), and V(011), finding that as the temperature increases, the V(111) surface disorders first, then the V(100) surface, while the V(110) surface remains stable up to the melting temperature. Also, as the temperature increases, the disorder spreads from the surface layer into the bulk, establishing a thin quasiliquid film in the surface region. We conclude that the hierarchy of premelting phenomena is inversely proportional to the surface atomic density, being most pronounced for the V(111) surface which has the lowest surface density.
1 Introduction
Theories of melting [1, 2, 4, 7] can be separated into two classes. The first one describes the mechanical melting of a homogeneous solid resulting from lattice instability [3, 6, 8] and/or the spontaneous generation of thermal defects [9, 10, 12, 13]. The second class treats the thermodynamic melting of heterogeneous solids, which begins at extrinsic defects such as a free surface or an internal interface (grain boundaries, voids, etc) [4, 5, 11, 15, 34, 16, 17, 26]. Both types of melting have been studied extensively for the case of fcc metals. In order to determine whether the mechanism of homogeneous melting differs if the lattice symmetry is changed, in our first paper [14], we extended these studies to a bcc metal, vanadium. We used molecular dynamics simulations to study the mechanical melting transition in a bulk system, and found that the melting transition occurs uniformly throughout the solid at the melting point. The shear elastic instability leading to this melting of vanadium occurred once the molar volume reached a critical value, whether reached by heating the solid or by adding defects at a constant temperature [14]. The temperature at which the mechanical melting transition takes place in our model is K, which is above the melting temperature measured experimentally, K. Thus, the mechanical melting transition can be observed only if melting at surfaces is artificially suppressed, since in the laboratory it is preempted by the thermodynamic melting transition which begins at a free surface.
Theoretical aspects of melting beginning at the surface have been studied by phenomenological theories [16, 18, 19, 20, 21], lattice-gas models [17], and density functional theory [22]. Microscopic descriptions of static and dynamic properties of melting phenomena beginning at a surface emerged from computer simulations which employ many-body interaction potentials derived from the effective-medium [23, 24, 25] and embedded-atom theories [27, 28, 26, 31, 29], as well as pairwise interatomic interactions in the form of Lennard-Jones potentials [32, 33]. Melting at the surface is anisotropic, meaning that certain surfaces of fcc metals (Pb(110), Al(110)) exhibit premelting,[16] while this phenomenon is not observed for the close-packed surfaces (Pb(111), Al(111)). Theoretical aspects of this anisotropy were discussed by Trayanov and Tosatti [17].
This paper is organized as follows: details of the molecular-dynamics simulations are presented in Sec. II. Sec. III contains most of the results of this study, including the thermodynamic melting temperature and several structural, energetic, and transport properties of the surface. Finally, in Sec. IV, we summarize our results.
2 Simulation details
We model the melting of vanadium with a free surface using molecular dynamics (MD) simulations [39, 40] in a canonical ensemble. The many-body interaction potential used in this study was developed by Finnis and Sinclair [38] (FS). The computational aspects of the algorithm are described in detail in our previous article [14].
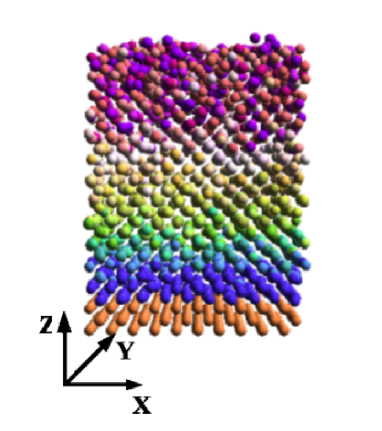
Ideally, a crystal with a surface is a semi-infinite system. We modeled this system as a thick slab. This slab is shown in Fig. 1. The bottom 3 atomic layers have the positions of the atoms fixed in order to mimic the effect of the presence of the infinite bulk of the crystal. Due to the relatively short range of the repulsive part of the modified FS potential, 3 fixed layers are sufficient to represent the static substrate. On top of those 3 layers there are 24 layers in which the atoms are free to move. Periodic boundary conditions are used along the in-plane (x and y) directions, while the top boundary of the slab, along the z direction, is free. In Figure 1 we show a sample where the temperature is high enough so that the layers near the free surface are already disordered.
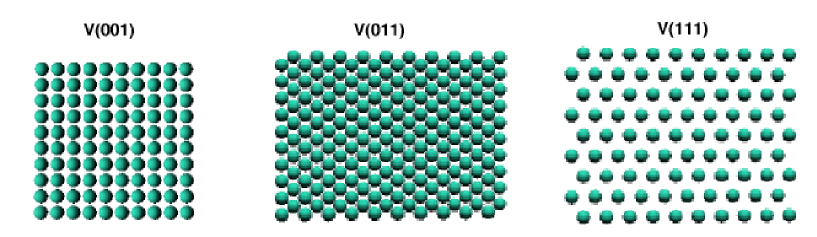
Three different samples with various low-index surfaces were constructed: V(001), V(011) and V(111), whose surface layers are shown in Fig. 2. The V(001) and V(111) samples contain 2700 atoms, initially arranged as a perfect bcc crystal of 10x10x27 unit cells (100 atoms in a layer). The V(011) sample contains 2646 atoms arranged as 7x7x27 unit cells (98 atoms in a layer).
Each simulation starts from a low-temperature solid. The lattice constant of the frozen layers is assigned a value appropriate to the bulk[14]. As the temperature is raised, this value is adjusted to reflect thermal expansion as obtained from bulk simulations[14]. We found that integration time steps were sufficient in order to reach thermal equilibrium after a temperature change (a time step sec). An equilibrium state is considered to be achieved when there is no significant temporal variation (beyond the statistical fluctuations) of the total energy, layer occupation number, structure order parameters, self diffusion coefficients, and a uniform profile of kinetic temperature across the sample is observed. Thereafter the various structural and transport properties of the system are calculated, accumulated and averaged over a long period of MD steps. Throughout this study, interactive visualization (the AViz program [41]) was implemented, to observe sample disorder and layer mixing (see Fig.1). A discussion of this visualization can be found in Ref. [45].
3 Premelting effects on surfaces
3.1 Thermodynamic melting temperature
In order to investigate the phenomenon of surface disorder and premelting, we first determined the thermodynamic melting point of vanadium described by the modified FS potential. was obtained by means of the method proposed by Lutsko et al. [42]. In this way, we found for the V(111) sample, which has the lowest surface packing density. This value is close to the experimental value [43] of . For the other surfaces, the value of comes out slightly higher, but within the uncertainty limits of the simulation. The difference could be due to superheating effects on the solid-liquid interface just above the thermodynamical melting point . The largest difference is found for the close packed V(011) surface, with . This dependence of the thermodynamic melting point on the crystalline plane forming the surface was also observed in MD simulations of fcc metals [23, 25, 27, 28, 13].
3.2 Surface thermal expansion and amplitude of atomic vibration
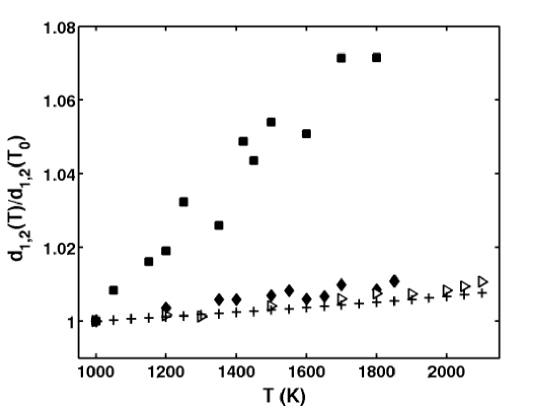
The interlayer relaxation and surface thermal expansion was calculated using the difference between the average coordinate of the th and th layers:
| (1) |
where is the -coordinate of the atom , is the instantaneous number of atoms in the layer , and the angular brackets denote a time average. The distances between the neighboring layers could be determined up to the temperatures where surface premelting effects blur the distinction between individual layers, although some structure remains visible in the local density profiles (see below).
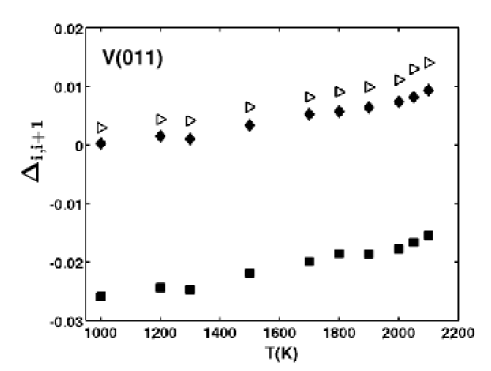
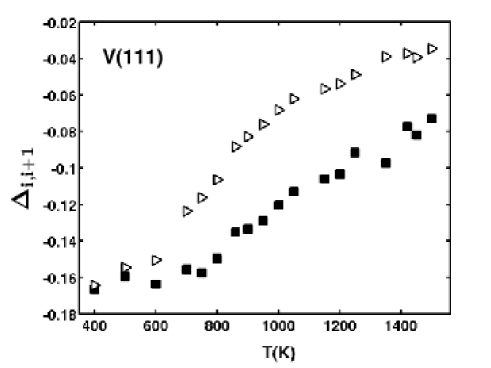
At low temperatures, the first layer exhibits an inward relaxation, i.e. , where we define
| (2) |
where is the distance in the -direction between the and surface layers, and is the distance between two neighboring layers in the bulk. In Figures 3 and 4 is plotted versus temperature for the two of the low-index faces.
The effect of the different geometry of the various surfaces is reflected in the thermal expansion, i.e. a surface with a lower atomic density expands more than a surface which is close packed. As shown in Fig. 5, the thermal expansion of the V(111) surface layers is significantly larger than the thermal expansion of other surfaces and fixed layers (bulk). In Fig. 6 we plot thermal expansion of surface layers (for the V(001) and V(011) slabs) and fixed layers on an enlarged scale. The observed “anomalous” thermal expansion of these surface layers is a direct consequence of enhanced vibration at the surface, where atoms probe the more anharmonic region of the interatomic potential. Anomalous thermal expansion was first observed in experiments on Pb(110) by Frenken [15].

Atomic vibration properties at the different faces of vanadium are important for illustrating the onset of anharmonicity at high temperatures. We calculate the mean square vibration amplitude (MSVA), , around the equilibrium position in the first surface layer as:
| (3) |
where denotes the spatial direction of motion, is the instantaneous number of atoms in the first surface layer, and the angular brackets represent an average over time.
In a harmonic system, increases linearly with temperature, and therefore deviations from linearity are a measure of anharmonicity. The mean square amplitudes of vibration shown in Fig. 7 for the V(111) surface demonstrate substantial anharmonicity at elevated temperatures. Figure 7 also shows that there is a noticeable difference between the in-plane MSVA, , and out-of-plane one, (we found that ).
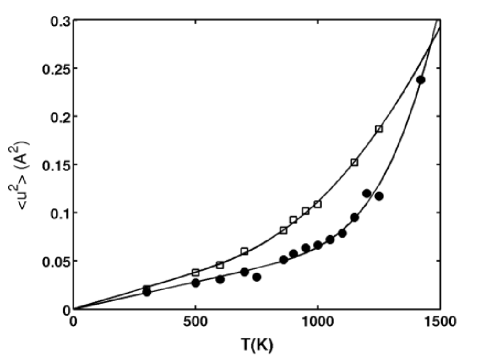
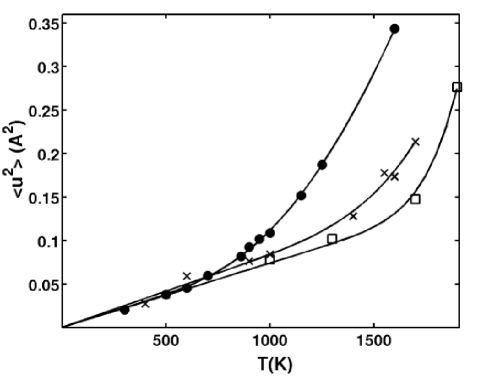
In-plane MSVA’s are larger than out-of-plane amplitudes also for V(001) and V(011) surfaces. One reason for this anisotropy could be the different nearest neighbour distance along the and directions caused by the inward relaxation of the surface layer, leading to a net restoring force that is higher in the direction perpendicular to the surface. The in-plane components of the mean square amplitudes of vibration for the various faces of vanadium are shown in Fig. 8. As may be seen from the figure the in-plane MSVA is largest for the V(111), and smallest for the V(011)surface. Atoms which belong to the loose-packed surface V(111) are less tightly bound than atoms of the close-packed V(011) face, and therefore vibrate with larger amplitudes.
3.3 Layer density profiles
In order to display the structure of the sample along the direction, perpendicular to the surface, it is convenient to use the density , defined so that is the number of atoms in a slice of thickness at . We represent by a continuous function defined according to Chen et al. [27, 28]
| (4) |
where is the coordinate of atom , with set at the bottom of the first layer which is not fixed, and the angular brackets indicate a time average. We use , where is the bulk lattice parameter at a given temperature. For a system in equilibrium, can be obtained by an average over many different configurations. Plots of at different temperatures are given in Fig. 9 for the V(111) slab, in Fig. 11 for the V(011) slab and in Fig. 10 for the V(001) slab.
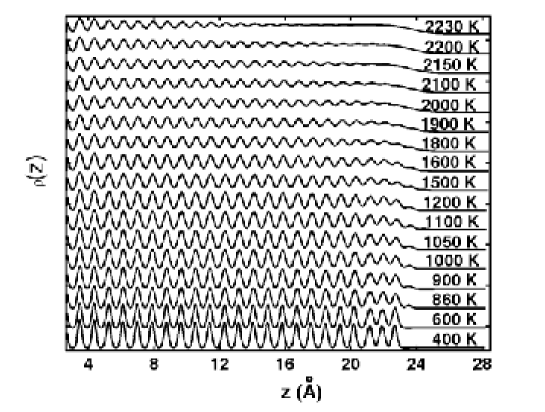
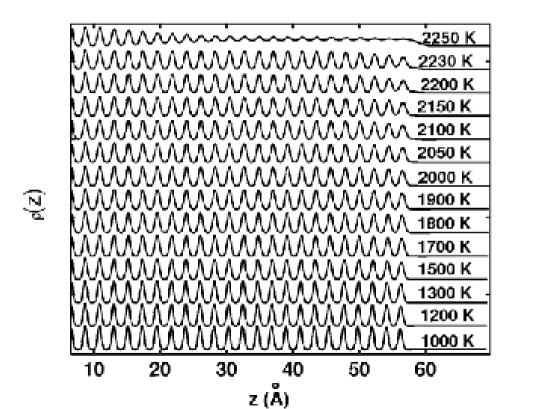
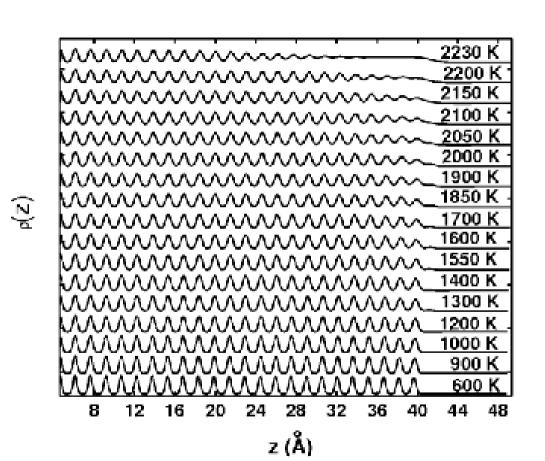
Premelting effects at the crystal surface can be examined by monitoring the layer-by-layer modulation of the density profile of the system, , at various temperatures up to the melting point . At low temperatures consists of a series of well resolved peaks. The atoms are packed in the layers with constant density in each layer and virtually no atoms in between these layers. As the temperature increases the effective width of each layer becomes broader due to the enhanced atomic vibration. The position of the density peaks moves to larger values of due to the thermal expansion. At higher temperatures the atomic vibration becomes so large, especially in the topmost layers, that the minima of in between two layers rise to non-zero values. In addition, disorder sets in, with atomic migration taking place between the layers. Comparing Figs. 9-11, one can see that the V(111) surface crosses over to a state of premelting first, than V(001), while on the V(011) surface premelting effects are very small.
Above some temperature ( for the V(111) surface, for the V(001) surface, for the V(011) surface) the density of the topmost layer becomes slightly lower than that of the underlying layers. This loss of density is compensated by the appearance of an adlayer. The adlayer appears first on the least packed surface V(111), and then at a higher temperature on the V(001) surface. The close packed face V(011) develops an adlayer at temperatures very close to . This hierarchy indicates that the formation energy of structural defects (vacancy-adatom pairs) is different on these surfaces. That hierarchy was also observed in the investigation of the surface premelting of fcc metals (Al[31, 30], Ni [27, 28, 29, 25], and Cu [27, 26]), where it was found that an adlayer appears first on the least packed (011) surface, then at higher temperature on the (001) face, and finally on the close packed (111) surface at a temperature close to . As the temperature increases towards the distinction between the surface layers becomes blurred, which is consistent with the topmost layers converting into a quasiliquid.
3.4 Layer structure factors
The preceding section dealt with the onset of disorder along the direction, perpendicular to the surface. In order to monitor the onset of in-plane disorder in each atomic layer, it is useful to define a structure factor (order parameter), , through a Fourier transform of the atomic density which is calculated separately for each layer
| (5) |
where and is a set of reciprocal lattice vectors. is the distance between nearest neighbors, and is the instantaneous number of atoms in the layer . The sum extends over the particles in the layer , and the angular brackets denote averaging over time.
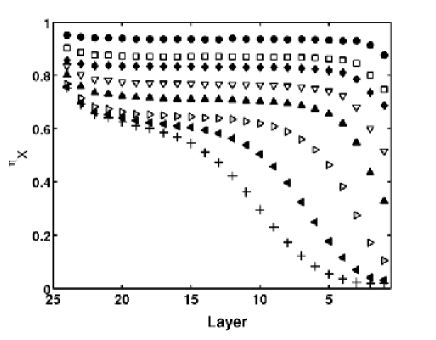
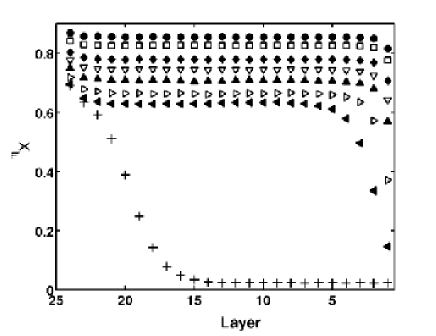
For an ordered crystalline surface the structure factor is a unity at zero temperature. Enhanced vibration and formation of point defects lead to a decrease of the structure factor with increasing temperature. This is illustrated in Figs. 12 and 13 where the structure factor along the direction is plotted vs. layer number for the V(111) and the V(011) slab, respectively. It is seen that these effects are most pronounced in the surface region. Vacancies do not directly affect the order parameter, since a normalization procedure is employed during each measurement by using the instantaneous layer occupation, , of a layer. Nevertheless, vacancies have an indirect effect on the order parameter by introducing a localized lattice distortion.
3.5 Radial distribution function
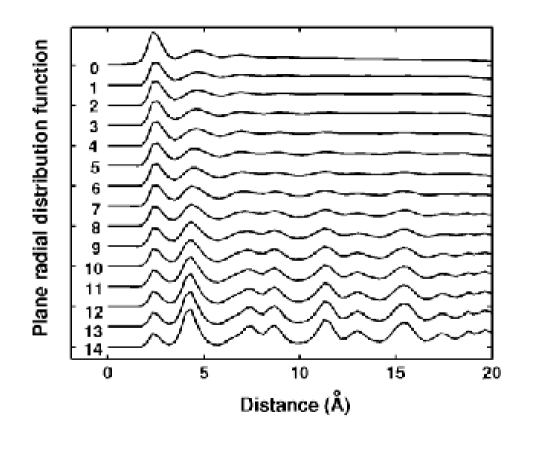
The formation of a quasiliquid film can be analyzed by using a plane radial distribution function defined as
| (6) |
where is the component of the parallel to the surface plane, is the instantaneous number of atoms in layer , the sum extends over all particles in layer , and the angular brackets denote averaging over time.
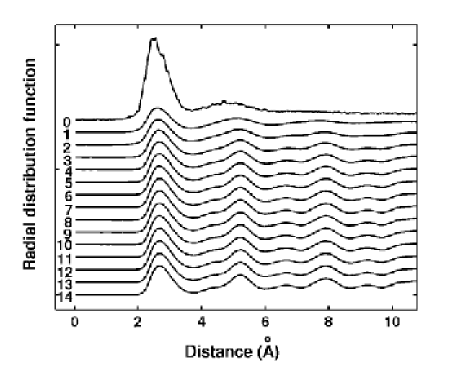
The two-dimensional radial distribution function, , for several layers of the V(111) and V(011) slabs very close to is shown in Figs. 14 and 15. As seen from the figures the intra-layer structure in these layers changes gradually from crystalline to liquid-like as one approaches the surface. Particularly noticeable is the disappearance of the crystalline features in that correspond to the second, third and other nearest neighbors. In addition to the heights of the peaks, the area under the curve changes, which reflects the change in the density across the solid-liquid interface.
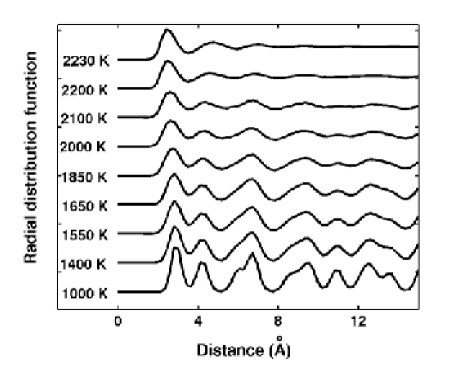
We note that within the adlayer, the probability of finding particles with separation beyond the first-neighbor shell is relatively small, indicating a tendency for clustering which persists, though to a smaller extent, even to . The plane pair-correlation functions for the first layer of the V(001) at elevated temperatures are shown in Fig. 16. It is clear that the crystalline structure vanishes gradually and the layer becomes quasiliquid as the melting point is approached.
We conclude from the analysis of the plane radial distribution functions and density profiles that surface premelting begins first on the least packed surface V(111), while changes only appear on the closed packed V(011) surface at temperatures which are very close to the melting point.
3.6 Layer occupation and point defects
As seen in the density profiles (Figs. 9-refdens001), the formation of an adlayer on the least packed surface V(111) begins at around K. At these temperatures, the appearance of an adlayer involves generation of vacancies only in the first surface layer, while at higher temperatures () vacancies in the underlying layers (the second and third layers) begin to appear via promotion of atoms to vacant sites in the first surface layer. Atom migration from the deeper layers into the surface layers increases significantly as the temperature approaches . In contrast to the V(111) sample, adlayer formation and generation of adatom-vacancy pairs at the the V(001) surface becomes observable only above (in practice, all adatoms come from the first layer).
The same effect, namely the appearance of an adlayer at different surfaces at successively higher temperatures was observed in computer simulations of surface premelting of fcc metals [23, 27, 28, 26, 31], where the lowest density (110) surface of fcc metals begins to disorder first, while the close packed (111) surface preserves its ordered crystalline structure almost up to .
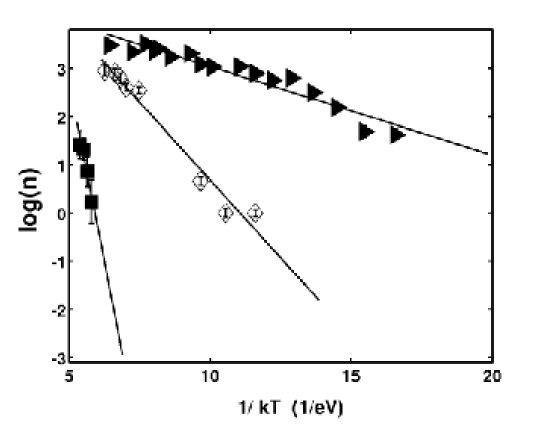
Knowledge of the equilibrium averaged number of atoms in the adlayer allows us to estimate , the formation energy of a surface defect (adatom-vacancy pair) according to the relation:
| (7) |
where is the adlayer occupation number at a temperature , and is the number of atoms in a layer at zero temperature. Eq. (7) holds as long as the surface structure is preserved, and interactions between defects can be neglected. Hence, we used the adlayer occupation data in a temperature region in which the concentration of adatom-vacancy pairs is small. The natural logarithm of adlayer occupation vs. is shown in Fig. 17 for the V(111), V(001) and V(011) surfaces, respectively. The calculated surface defect formation energies of the various low-index faces of vanadium are tabulated in Table 1.
An alternative method of estimating values of is to use the contribution of defects to anharmonicity, as reflected in the temperature dependence of the mean square vibration amplitude . Because the lattice in the vicinity of a defect is distorted, the value of will be larger for atoms near a defect. The layer averaged contribution to will therefore be proportional to the number of defects , and hence to . To extract , we have fitted our data to the form
| (8) |
where is a constant, and is a low order polynomial in . We found that taking to be first order in , namely , was sufficient to obtain a good fit. Typical fits were shown as solid lines in Figs. 7 and 8. Values of deduced from these fits for the various surfaces are given in Table 1. There is good agreement between the values of obtained by the two methods.
To summarize this subsection, the formation energy of surface defects is lowest at the V(111) surface, and increases at the V(001) and V(011) surfaces. This hierarchy is consistent with the results obtained for various faces of copper (fcc lattice) by Hkkinen et al.[23] In both cases, the surface defect formation energy is largest for the close packed surfaces (V(011) in case of a bcc lattice, and Cu(111) in case of a fcc lattice), and lowest for the least packed surfaces, V(111) and Cu(011), respectively.
| Surface | |||
|---|---|---|---|
3.7 Diffusion coefficients
Mass transport at surfaces can be characterized using the self diffusion coefficients. These coefficients are found from the particle trajectories, , by calculating the average mean square displacement
| (9) |
where is a coordinate index, the sum includes atoms in the layer , and the angular brackets denote averaging over time from the origin ().
The diffusion coefficients are calculated separately for each layer in the and directions, according to the Einstein relation
| (10) |
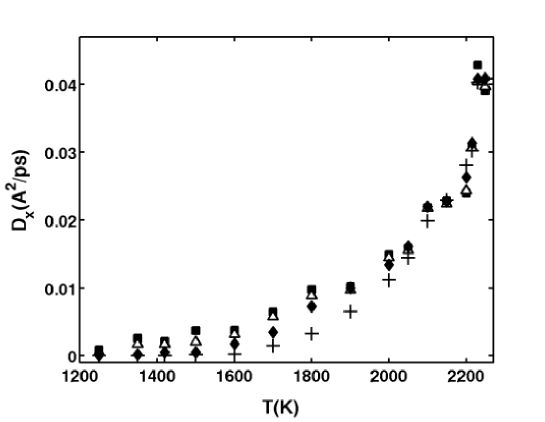
Values of the diffusion coefficients versus layer number are shown in Fig. 18. As expected, the mobility of atoms is larger the closer one comes to the surface. At high enough temperatures, where the surface layers become quasiliquid, the diffusion coefficient is the same (within the error bars) for all the atoms in the region of the surface. These observations correlate with the structural variations in the surface region exhibited in the pair correlation functions, the structure order parameters, and local density profiles.
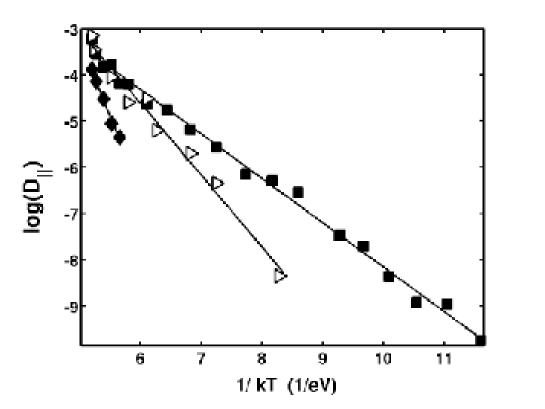
The natural logarithm of the in-plane diffusion coefficients, , for the first surface layer of the various faces vs. temperature is shown in Fig. 19. Within our accuracy, the diffusion can be characterized by a simple exponential dependence throughout the whole temperature range, , with diffusion activation energy, , being independent of temperature. Values of for the various low-index faces are given in Table 2. The diffusion coefficient of the least packed V(111) face is the largest. The diffusion coefficient of V(001) is smaller, but still larger than the diffusion coefficient of the close packed V(011) surface. In the temperature range where the surface region is still solid-like, diffusion takes place mainly by atoms exchanging places with vacancies. Writing as a sum of the formation energy, , and migration energy, , and using the values of from the preceding section, we can obtain values of for the various surfaces. These are listed in Table 2. It is seen that the migration energy for the V(111) surface is again the lowest, while for the other two surfaces is the same within the error bars of our calculation.
| Surface | |||
|---|---|---|---|
| (eV) | |||
| (eV) |
4 Conclusions
We investigated premelting effects at the various surfaces of vanadium using molecular dynamics simulations. We determined the thermodynamic melting temperature of vanadium described by the FS potential as K ( surface), and studied structural, transport (diffusion) and energetic properties (formation energy of surface defects).
We found that the surface region of begins to disorder first, via the generation of vacancy-adatom pairs and a formation of an adlayer at temperatures above . At higher temperatures, the surface region becomes quasiliquid. This process begins above for the V(001) surface. At the closest packed V(011) surface, this effect is observed only in close proximity of .
The results of our simulations of surface premelting of the bcc metal, vanadium, are similar to the results obtained for various fcc metals, in the sense that the onset of disorder is seen first at the surface with the lowest density.
5 Acknowledgments
We are grateful to Dr. G. Wagner and A. Kanigel for their contribution to this project. The authors would like to acknowledge the use of computer resources belonging to the High Performance Computing Unit, a division of the Inter University Computing Center, which is a consortium formed by research universities in Israel. More information about this facility can be found at This study was supported in part by the Israeli Science Foundation, the German-Israeli Foundation, and by the Technion VPR Fund for Promotion of Research.
References
- [1] A. R. Ubbeldone, Melting and Crystal Structure, Clarendon press, (Oxford) 1965
- [2] F. Lindemann, Z.Phys, 11, 609, (1910).
- [3] M. Born, Jour. Chem. Phys. 7, 591, (1939).
- [4] J.G. Dash, Rev. of Mod. Phys.,71, 71, (1999).
- [5] J.G. Dash, Contemprorary Physics,43, 427, (2002).
- [6] J. L. Tallon, Phil. Mag. A 39, 151, (1979).
- [7] Y. Ida, Phys. Rev., 187, 951, (1969)
- [8] D. Wolf, P. R. Okamoto, S. Yip, J. F. Lutsko, and M. Kluge, Jour. Mat. Res. 5, 286 (1990).
- [9] A. Granato, Phys. Rev. Lett., 68, 974, (1992)
- [10] T.A. Weber and F.H. Stillinger, Journ. of Chem. Phys., 81, 5095, (1984)
- [11] R. W. Cahn, Nature 323, 668 (1986)
- [12] R. W. Cahn, Nature 413, 582 (2001)
- [13] A. Kanigel, J. Adler, and E. Polturak, cond. mat. 0105022, Int. Jour. of Mod. Phys. C 12, 727, (2001).
- [14] V. Sorkin, E. Polturak and Joan Adler, ArXiv:cond-mat/0304215, (2003)
- [15] J. W. M. Frenken and J. F. van der Veen, Phys. Rev. Lett. 54, 134 (1985).
- [16] J. F. van der Veen, in ”Phase Transitions in Surface Films 2”, H. Taub., et al., eds., Plenum Press (New York), 1991.
- [17] A. Trayanov and E.Tosatti, Phys. Rev. B, 38, 6961, (1989).
- [18] W. Lipowsky, Phys. Rev. Lett, 49, 1575, (1982).
- [19] W. Lipowsky and W. Speth, Phys. Rev. B, 28, 3938, (1983)
- [20] W. Lipowsky, U. Breuer, K. C. Prince and H. P. Bonzel, Phys. Rev. Lett., 62, 913, (1989)
- [21] O. Tomagnini, F. Ercolessi, S. Iarlori, F.D. Di Tolla and E. Tosatti, Phys. Rev. Lett., 76, 1118, (1996)
- [22] R. Ohnesorge, H. Lowen and H. Wagner, Phys. Rev. E, 50, 4801, (1994)
- [23] H. Hkkinen and M. Manninen, Phys. Rev. B, 46, 1752, (1992)
- [24] H. Hkkinen and U. Landmann, Phys. Rev. Lett., 71, 1023, (1993)
- [25] Y. Beaudet, L.J. Lewis and M. Persson, Phys. Rev. B, 50, 12084, (1994)
- [26] R. N. Barnett and U. Landman, Phys. Rev. B 44, 3226, (1991).
- [27] E. T. Chen, R. N. Barnett, and U. Landman, Phys. Rev B, 41, 439, (1990).
- [28] E. T. Chen, R. N. Barnett and U. Landman, Phys. Rev B, 40, 924, (1989).
- [29] H. Cox, R. L. Johnston and J. N. Murrel, Surf. Sci., 67, 373, (1996).
- [30] P. Stoltze, J. Chem. Phys.,92, 6306, (1990).
- [31] P. Stolze, J. K. Norskov and U. Landman, Phys. Rev. Lett., 61, 440, (1988).
- [32] J. Q. Broughton, G. H. Gilmer and K. A. Jackson, Phys. Rev. Lett., 49, 1496, (1982).
- [33] J. Q. Broughton and G. H. Gilmer, J. Chem. Phys., 79, 5119, 1983
- [34] S. R. Phillpot, S. Yip, and D. Wolf, ”Computers in Physics” 3, 20 (1989).
- [35] J. Wang, J. Li, S, Yip, S. Phillpot and D. Wolf, Phys. Rev. B 52, 12627 (1995).
- [36] J. Wang, J. Li, S, Yip, S. Phillpot and D. Wolf, Physica A 240, 396 (1997).
- [37] Z. H. Jin, P. Gumbsch, K. Lu, and E. Ma, Phys. Rev. Lett., 87, 055703, (2001)
- [38] M. Finnis and J. Sinclair, Philos., Mag. A, 56, 11, (1987)
- [39] D. Rapaport, The art of MD simulations, Cambridge, University Press, 1991
-
[40]
M. P. Allen and D. J. Tildesley, Computer Simulations of Liquids,
Clarendon Press, Oxford, 1987 -
[41]
J. Adler, A. Hashibon, N. Schreiber, A. Sorkin, S. Sorkin and G. Wagner,
Comp. Phys. Comm., 12, No.5, 623, (2002)
http://phycomp.technion.ac.il/aviz/index.html - [42] J. F. Lutsko, D. Wolf, S. R. Phillipot and S. Yip, Phys. Rev. B, 40, 2841, (1989)
- [43] Handbook of Chemistry and Physics, 81’st edition 2000-2001 year, D. R. Lide, editor in chief, CRC Press
- [44] S. Foiles and M. Baskes and M. Daw, Phys. Rev. B, 33, 7983, (1986)
- [45] J. Adler, V. Sorkin and E. Polturak, submitted, http://phycomp.technion.ac.il/phr76ja/melt/