Two band superconductivity in MgB2: basic anisotropic properties and phase diagram
Abstract
Magnesium diboride MgB2 has been an extraordinarily “hot” research topic in the two years since the discovery of superconductivity below in this compound in . A large part of the excitement is due to the vast amount of unusual properties originating from the involvement in superconductivity of two sets of bands that are of a very different nature. Because of the different dimensionality of the two sets of bands, this “two band superconductivity” leads two a complex behavior of the anisotropic superconducting state properties as a function of magnetic field and temperature. The interplay between two band superconductivity and the anisotropic mixed state properties and phase diagram is reviewed, with a strong focus on experimental results obtained by torque magnetometry on MgB2 single crystals. The different dimensionality of the two sets of bands is manifested in the upper critical field anisotropy , which was found to strongly decrease with increasing temperature. While the angular dependence of follows roughly the predictions of anisotropic Ginzburg-Landau theory AGLT, small, but systematic deviations were observed near . This, and the temperature dependent , witness a breakdown of the AGLT description of MgB2, even close to . Theoretical calculations are in qualitative agreement with the observed dependence, but suggest a difference between and the low field penetration depth anisotropy with much lower values of at low temperatures. Measurements of reversible torque vs angle curves in the mixed state on the one hand are incompatible with expected “single anisotropy behavior”. On the other hand, they indicate that the penetration depth anisotropy in intermediate fields has to be higher than currently available theoretical estimates. The field dependent effective anisotropies observed in torque as well as many other experiments can be accounted for qualitatively by the faster depression of superconductivity in the more isotropic bands by the applied field. The vortex matter phase diagram is drawn, based on measurements of the reversible and irreversible torque in the mixed state. In the irreversible torque, a peak effect (PE) was observed in fields of about . History effects of the critical current density in the PE region suggest that the PE signifies an order-disorder transition of vortex matter, analogous to findings in low as well as high superconductors.
1 Magnesium Diboride: an unconventional “conventional superconductor”
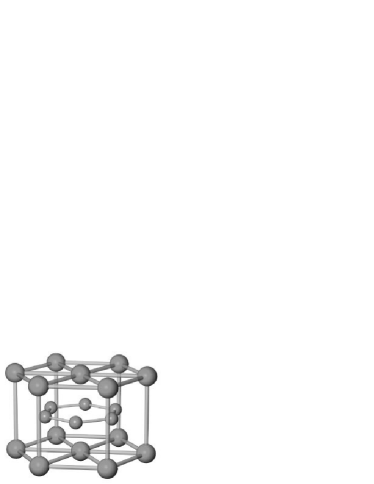
Magnesium diboride MgB2 is a binary inter-metallic compound [1] with a simple, layered structure: Boron atoms form a honeycomb lattice with hexagonal magnesium layers sandwiched between the B layers (see Fig. 1). The material has been known since the 1950’s [1], but little attention was paid to this compound. This changed dramatically in January 2001, when it was reported that MgB2 becomes superconducting below [2]. Particularly the high transition temperature caused a lot of interest in this compound and it’s physical properties. Just ten months after the discovery of superconductivity in MgB2, a comprehensive review [3] appeared, covering the first months of research about this “new” superconductor. The review counted 263 studies that between January and July either appeared in journals or were available to the community as e-prints.
The initial excitement was driven by the high transition temperature, thought to be close to the limit of what can be expected for a material exhibiting superconductivity with a conventional, phonon mediated pairing mechanism [4]. The high of MgB2 therefore immediately raised speculations about an unconventional pairing mechanism. However, studies of the boron isotope effect on [5] and, e.g., the 11B nuclear spin-lattice relaxation rate [6] soon indicated a BCS type s-wave phonon-mediated mechanism of superconductivity. The rather conventional nature of the superconducting pairing in MgB2 is also evidenced by the absence of a boron isotope effect on the penetration depth [7], in contrast to observations on cuprate superconductors [8].
On the other, MgB2 is far from being just an “all ordinary” conventional superconductor well described by BCS theory, as many other experiments showed. Point contact spectroscopy [9] indicated, for example, an energy gap to ratio much lower than predicted by BCS theory, the results of specific heat measurements [10, 11] were also at odds with BCS predictions, and the total (Mg and B) isotope effect on was found to be substantially lower than expected as well [12].
The huge difference between the effects of boron and magnesium isotope substitution [12] provided an early clue for a highly selective electron-phonon coupling (EPC), and the specific heat measurements [10, 11] even indicated the existence of a second superconducting gap. Calculations of the band-structure and electron-phonon interaction led to the description of MgB2 as a peculiar “two band” superconductor [13, 14, 15], whose features show up in almost every conceivable measurement [16].
The chapter is organized as follows. In Sec. 2, the concept and origin of two band superconductivity in MgB2 are sketched, as well as its experimental confirmation. One of the features heavily influenced by the two band nature of superconductivity is the angular and temperature dependence of the upper critical field , related to the coherence length. In Sec. 3, torque measurements of are presented and discussed. Section 3 also contains a brief discussion of anisotropic Ginzburg-Landau theory and basic experimental procedures (see Angst [17] for a more comprehensive discussion). The question of how exactly two band superconductivity shapes the anisotropy of the basic length scales below the (bulk) , is still not completely solved. In Sec. 4, we review torque (and selected other) measurements in the mixed state and compare to recent theoretical concepts and predictions. Apart from two band superconductivity, MgB2 is also interesting in that thermal fluctuations of vortices in this superconductor are of a strength intermediate between the ones of the cuprate and of conventional superconductors. In Sec. 5, we present and discuss the vortex matter phase diagram, drawn based on torque measurements. Finally, in Sec. 6, we summarize our discussion and present the main conclusions.
2 Two band superconductivity: a text book example
A two band scenario leading to two superconducting gaps was already proposed just two years after formulation of the BCS theory [19]. Two different bands in which superconductivity can exist are the most essential ingredient. Without any scattering of electrons by phonons from one band to the other one, there would be two transition temperatures. In the case of weak, but finite, interband phonon scattering, the lower disappears and the temperature dependence of the lower gap becomes strongly non-BCS. With very large phonon interband scattering, there should be still two gaps with temperature dependences now roughly similar to BCS predictions. The initial two-gap proposal was made in view of applications to metals. However, while some hints of “two-gap effects” were experimentally thought to be detected in form of small deviations from BCS in transitions metals [20], no strong effects, unequivocally attributable to two superconducting gaps, were found. It was pointed out [21] that, in order to observe considerable two-band effects, it was not enough to have two overlapping bands crossing the Fermi level. An additional requirement was that the bands in question have very different physical origins, such as covalent vs metallic-type bonding, which is more likely to occur in compounds.
The most convincing historical demonstration of two-gap superconductivity was made by tunnelling experiments in Nb doped SrTiO3 [22], where clear double peaks in the tunnelling conductance were found. Two- or multi- band models were also proposed for the cuprate HSC (see, e.g., Kresin et al. [23]), but strong electron-electron correlations and magnetism make those materials quite difficult to tract with first principles calculations [24], and unequivocal experimental evidence for any observable effects being due to multi band effects is scarce. It was only after the discovery of superconductivity in magnesium diboride that strong two-band effects were seen by a large number of different experimental techniques. What is it that really makes MgB2 so special?
Answering this question was helped tremendously by the fact that the relatively simple crystal structure (see Fig. 1) and the lack of complications arising from spin-dependent interactions or strong electron-electron correlations made accurate ab initio calculations of the electronic structure [25, 26, 27] and of the lattice dynamics [28, 29, 30] possible. In the remainder of the section we briefly sketch this answer, about which by now a general consensus developed.
Magnesium atoms in MgB2 are effectively ionized [25], i.e., they serve mainly as electron donors, similar to electron doping of graphite by intercalation. Like carbon atoms in graphite, boron atoms are sp2 hybridized, with three of the four [31] valence electrons tied up in strong covalent () bonds lying in plane, while the fourth electron is in nonbonding () states, which are delocalized (like the bonds in benzene).
Apart from doping the boron sublattice with electrons, Mg atoms, respectively Mg2+ ions, have another crucial impact on the electronic structure of MgB2 : Since the Mg2+ attractive potential is felt more strongly by the electrons in the states than by the ones in the states, magnesium induces charge transfer from the to the states, accompanied by the corresponding relative shift of the and band energies.
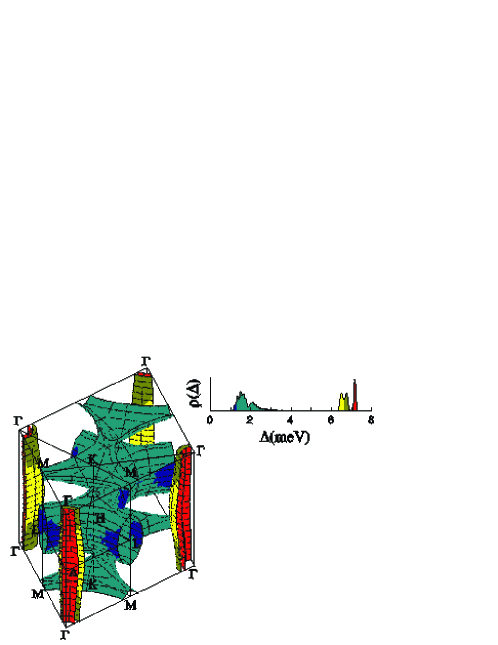
This leads the bands of MgB2 to be incompletely filled, in contrast to graphite. The covalent bonds are “driven metallic”, i.e. the corresponding carriers become mobile, by Mg induced charge transfer. The calculated Fermi surface (FS), shown in Fig. 2, consists of four separate sheets. Two sheets, derived from the boron () bands, are (electronlike and holelike) tubular networks. Since the smaller BB in plane distance is compensated by a smaller ( vs ) hopping [27], they are virtually isotropic and clearly three-dimensional (3D). The other two sheets, derived from boron () bands are holelike (approximate) cylinders with axis . The sheets show very little dispersion along and are thus nearly two-dimensional (2D), which could be expected from the covalent directed nature of the associated intraplanar BB bonds. Correspondingly, a high anisotropy of the Fermi velocity, averaged over the sheets, was calculated [25]: , where denotes the average over the Fermi sheets. The quasi two-dimensionality of the bands also leads to a sizeable contribution to the density of states (DOS) at the Fermi level despite the very small hole doping level [26]. In fact, the contributions of the 2D bands to the total DOS at the FS is almost equal in size to the one of the 3D bands (44% vs 56% [15]). This feature of two sets of bands with different dimensionality, but comparable contribution to the DOS at the Fermi level, is very peculiar.
For phonon mediated superconductivity, the phonon “band structure” and the EPC are just as important as the details of the structure of the electronic subsystem. The layered structure of MgB2 is reflected in the phonon dispersion curves as well, by weak dispersion of the optical branches along , and by anisotropic acoustic branches. Of the four distinct branches with non zero energy at the zone center , three were found to have no sizeable coupling to the electronic subsystem. This is not the case, however, for the doubly degenerate mode with symmetry at , which involves only in-plane (hexagon distorting) movement of boron atoms and is strongly anharmonic [30, 32]: This movement leads to large variations in the overlap of orbitals of neighboring B atoms, obviously modulating bond energies, particularly of the covalent bonds. Detailed zone-center frozen phonon calculations [30] indeed find a coupling of the phonon mode to the bands, which is not only very large, but also strongly non-linear, suggesting even pairing via two-phonon exchange [13]. This anomalously large coupling is evidenced, for example, by an extremely large linewidth of the mode [33]. It is important to note that the large and nonlinear coupling, the anharmonicity, as well as the small carrier density in the bands [34] are intimately related and have competing effects on [35].
With such an anisotropic (sheet or, more general, dependent) EPC, the superconducting pairing (and order parameter, gap) should be anisotropic as well, at least in the clean limit. An analysis of pairing, decomposed into the four Fermi sheet contributions, led Liu et al. [13] to propose the two-gap scenario for MgB2 : Similar anisotropic Fermi velocities and EPC of the two Fermi sheets, and of the two Fermi sheets, respectively, allow the reduction to an effective two-band model. Allowing for different order parameters for each of these two ( and ) effective bands increases the effective coupling constant relevant for superconductivity and is, together with the extremely strong coupling between one phonon mode and the bands, responsible for the high of MgB2 [36]. Later numerical calculations using fully anisotropic Eliashberg theory [15, 14] qualitatively confirmed the simpler effective two band model by Liu et al.. The gap distribution of gap values over the Fermi surface resulting from these calculations is shown in Fig. 2. Note that these results apply for hypothetical MgB2 without any impurity scattering [35]. In the 2D band, the superconducting gap-to- ratio is slightly enhanced with respect to BCS theory, while the gap in the 3D band is about two to three times smaller, and the corresponding gap-to- ratio is substantially below BCS predictions.
In order to have two superconducting gaps staying open up to the bulk , it is not only necessary to have a sizeable coupling between the two sets of bands by scattering of carriers by phonons. In addition, scattering of carriers between the two sets of bands by impurities needs to be very low; otherwise, any gap differences would be “washed out” by impurity scattering, accompanied by a lowering [37]. In MgB2, the impurity scattering is fortunately very small even in rather dirty samples because and bands are formed from different local orbitals orthogonal on an atomic scale and therefore hybridization is very small [38]. On the other hand, the intraband variation of the gaps as calculated for the clean case [15] and shown in Fig. 2 was argued to be completely washed out in any realistic sample due to intraband impurity scattering [35].
The two band two gap scenario is meanwhile well verified experimentally, from a large number of measurements both on polycrystalline material and single crystals: The band structure calculations are in agreement with de Haas-van Alphen [39, 40] and angle resolved photoemission spectroscopy [41] results, and the strong coupling between the phonon mode and the bands is evidenced by inelastic neutron scattering [30] and Raman [28] measurements: Spectroscopic measurements with various techniques, including point contact spectroscopy [42, 43, 44], scanning tunnelling spectroscopy [45, 46, 47, 48], photoemission spectroscopy [49], break junction (“SIS”) tunnelling spectroscopy [50], and Raman scattering [51, 52] observe directly two gaps. Moreover, the two different gaps and their location in space on the and Fermi sheets have been directly observed recently by angle-resolved photoemission spectroscopy (ARPES) [53]. The unusual temperature dependence of (zero field) thermodynamic properties of the superconducting state, as seen by bulk probes, particularly specific heat [10, 11, 54] and thermal conductivity [55], can also be accounted for quantitatively [15, 54, 56] with two-gap superconductivity, as can the incomplete isotope effect [5, 14, 12]. Due to the existence of two, coupled, superconducting condensates with different energy and length scales as well as very different anisotropies, a variety of interesting and unusual effects can be expected in the vortex state in non zero magnetic field, as will be discussed in the next sections, which focus on results by torque magnetometry.
In summary, magnesium diboride is peculiar in that two sets of bands with very different average gap values contribute to the DOS at the FS with similar strengths, and that they have different “dimensionalities” (or more accurately very different Fermi velocity anisotropies) and different coupling strengths to the phonon subsystem. For the actual observation of two band superconductivity, it is also crucial that there is some coupling, but at the same time extremely low impurity scattering between the two sets of bands. Two band superconductivity in MgB2 leads to very peculiar effects showing up in a vast range of experiments. Experimental results in zero field can be well explained quantitatively within the two gap model.
3 Upper critical field : breakdown of anisotropic Ginzburg-Landau theory
In MgB2, as we have seen in Sec. 2, the crystal structure as well as the electronic and phononic band structure are all far from isotropic. This should lead to anisotropic superconducting state properties as well, for example to an anisotropic upper critical field . Early measurements on polycrystalline or thin film MgB2 [57, 58, 59, 60, 61, 3] as well as electrical transport measurements on single crystals [62, 63, 64, 65] indeed found such anisotropy, but with a very wide span of values reported.
The upper critical field is the maximum field for which superconductivity in the mixed state can persist. The mixed state becomes energetically unfavorable when the vortex cores overlap too strongly, since the order parameter is suppressed in the cores. Considering the isotropic case, the vortex core radius is given by the coherence length , the typical length scale for variations of the order parameter, which (ignoring the difference between GL and BCS coherence lengths) at zero temperature is related to the superconducting gap by
| (1) |
where is an average velocity at the Fermi surface. The upper critical field is given by
| (2) |
with the flux quantum [66].
Anisotropic superconductors are usually treated within the phenomenological anisotropic Ginzburg-Landau theory (AGLT), which is obtained from the isotropic Ginzburg-Landau (GL) theory through replacing the effective mass [67] in the GL free energy functional [68, 66] by an effective mass tensor, with values , , and along the principal axes [69, 70, 71]. In the most usual case of uniaxial anisotropy, all anisotropy is incorporated into the anisotropy parameter , a simple constant. From the free energy variation it follows that
| (3) |
Here, is the penetration depth, the typical length scale for variations of the (local) magnetic field, given by
| (4) |
where is the superfluid density (density of superconducting carriers), is the (band averaged) effective mass tensor [67], is the electron charge and the speed of light.
When the field is not applied parallel or perpendicular to the -axis or the -plane, scaling relations apply, for example the AGLT angular dependence of the upper critical field is given by
| (5) |
where is the angle between the field and the -axis of the sample [72, 73]. Since effective masses [67] are temperature and field independent, at least as long as polaronic effects and the thermal expansion of the lattice can be neglected, the anisotropy parameter is assumed to be constant as well.
In materials with complex Fermi surfaces, the situation may not be as simple as outlined above. For example, slight temperature dependences of the anisotropy, which we call hereafter, were observed in some materials, such as NbSe2 [74], and explained by microscopic theories taking into account non-local effects [75, 76]. These theories show that the temperature dependence of cannot be attributed to an anisotropy of the band effective mass tensor, unless it is also wave-vector dependent. An anisotropic energy gap, caused by an anisotropic attractive electron-electron interaction, however, can lead to variations of with .
In MgB2, the situation is particularly complex, due to the two sets of bands: the band has a nearly isotropic Fermi velocity and a small superconducting gap, which would lead to an isotropic coherence length of the order of . The highly anisotropic band with a larger gap would have a coherence length anisotropy of about 6, with . Which set of bands controls the bulk upper critical field and it’s anisotropy ?
The torque magnetometry results reviewed in this section [77, 78, 79, 80], as well as several other experimental [81, 82, 83, 84, 85, 86, 87, 88] and theoretical [89, 90, 91, 92, 93] studies indicate that the answer strongly depends on temperature: the dependence of in MgB2 is much more pronounced than ever observed before in any compound.
In order to precisely determine the angle dependence and the anisotropy of the upper critical field of MgB2, we carried out torque measurements in fields up to on several MgB2 single crystals with volumes between about and [94]. Crystals of MgB2 were grown with a high pressure cubic anvil technique, described in detail by Karpinski et al. [78, 95]. In brief, a mixture of Mg and B was put into a BN container and a pressure of 3035 kbar was applied. Growth runs consisted of heating during up to the maximum temperature of 17001800, keeping the temperature for 13 h and then cooling to room temperature during 12 h. Flat crystals were up to in size, with sharp transitions at about 3839 K. The crystals selected for torque measurements had : See Fig. 1 in Ref. [96] for a low field magnetization curve in the region of the superconducting transition of one of the crystals used for the torque study (crystal B [94]).
The torque , where is the magnetic moment of the sample, was recorded as a function of the angle between applied field and the axis of the crystal for various fixed temperatures and fields or as a function of the magnetic field at fixed angles and temperatures. Measurements were performed on miniaturized piezoresistive cantilevers specifically designed for torque magnetometry [97]. For measurements close to in fields up to , a non-commercial magnetometer with very high sensitivity was used. For the measurements in the mixed state described in Sec. 4, a vortex-shaking process by an additional small oscillating magnetic field perpendicular to the main field was employed to speed up the relaxation of the vortex lattice into it’s reversible state [98, 99]. The crystal labelled A was measured in this system. The other two crystals were measured in a wider range of temperatures down to in a Quantum Design PPMS with torque option and a maximum field of .
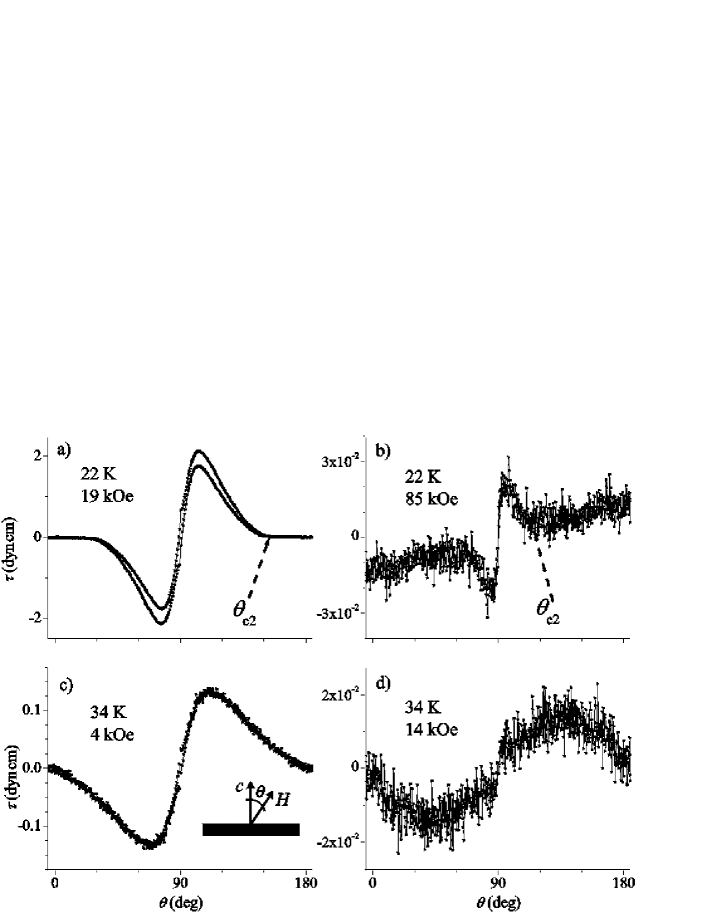
Four examples of torque vs angle curves are given in Fig. 3. Panels a) and b) correspond to measurements at . For fields nearly parallel to the -axis, both curves are flat, apart from a small background visible in panel b). Only when is nearly parallel to the plane there is an appreciable torque signal. The curve can be interpreted in a straight-forward way: for parallel to the axis the sample is in the normal state, while for parallel to the plane it is in the superconducting state. The crossover angle between the normal and the superconducting state is the angle for which the fixed applied field is the upper critical field. From the existence of both superconducting and normal angular regions follows immediately that and . In panel c), on the other hand, the crystal is seen to be in the superconducting state for all values of the angle , and therefore . Finally, the data in panel d) show only a small background contribution [100]. Therefore, the crystal is here in the normal state for any , and we have .
From figure 3 we therefore have two limitations for the upper critical field anisotropy , without any detailed criterion, and without any model fits :
| (6) |
With the limitations of Eq. (6), the upper critical field anisotropy of MgB2 cannot be temperature independent! As a consequence, the standard anisotropic Ginzburg-Landau theory AGLT does not apply for MgB2. The deviation is rather pronounced, within a change of temperature of about , changes, at least, by a fifth of it’s value. Concerning the real values of and , we only have an estimation so far and a more detailed analysis is necessary.
Although, in the light of the discussion of Fig. 3, it is clear that AGLT, with it’s effective mass anisotropy model, is not able the describe the data measured at different temperatures consistently, the detailed analysis of the angle dependence of is based on AGLT. We will show that as long as we stay at a fixed temperature well below , AGLT is able to describe remarkably well [101]. Although the location of , for example in Fig. 3a), seems clear at first sight, this clarity disappears, when examining the transition region in a scale necessary for the precise determination of (see Fig. 1 in Ref. [77]). For a strict analysis, it is necessary to take into account that the transition at is rounded by fluctuations of the order parameter around the value minimizing the free energy.
To assess the importance of thermal fluctuations in a superconductor, the so-called Ginzburg number [102] can be evaluated. While this dimensionless quantity is of the order of to in low superconductors [103, 104], it can become larger than in HSC cuprates [105], due to the higher , the very short coherence length, and the pronounced anisotropy. In the case of MgB2, with parameters we will obtain from , we can estimate : The importance of fluctuations in MgB2 is halfway in between the one of fluctuations in HSC cuprates and the one of fluctuations in conventional low compounds.
Fluctuations are difficult to tract theoretically in full generality. In zero and low fields, fluctuations in high superconductors have been successfully described with the “3DXY model” of critical fluctuations (see Schneider and Singer [106], and references therein) In sufficiently high magnetic fields, on the other hand, a different approach, the so-called “lowest Landau level” (LLL) approximation, was used successfully, both in high and low compounds, to describe the effects of fluctuations around [66, 107, 108, 109, 110]. The basic physical idea [107] is that in a uniform field , the fluctuating Cooper pairs are moving in quantized Landau orbits characterized by and . The mean field transition temperature is the temperature, at which the (i.e., the lowest) Landau level becomes stable, since Cooper pairs do not exist in higher fields, in the mean field approximation. Close to (and above) , the lowest Landau level is expected to dominate the fluctuation contributions. For a field high enough, , and temperatures close to , the approximation is well fulfilled, but upon approaching, along , the zero field critical temperature , the contributions from Landau levels with can no longer be neglected (see Lawrie [111] for a theoretical discussion of the limits of the LLL approximation). At the same time, the critical region is approached, and for low enough fields critical fluctuations dominate.
In the case of MgB2 [112], we expect the LLL approximation to be valid, except possibly very near , and the fluctuations to be three dimensional in nature [17]. The fluctuation magnetization of a 3D system in the vicinity of the transition temperature in the LLL approximation is given by a universal function F of [109]:
| (7) |
where A is a material constant related to the Ginzburg number. Eq. (7) applies for an isotropic superconductor as well as for an anisotropic one. However, in the last case the angular dependence of should be taken into account. The equation can also be applied to the torque of an anisotropic superconductor, by using a scaling transformation, as done by Buzdin and Feinberg for arbitrary isotropic scaling laws [113]. We find that the rescaled torque signal
| (8) |
with , is, in the LLL approximation, a universal function of with a fixed value at [114].
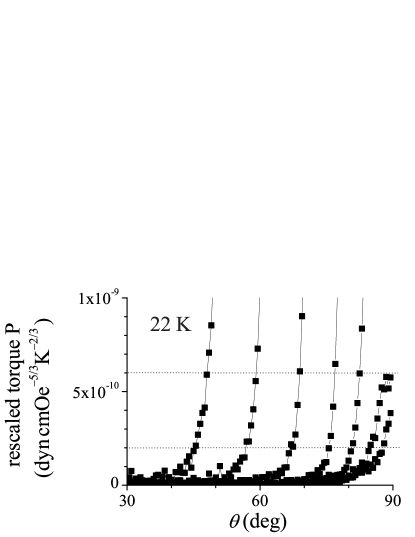
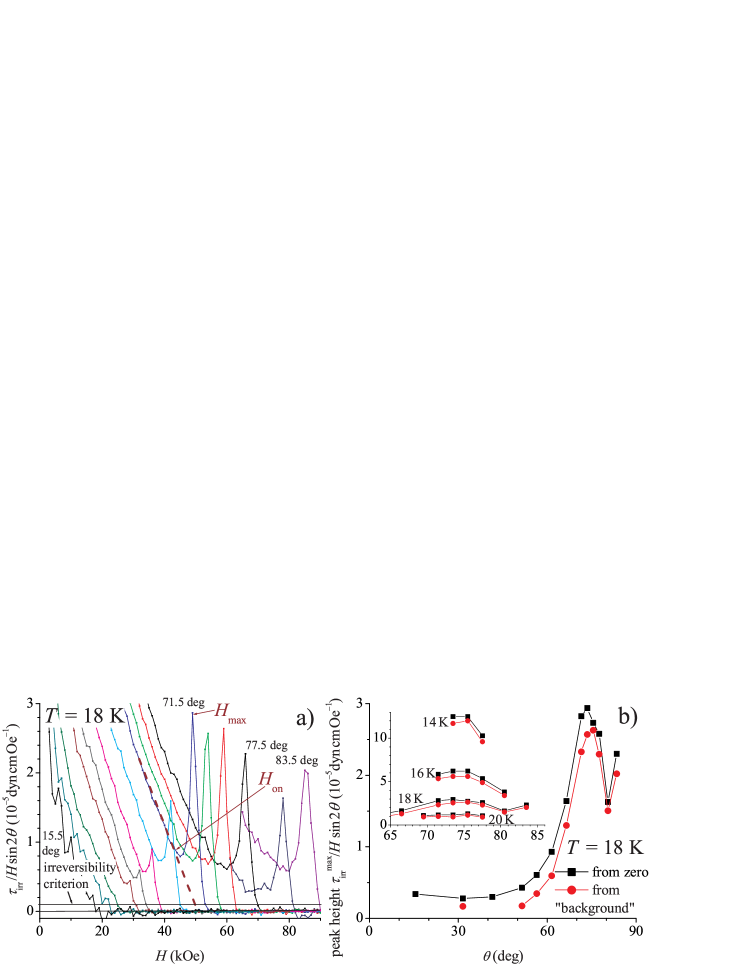
Taking into account the value for the theoretical dependence of the universal function for a 3D system [110], we can estimate that for a volume of the sample of the rescaled torque P reaches at a value of about . Figure 4 shows a selection of torque vs angle curves rescaled according to Eq. (8), in different fields at . The crossing of the dependence for each field with the line of the constant value of determines the dependence as it is shown in Fig. 5 below. Since there are some uncertainties in the determination of the volume of a small crystal, we used for comparison an additional criterion of , i.e., three times higher. The two criteria used are indicated by dashed lines in Fig. 4. It is important to stress that the results obtained depend not very sensitively on the criterion chosen and it will be shown later (see Fig. 7) that with both criteria defined here, we get very similar temperature dependences of and . Additional measurements at fixed angle give values corresponding well to those from measurements.
Since, for the purpose of the determination of , the transformation of the scaling variable is not necessary, no full scaling analysis was performed. From the resulting curve, the anisotropy parameter is then extracted by an analysis with AGLT, i.e., Eq. (5). We note that in the rescaling of the torque according to Eq. (8), the target parameter is used, which is obtained only later with Eq. (5). Therefore, scaling analysis and determination of with Eq. (5) had to be performed iteratively in order to self consistently find . However, the and points obtained with the scaling analysis depend not very strongly on the value of used in Eq. (8), and the iterative procedure converges rather fast.
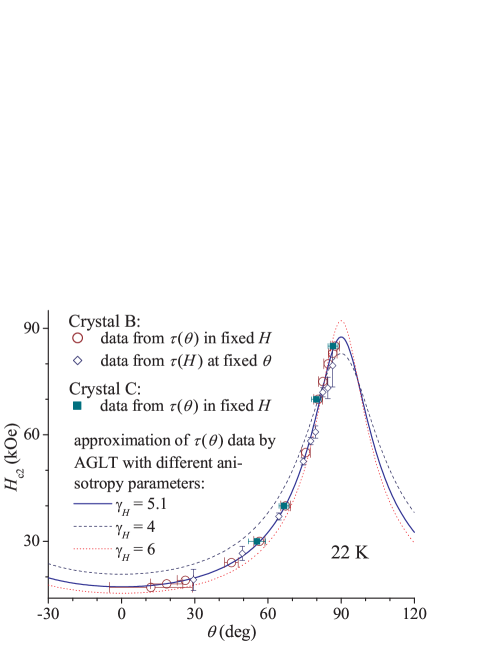
Figure 5, where all and points, obtained from the scaling analysis of the data measured at on crystal B, are plotted, shows that the data obtained employing the LLL scaling analysis are very well described by the AGLT formula [Eq. (5)], with an anisotropy parameter . Alternative curves from fits with Eq. (5), but using or , clearly fail to describe the data. The figure also shows data points obtained from crystal C [115]. The irreversible properties of crystals B and C are rather different, i.e., they have a different defect structure. The good agreement both in value and angular dependence of of crystals B and C that is observable in Fig. 5 indicates that such differences in the defect structure do not influence the upper critical field much, at least in the region between and [115], and therefore cannot influence our conclusion of a dependent anisotropy. We found the angular dependence of to be well described by Eq. (5) at all temperatures not too close to , but with a temperature dependent anisotropy parameter .
The first theoretical calculation based on a two band model (using the clean limit, i.e., ignoring both inter- and intraband scattering) [90] confirmed the temperature dependent , but indicated systematic deviations of the angular dependence more pronounced at low temperatures [116], predicting that the AGLT angular dependence should be followed well near . This is at variance with the experimental results, as we will discuss now.
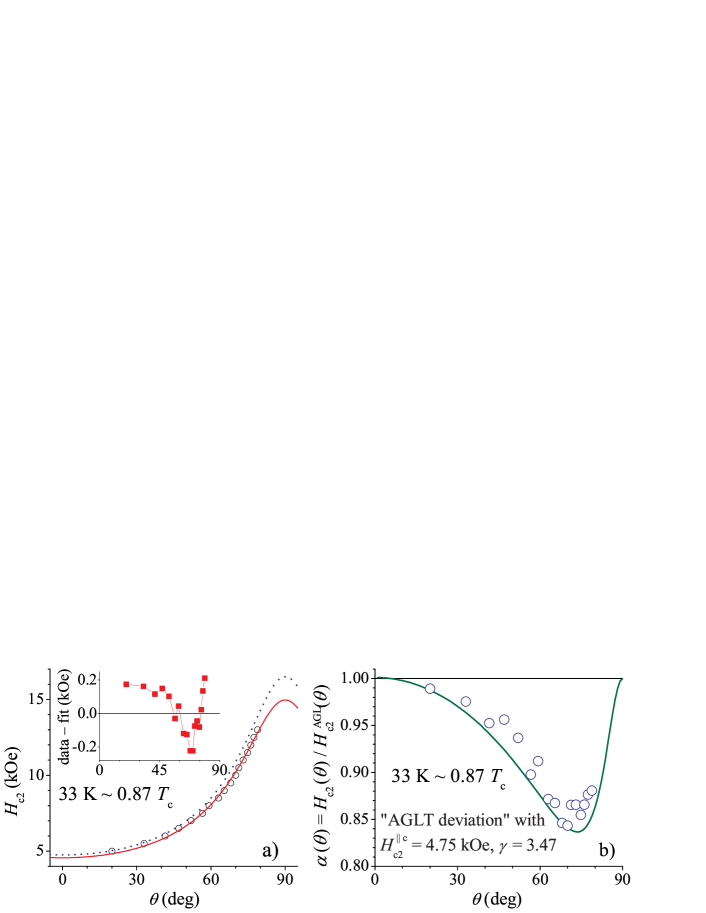
The upper critical field , determined from curves measured in various fields at , is shown in Fig. 6a). By definition, is 0 for and , and small for field directions close. This is why there are no data close to and . The best fit of Eq. (5) to the data is indicated by the full line. Small, but systematic deviations can be seen, especially when plotting the difference between experimental data and best fit vs (inset): at , is not (accurately) described by Eq. (5). Deviations from Eq. (5) were not observed at lower (cf. Fig. 5). Of course, in principle our experimental limitation of fields up to may prevent the observation of deviations from Eq. (5) at low temperatures (). On the other hand, an independent investigation [86] of , determined from electrical transport measurements [117] in fields up to , found no deviations of the angular dependence from the prediction of Eq. (5), even at .
Deviations most pronounced in the region of - were also found in a recent calculation [93] assuming zero interband, but high intraband impurity scattering (dirty limit, see also Gurevich [91]). In order to compare the deviations observed in torque experiments to the predictions of Golubov and Koshelev [93], we calculated “AGLT deviations” . For and , has form and magnitude [Fig. 6b)] very similar to deviation functions for calculated [93] (full line) at the same temperature [118]. Although the theoretically predicted [93] is higher than our data indicate, the similarity of the AGLT deviation suggests that (intraband) impurity scattering cannot be neglected in theoretical descriptions of in MgB2, even in single crystals of highest quality.
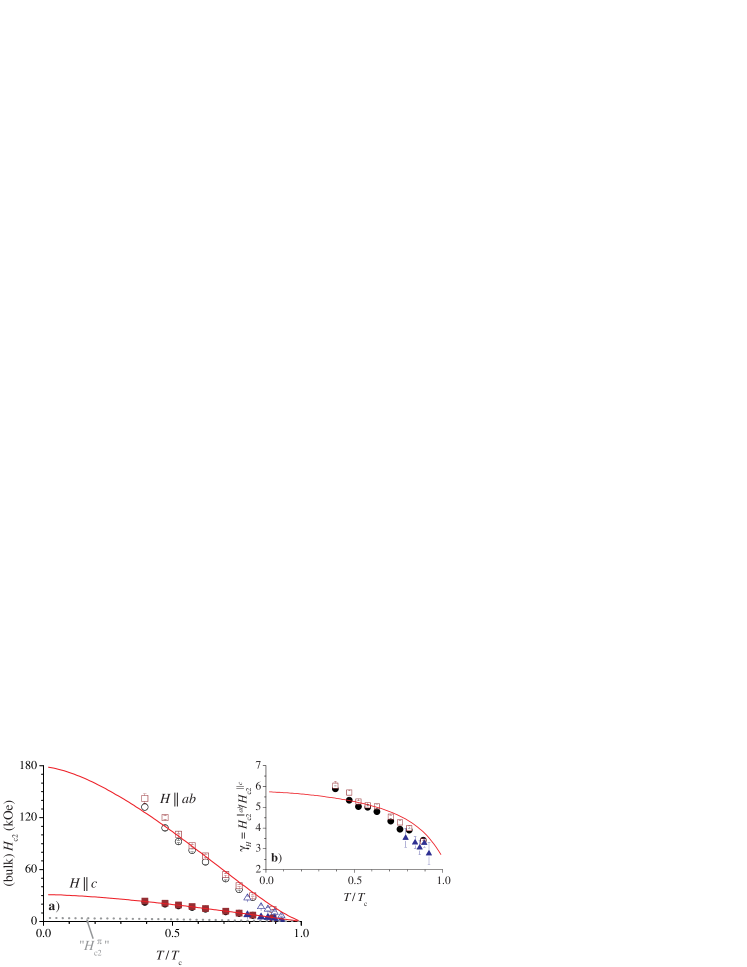
The upper critical fields parallel and perpendicular to the layers obtained with the scaling analysis and Eq. (5) are shown in Fig. 7a). Results obtained from two crystals in two magnetometers and using three different criteria are depicted as different symbols. It can be seen that the values of and do not depend very sensitively on the exact criterion used. The dependence of is in agreement with (isotropic) calculations by Helfand and Werthamer [119], with . On the other hand, exhibits a slight positive curvature near (due to the lack of low temperature data, for only an estimation can be given). The positive curvature of may also account for the positive curvature of observed in earlier measurements of polycrystalline material [3]. Correspondingly, the anisotropy systematically decreases with increasing temperature [Fig. 7b)], as we already expected from Fig. 3. A change of the criterion used for the determination of leads to small shifts of the magnitude of , but the temperature dependence is always the same. The highest upper critical field anisotropy was obtained at , the lowest anisotropy at . From Fig. 7 we estimate , while at zero temperature, may become as large as .
Since the time our torque measurements were performed, many other authors also observed a temperature dependence of in MgB2 as well [83, 84, 81, 82, 85, 86, 87, 88, 120]. Before making any quantitative comparisons, we note that electrical transport measurements [83, 84] yield too high values of , due to surface superconductivity (“”) [87] or more complicated effects [81]. All bulk measurements (torque [77, 120], magnetization [82, 85, 87, 88], thermal conductivity [81], and specific heat [86, 87]) agree well on the dependence and value. Concerning , and consequently , however, reported values differ from each other. It is difficult to say exactly what part of the discrepancies is to be attributed to the difference in experimental methods and procedures, and what part originates from the different samples used. The deviations of the angular dependence of from Eq. (5) near lead to a slight underestimation of from our torque measurements in this region, most pronounced for . This may explain at least partly the distribution over a wider temperature range of the change in anisotropy compared to experiments measuring directly and . This problem should not affect the data at lower temperature, where the values of and obtained in this work is closer to the upper end of the spread of experimental reports. We note that the limited field range () in the experiment inevitably reduced the accuracy of our analysis in the case of the lowest temperature data shown in Fig. 7, but since no systematic deviations from Eq. (5) are indicated in our and other measurements, we think the points shown are still reliable. It is possible that a small number of stacking faults may affect the value in this region, as discussed by Angst [17]. However, a comparison of of crystals from the same source, but grown with slightly varied procedures and pronouncedly different pinning properties yielded no significant differences (cf. Fig. 5 and Angst et al. [79]). On the other hand, the low temperature upper critical field of crystals from different sources can be more different, which may be due to significantly different intraband impurity scattering rates in the and the band [40].
The anisotropic upper critical field of MgB2 has been calculated by several authors using different approaches [89, 90, 91, 92, 93]. Apart from the report by Posazhennikova et al. [89], which was based on an anisotropic wave model, all calculations were based on the two band model (see Sec. 2). The calculations agree qualitatively with each other as well as with experiments. For comparison, the curves calculated by Miranovic at al. [90] are also shown in Fig. 7. Concerning the details, however, there are variations between the theoretical reports, as in the case of the experimental ones. For example, using similar input values from band structure and electron phonon coupling calculations (cf. Sec. 2), values of of [90], [92] and about [93] were obtained.
A major difference between the calculations of Refs. [90, 92] and the ones of Refs. [91, 93] is that the former neglect all impurity scattering, while the latter use an approach [121] based on the and the band being in the (intraband) dirty limit. It was demonstrated that in this case the upper critical fields, their anisotropy, and the temperature dependence of these quantities depend sensitively on the intraband scattering rates in the and in the band [91]. Indications that this may indeed the case in MgB2 are given for example by a much lower anisotropy with a decreased temperature dependence in carbon substituted MgB2 [122] and also by the wide spread of values of in various samples in early reports [3]. Furthermore, the differences seen even in the case of high quality single crystals [40] and the agreement of experimental results with the calculations by Golubov and Koshelev [93] concerning the deviations of the angular dependence of from Eq. (5) (see above) strongly suggest that intraband scattering is important in all present samples of MgB2. We note that there remains the problem that experiments, e.g. de Haas-van Alphen [39, 40], magneto-optics [123], and scanning tunnelling spectroscopy [48] indicate the bands to be in the (moderately) dirty limit, but the bands to be rather in the (moderately) clean limit whereas the comparison to experiments of the calculations carried out in the dirty limit indicates higher scattering rates in the bands [124].
Physically, it seems clear from a comparison of Fig. 7 and the electronic anisotropy in the bands (, see Sec. 2) that the low temperature upper critical field and its anisotropy is dominated by these bands with the stronger superconductivity (larger gap). In the hypothetical situation of no coupling between and bands, there would be two different upper critical fields for these bands with nearly isotropic and much smaller than , due to the smaller superconducting gap in the bands [cf. Eqs. (1) and (2)]. Due to the coupling by interband pairing and quasiparticle exchange, becomes a mere crossover field [125] with superconductivity in the bands induced by the bands superconductivity [48] even above this field. This crossover field is indicated in Fig. 7 by a dashed line. This issue is discussed in more detail in Sec. 4. The bands retain some influence on the bulk upper critical field due to coupling, but at low temperature this influence is not very large for the small interband pairing strength characteristical for MgB2 [92].
In the limit , on the other hand, thermal excitations lead to a thorough mixing of states over the whole Fermi surface, and the microscopic derivation of the anisotropic Ginzburg-Landau equations [71] is expected to hold, even if this is not the case at lower temperatures (cf. Ref. [17]). This leads to an anisotropy parameter being a simple average over the Fermi surface of the electronic anisotropy as a function of the wave vector, either weighted by the gap value (clean case, in MgB2) or evenly weighted (dirty case, in MgB2) [71, 126, 90]. The pronounced temperature dependence of the upper critical field anisotropy of MgB2 is, then, a crossover between the above two cases.
Although anisotropic Ginzburg-Landau theory should hold for , Fig. 7 clearly indicates that the variation of with temperature is the strongest close to . Furthermore, also the deviations of the angular dependence of from AGLT predictions is observed to be particularly strong near [see Fig. 6]. Therefore, in MgB2, AGLT seems to have an exceptionally limited range of applicability indeed. According to the calculations by Golubov and Koshelev [93], the AGLT description is indeed limited to temperatures less than away from . Since such a small temperature region is difficult to accurately probe experimentally, one may indeed say that there is a complete breakdown of anisotropic Ginzburg-Landau theory in MgB2.
In this small AGLT region very close to , Eq. (3) should hold, i.e. with the definition , we should have . At lower temperatures, where AGLT no longer holds, however, there is no reason why should be equal to . Indeed, calculations of (in the limit of very low fields) [126, 127] found the penetration depth anisotropy to increase with increasing temperature, from close to at to the “AGLT anisotropy” at , exactly opposite to the behavior of . Furthermore, Golubov [127] predicted a strong deviation of the angular scaling of the penetration depth from the AGLT dependence [Eq. (5)], essentially due to the very small bands axis plasma frequency [128]. This has not yet been experimentally confirmed, but as we have seen above, such deviations have been found in the case of the upper critical field. The so far only report on direct measurements of the low field penetration depth on single crystals [129] uses a method that is not very sensitive to the absolute anisotropy value at zero temperature, but concludes that there is very little temperature dependence of . This clearly implies for most temperatures. Such a difference of anisotropies should influence the mixed state properties, particularly the torque far below .
Indeed, the field delimiting the mixed state from below, the lower critical field , is mainly controlled by the penetration depth. From the energy needed to create an isolated vortex, it follows (within anisotropic Ginzburg-Landau theory) . Early measurements of the lower critical field of MgB2, performed mostly on polycrystalline material, yielded values between and . Meanwhile a few measurements on single crystals were reported. A direct measurement on single crystal by SQUID magnetometry gave values of and , with an anisotropy of [63]. A later direct measurement with a vibrating sample magnetometer yielded the surprisingly high values of , , with an anisotropy of [130]. Finally, direct measurements of were reported [85]. It should be noted that direct measurements of the lower critical field of single crystals are very difficult, because (i) only the penetration field , where the first vortex enters the sample, is obtained, which can be higher than for example due to geometrical barriers [131], (ii) demagnetizing effects lead to an underestimation of if not taken into account properly, particularly in thin crystals for . From our torque measurements, we obtain at low temperatures for different samples values in the region of , with little dependence on the field direction. This is compatible with the early measurements and would be compatible with a low penetration depth anisotropy [126, 127]. However, in light of the difficulties associated with the direct determination of and the wide spread of values reported for single crystals, we have to conclude that the situation regarding the lower critical field of MgB2 is much less clear than the situation regarding the upper critical field. For example there is no report about the angular dependence of , where deviations from the AGLT description may occur like in the case of discussed above. Often the values of , as well as those of are deduced indirectly from the magnetization in the mixed state, for example on the basis of the London model (see, e.g., Zehetmayer et al. [85]). The mixed state is discussed in the next section, Sec. 4.
4 Anisotropies for : there are still open questions, but “the smaller the field the more isotropic”
To obtain information about the anisotropy (and and ) in the mixed state (existing in superconductors with high enough ), an analysis based on the “London model” [66] was often used. This method was for example used with great success in the case of the high cuprate superconductors (see, e.g., Refs. [132, 133, 134, 98, 135]), where the direct measurement of the anisotropy is very difficult due to the blurring out of the transition by fluctuations (cf. Sec. 3).
The basic assumption of London model is not high and , but a constant magnitude of the order parameter throughout most of the space. Only in this case the variation of supercurrents and local magnetization is “simple” in most of the region and the small rest of the region (essentially the cores) can be treated in semi-phenomenological cut-off. This gets translated to “no core overlap”, restricting the London regime to fields sufficiently below . In the London limit, and , calculations by Kogan and coworkers [136, 137, 138] of the magnetization components longitudinal and perpendicular to the field lead to a torque given by [134]
| (9) |
where , is the sample volume, and is an effective anisotropy, equal to the upper critical field anisotropy if Eq. (3) is valid. We note that Eq. (9) is only approximately valid, since the London approach ignores the contribution of the vortex cores. From studying a more elaborate variational model it was, however, found that Eq. (9) still is a good approximation in a range of intermediate fields, although with renormalized parameter and renormalized penetration depth [139, 140].
On the other hand, Eq. (9) describes the reversible equilibrium torque, whereas in low fields and at low temperatures, the torque usually contains an irreversible part, that depends, on the direction of the field change, or in constant field, on the direction of the change of the angle between field and axis of the sample. The irreversible part is caused by pinning due to unavoidable point-like defects, due to extended defects such as stacking faults, and in highly anisotropic materials even due to the layered structure itself (see Sec. 5 for a discussion of irreversible properties).
The combination of these effects significantly restricts the region where Eq. (9) describes measured torque data. In fact, it is quite possible to have a material where there is no region where Eq. (9) is strictly applicable. In the past, the equilibrium torque was often approximated by just arithmetically averaging the measured torque for / increasing and decreasing. However, such a procedure was shown [98] to lead to systematic errors in the deduction of the anisotropy. A better way to obtain the true equilibrium torque is to speed up the relaxation of the vortex lattice into it’s reversible state by an additional small oscillating magnetic field perpendicular to the main field (“vortex shaking”) [98]. Note that this “shaking” procedure is different from performing minor hysteresis loops (cf. Sec. 5). A detailed theoretical explanation of this speed up of the relaxation to the equilibrium by the shaking procedure was recently given by Brandt and Mikitik [142].
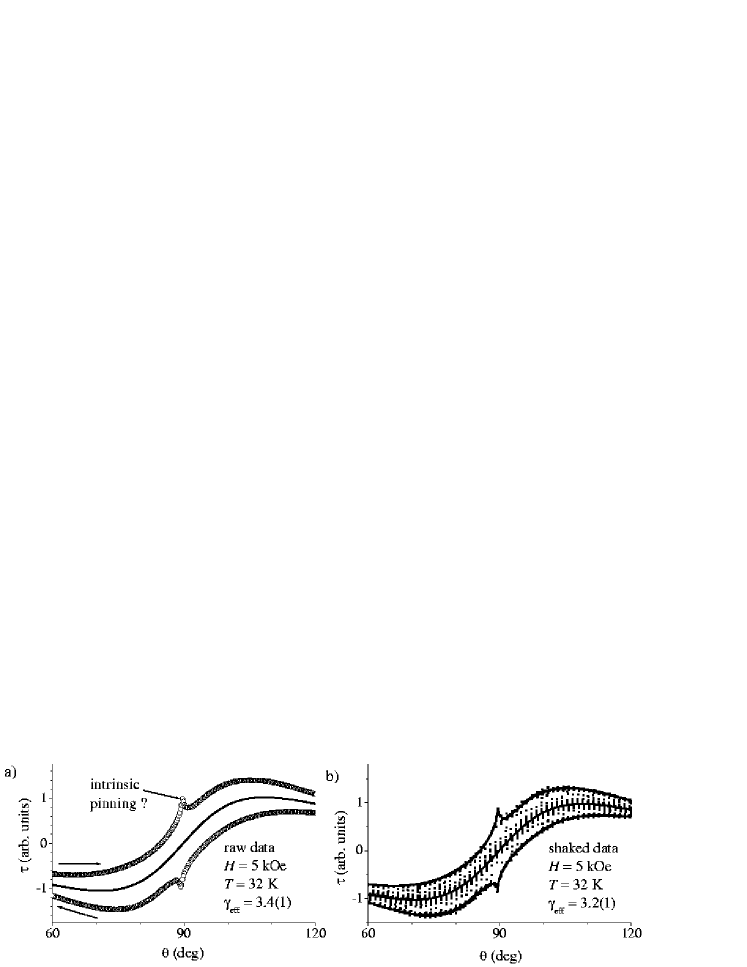
Figure 8 shows an example of one of the curves measured on crystal A for an analysis with Eq. (9). The comparison of panels a) and b) demonstrates the importance of the vortex shaking technique for an accurate analysis. Whereas the curves obtained without shaking [panel a)] show a substantial degree of irreversibility, this irreversibility is removed after shaking [panel b)] and the data are well described by Eq. (9), with an anisotropy parameter . The “unshaked” data of panel a), on the other hand, can be described by Eq. (9) as well, but with a slightly higher least-squares deviation, and with a higher anisotropy parameter, . Although the difference in is not very large and by the eye the fitting curves in the two panels are difficult to distinguish, the data seem to indicate that in MgB2, the presence of irreversibility leads to an overestimation of the anisotropy [141], similar to earlier findings in the case of YBa2Cu3O7-δ [98]. In Fig. 8a), a pronounced peak is visible in the irreversible torque for , reminiscent of the well known “intrinsic pinning” of highly anisotropic cuprate superconductors. This feature is discussed by Angst and coauthors [78, 17].
A number of additional torque vs angle curves were measured on crystal A not far away from in relatively low fields. Checking first the applicability of Eq. (9), with respect to the limitations sketched above, we note first that all data were measured well above and that the curves were well reversible after shaking [143]. We believe that due to the low Ginzburg number of MgB2 (as compared to the cuprates), critical fluctuations should not appreciably influence the torque in the region of temperatures measured. The remaining limitation is the influence of fluctuations and vortex core contributions in high fields. The upper field limitation of the applicability of Eq. (9) is not any well defined line in the - diagram, but a comparison with the results of Hao and Clem [140] indicates that for the data shown below (Fig. 9), Eq. (9) should be a good approximation, with the possible exceptions of the points / and /.
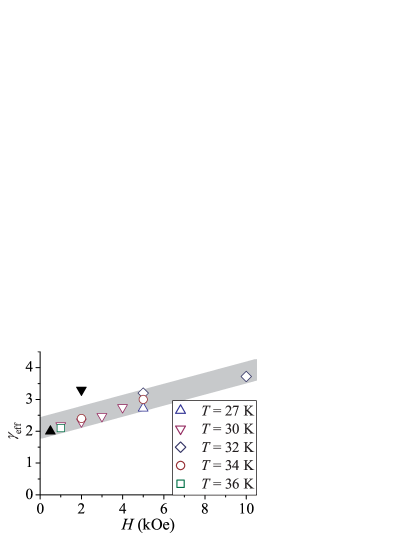
The result of the analysis of reversible torque data, measured at on crystal A at temperatures between and in fields from to , with Eq. (9) [77] is presented in Fig. 9 (open symbols). There is a number of points worth noting:
-
•
The effective anisotropy is field dependent, increasing nearly linearly from in zero field to in , again in disagreement with the anisotropic Ginzburg Landau theory.
-
•
No clear temperature dependence of is visible in the range of temperatures of and fields below .
- •
Before proceeding with the discussion of these results, we compare with other torque measurements analyzed with Eq. (9) that were reported in the literature. One report of an analysis of torque data measured at on a small MgB2 crystal with Eq. (9) concluded that in that case, was field independent [144]. However, much of the data used in that analysis clearly is measured in fields above the applicability region of Eq. (9), partly even above , and an analysis of the remaining data can support a field dependent [141]. Torque measurements performed on larger crystals were reported by Zehetmayer et al. [85]. In this case, data spanning the range of temperatures from to and measured in fields of , , and were collected. From the report it is not clear which field values were used at what temperatures, and what was the extent of irreversibility, but the values reported are all in the range between and , monotonously decreasing with increasing temperature. Finally, Perkins et al. [130] report one measurement of the transverse magnetization with a vibrating sample magnetometer. At and , they obtained .
The different values reported are not completely inconsistent, if the effective anisotropy rises with in low fields, but eventually saturates to values approaching the upper critical field anisotropy in fields of the order of . For a thorough analysis, it would be necessary to have for each measurement the exact information about field and temperature condition (to assess the limitation ) as well as the extent of irreversibility (given that irreversibility leads to an overestimation of , as discussed above).
However, given the difference between the penetration depth and coherence length anisotropies [145] suggested by theoretical calculations [126, 90], it is instructive to check the meaning of and the anisotropies appearing in Eq. (9) in detail. This is underlined by the difference between and the upper critical field anisotropy . The anisotropy parameter enters Eq. (9) twice via . In a first approximation [78, 17], the appearance outside of the logarithm (determined by the interaction between vortices) can be thought of as due to the penetration depth anisotropy , while the appearance in the logarithm (involving the vortex core cutoff) is linked to the coherence length anisotropy (see also Ref. [66]). A field dependence of the effective anisotropy similar as shown in Fig. 9 follows directly from a penetration depth anisotropy much smaller than the upper critical field (or coherence length) anisotropy, even if they are both field independent [78, 17]. Recently, the torque in the London limit has been rederived by Kogan [146] for the general case of . The generalized formula is [146]:
| (10) |
where [147], , , denotes differentiation with respect to the angle , is the sample volume, and
Based on Eq. (10) and the calculations of Kogan and Miranovic [126, 90], Kogan predicted a sign reversal of the torque at low temperatures in MgB2. We measured additional torque vs angle curves at low temperatures and in relatively low fields to experimentally check this prediction.
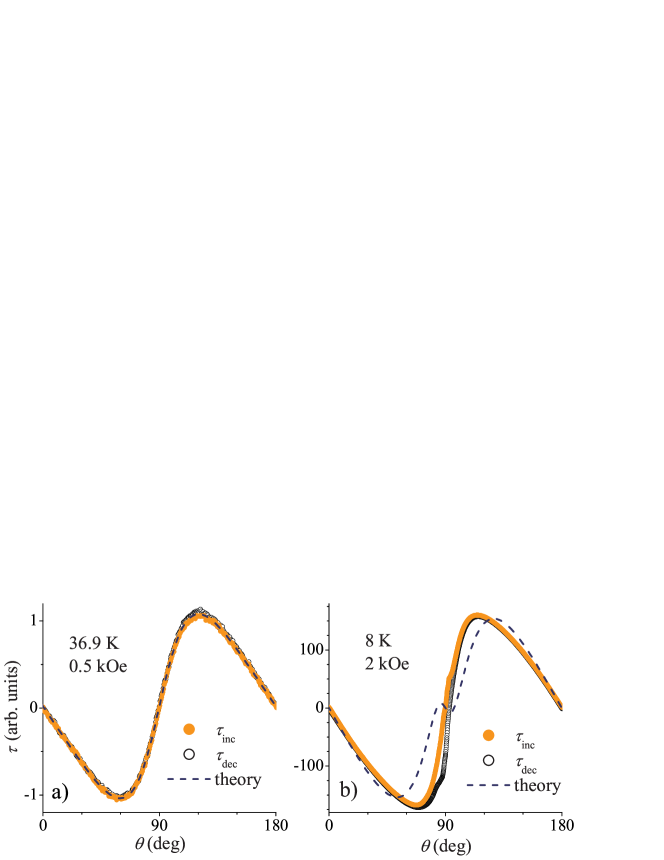
Figure 10a) shows a curve measured (on a different crystal, crystal D) in the mixed state close to . Near , the difference between and is small, in agreement with theoretical predictions [90, 146]. The common anisotropy value also is in good agreement with the data collected on crystal A (see Fig. 9). The curve measured at low [Fig. 10b)] has the same sign as the one measured close to , i.e., there is no sign change as expected [146] for . For moderately lower than , Kogan [146] predicted a sign change only in an angular region close to , illustrated with a dashed line in Fig. 10b). Such a partial sign change is also not observed, the maximum angular region where it could occur given by the irreversible region (the slight asymmetry in the irreversibility is due to thickness variations of the crystal). Comparing the data with curves calculated according to Kogan [146], with , (see Sec. 3) and various , we conclude that has to be at least , considerably higher than currently available theoretical estimates [126, 127]. Alternatively, if in is much smaller than in [145], the absence of a sign reversal is compatible with smaller . However, we should mention that the best description of the data with Eq, (10) is given by . This value is also included in the summary of Fig. 9 (). This low temperature value is higher than the values obtained on crystal A in the same field close to , indicating that the anisotropy in fixed field is no longer temperature independent over a larger interval. Concerning the experimental check of the predictions based on Eq. (10), we note that no total or partial sign reversal was found in curves measured on various crystals at low temperature in fields between and . However, for the curves measured in the lowest fields, a small partial sign change may be hidden by irreversibiliy remaining after shaking.
We think that the discrepancy between the torque data (Fig. 10) and the predictions by Kogan [146] is due to one or both of the following reasons:
-
•
The calculations of Kogan and Golubov [126, 127] are valid for the limit of very low fields, whereas was calculated for the upper critical field, i.e., in very high fields (cf. Sec. 3). Instead of and the coherence length anisotropy being very different and field independent, they could very well be similar or equal, both rising with increasing field. Furthermore, for the case of arbitrary field, it might be more appropriate to directly start with a two band model.
- •
We first discuss the second possible reason. As mentioned already in Sec. 3, a hypothetical bands superconductor with no coupling to the bands but the same superconducting gap would have a very low upper critical field: . This follows directly from the low superconducting gap in the bands, using Eqs. (1) and (2). Due to the near isotropic nature of the bands, no significant anisotropy is expected for . To the small gap and low isotropic upper critical field corresponds a large (direction-independent) coherence length , setting also the radius of the vortex cores. Hence, for a pure “ bands superconductor”, the limitation to the London model given by “no core overlap” or translates (for all field directions) to .
The coupling between and bands by interband pairing, quasiparticle transfer etc. transforms from an upper critical field to a mere crossover in the middle of the mixed state of MgB2. However, even as a broad crossover, may be expected to set a new field scale significantly affecting the mixed state properties. Furthermore, the whole vortex structure should be affected, with each vortex having two cores, one in the bands and another one with much larger radius in the bands. For both points there is considerable experimental support.
The two superconducting gaps are for example resolved in point contact spectroscopy measurements, as mentioned in Sec. 2. The feature associated with the smaller () gap was shown to disappear by application of a magnetic field of the order of , independent of the field direction. The crossover is also evidenced in a abrupt change of the field dependence of the specific heat coefficient (where is the specific heat) on single crystals [125]. The coefficient is a (bulk) probe of the quasiparticle density of states. As far as vortex core overlap is negligible, each vortex is creating the same number of quasiparticles in its core, leading to , where is the normal state specific heat coefficient. The unusual dependence in MgB2 can be well explained by an isotropic , above which the vortex cores in the band overlap so strongly that the contribution of the bands to reaches its normal state value [125] (see also Nakai et al. [148]). Similar arguments apply for the field dependence of the thermal conductivity, which is a probe of delocalized quasiparticles [81]. These arguments are strongly supported by the direct observation of large vortex cores in the bands with scanning tunnelling spectroscopy (STS) [48]. In these measurements, huge core radii of about are observed, which using Eq. (2) would correspond to . Consequently, a very significant core overlap is found already in fields of . On the other hand, the vortex lattice in the bands was still visible in fields as high as , which proves that superconductivity remains in the bands due to coupling with the bands even above . This means that the order parameter in the bands is not simply gone, but still spatially varying. The difference in the values of as deduced from different experiments is simply a consequence of its nature as a crossover.
The mixed state of a two band superconductor was recently considered theoretically by Koshelev and Golubov [124], based on the same approach as the upper critical field calculations of Refs. [91, 93] and neglecting variations of the magnetic field. Koshelev and Golubov [124] pointed out that the behavior of the weak band ( bands) partial density of states (as seen by STS and relevant for the field dependent specific heat and thermal conductivity) can be rather different from the behavior of the weak band order parameter. On the one hand, the crossover in the (spatially maximal) order parameter field dependence below and above the weak band “upper critical field” is much smoother than the one of the (spatially averaged) density of states. On the other hand, the length scale for the variation of the weak band order parameter is closer to the strong band ( bands) length scale than would be expected from the length scale of the variation of the weak band partial density of states (i.e., from the large band vortex cores observed by STS). With regard to the applicability of the London model, the order parameter is the more relevant quantity, since it is the order parameter that is coupled to the supercurrent density, and thus to the local field variation around the vortex center and to the interaction between vortices [66]. From the relatively smooth variation of the maximum order parameter in the weak band we conclude that there is still a large spatial bands order parameter variation up to the bulk upper critical field, which points against the applicability of the London model in fields larger than . We mention that recent preliminary torque measurements also point against the London model being appropriate in MgB2 for .
Before considering the other possible reason for the discrepancy between torque results and the predictions of Kogan [146], it is useful to list anisotropy effects in the mixed state observed by other methods. The anisotropy of the thermal coefficient of the specific heat (see above) measured for and can be formally defined as the ratio of fields applied perpendicular and parallel to the axis that yield the same value of [125]. Normally, this gives a constant value identical to the upper critical field anisotropy (this follows directly from ). In MgB2, however, Bouquet et al. [125] found to be field dependent: It has a value of for and then rises roughly linearly up to the anisotropy when the field approaches the upper critical field. This dependence is reminiscent of the field dependence of discussed earlier, but is the rise of starting only in elevated fields is an essential difference. The advantage of these specific heat experiments was the sensitivity only to the vortex cores, without the added complication of another length scale (the penetration depth). Indeed, Bouquet et al. were able to separate the contributions of and bands. The contribution from the band has a constant anisotropy of about and the contribution from the band is isotropic, both consistent with the calculated electronic anisotropy in these bands (see Sec. 2). The effective anisotropy is just a weighted average. The field dependence of , sensitive to the vortex cores only, does not indicate a field dependence of the coherence length, but rather that phenomenological formulas should take into account that there are two different coherence lengths in MgB2, and . Whenever this is not taken into account, the anisotropy of the best “effective coherence length” needed to describe experimental data has to be field dependent due to the different “intrinsic upper critical fields” of the and bands.
An important anisotropy effect is the distortion of the vortex lattice in fields tilted away from the axis, observed for example in the strongly anisotropic cuprate superconductors by small angle neutron scattering (SANS) [149]: the nearest neighbors fall no longer on a circle, but on an ellipse with axis ratio given by in superconductors with a single constant anisotropy parameter. In superconductors with no single anisotropy, we can define a lattice distortion anisotropy :
| (11) |
For the distortion is determined by the penetration depth anisotropy in the London limit [150, 146]: . Recently, SANS measurements were carried out on MgB2 powder samples in at by Cubitt et al. [151]. In randomly aligned powder, each grain carries a vortex lattice of its own, leading to a ring of diffraction instead of resolved diffraction spots. The random orientation of the grains and the vortex lattice distortion together lead to a broadening of this ring of diffraction. Comparing the measured scattered intensity distribution to the theoretically expected distribution, Cubitt et al. deduced an upper limit of the vortex lattice anisotropy under the given conditions: . In case that the London model is applicable in MgB2 in at , this would then correspond to the upper limit of the penetration depth anisotropy. In light of the discussion above, the applicability of the London model for the experimental conditions seems questionable. Indeed, according to the calculations of Dahm and Schopohl [92], the vortex lattice distortion anisotropy in fields close to the upper critical field should be similar to . The method used by Cubitt et al. [151] furthermore depends for example on model assumptions of the grain alignment distribution under the influence of the magnetic field and on the validity of the angular scaling of Eq. (11) [see also Sec. 3]. Later, SANS was also used to determine the vortex lattice structure and distortion on a single crystal [152]. Measurements with indicate a structural transformation of the vortex lattice in fields between about and , which is likely associated with the suppression of superconductivity in the bands above . Measurements with tilted by away of the axis show a vortex lattice anisotropy rising superlinearly with the field from in to roughly in . Differences between the value obtained in and the value obtained from scanning tunnelling spectroscopy in the same field, but for [152] may indicate a deviation of the angular dependence from Eq. (11). Similar deviations are discussed in Sec. 3. A deviation from Eq. (11) could also explain the discrepancy to the SANS measurement on a powder sample [151]. The identification of the observed with the penetration depth anisotropy is still questionable. However, the extrapolated low field lattice anisotropy should be equal to the low field penetration depth anisotropy, since in low enough fields neither the vortex cores in the bands nor the ones in the bands overlap and the London model should apply. Indeed, the value of is consistent with the low field theoretical calculations [126, 127].
For further quantitative analyses it will be necessary to make theoretical progress beyond the simple (one band) London model, building a sophisticated model of the mixed state built by vortices with two cores (or a “double core”) as well as two sorts of superconducting carriers. Steps into this direction were undertaken [148, 153, 154, 124], but what is lacking so far is a model of the variation of the local field around such “double core” vortices, particularly for the case of a large overlap of the larger of the cores. This case is very important, since it applies for the largest region of the mixed state of MgB2 (, see Fig. 7).
Qualitatively, the picture emerging seems to be more clear. As in the analysis of zero field specific heat and penetration depth data [54], it is important to consider the contributions of both sets of bands on any mixed state property. Each of the two sets of bands has its own set of length scales, i.e., coherence length and penetration depth , the latter of which is linked to the partial superfluid density [see Eq. (4)]. In the case of the bands these length scales are isotropic, whereas in the case of the bands, they are highly anisotropic, with an anisotropy of about , in accordance to the band structure calculations (see Sec. 2). These intrinsic anisotropies of the and the bands probably do not depend on field or temperature. Any mixed state property is then determined by the relative contributions from both bands and if described in terms of traditional single band models has to be assigned some effective anisotropy, depending on the contributions of the two sets of bands. At low temperatures and fields, both bands contribute roughly equally to the properties, in accordance to their similar contribution to the density of states at the Fermi level (see Sec. 2). Since the superconductivity is weaker in the bands (smaller gap), it gets depressed faster by perturbations such as an external field or thermal excitations. However, due to the coupling with the bands, it remains superconducting until the bands become also nonsuperconducting: the whole MgB2 is either in the superconducting or in the normal state. Upon application of an external magnetic field, superconductivity is depressed much faster in the weak bands, implying a decrease of the relative bands contribution to any mixed state property. Consequently any effective anisotropy used to describe the property has to rise with increasing field. How exactly that rise occurs depends on the quantity in question and the definition of the effective anisotropy. This applies for angle dependent torque measurements as well as for specific heat and vortex lattice distortion, as we have seen above. Increasing the temperature instead of the field in principle has a similar effect. However, additionally, thermally excited quasi-particles lead to an increased mixing of the two sets of bands, until, extremely close to , the two band character of MgB2 is no longer important for the mixed state properties and conventional anisotropic Ginzburg-Landau theory (AGLT) applies (cf. Sec. 3). Below this tiny region, AGLT is no longer appropriate to describe the mixed state of MgB2, and even phenomenological theories (Ginzburg-Landau [153], London, ) should be developed and used in a two band form.
5 Peak effect and vortex matter phase diagram
In Sec. 4, we examined anisotropy effects in the mixed state, which is bounded by the upper and lower critical fields (see Sec. 3). From the study of cuprate superconductors is known that the mixed state phase diagram contains more transition lines than the upper and lower critical fields. Identified were for example a melting transition between a quasi-ordered vortex lattice, called Bragg glass, and a disordered vortex fluid [155], as well as an order-disorder transition between the Bragg glass and a highly disordered, glassy phase [156, 157, 158]. The latter transition [159] has been observed also in low superconductors, such as NbSe2 [160, 161], and even in the elemental superconductor Nb [162], but not in ultra-pure Nb crystals [103]. This transition is generally associated with a peak in the critical current density and pronounced history effects.
MgB2 is, particularly concerning the importance of thermal fluctuations and the value of , intermediate between the high cuprates and low superconductors. Studying the vortex matter phase diagram of MgB2 may thus help in understanding the phase diagrams of various superconductors in a unified way.
In single crystals of MgB2, a quasi-ordered vortex structure has been observed in low fields by scanning tunnelling spectroscopy [48] and more recently clear Bragg peaks were observed by small angle neutron scattering [152], showing that at least under some conditions a Bragg glass is the stable vortex phase. Since, by tuning the amount of quenched random point-like disorder, the stabilization of a highly disordered phase can always be favored, an order-disorder transition in fields below should be observable in MgB2 as well, at least for certain impurity concentrations. We therefore looked for signatures of this transition by measuring torque as a function of field and angle.
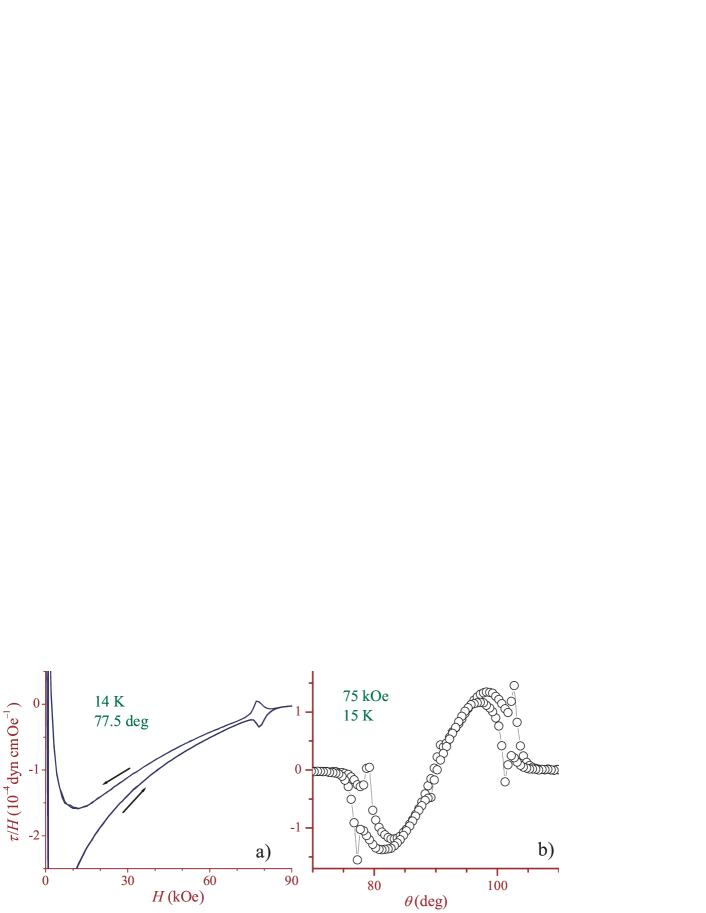
One of the torque vs field curves measured on crystal B is shown in Fig. 11a). For better comparison with magnetization curves, vs is shown. A pronounced and sharp peak effect (PE) in fields close to, but clearly distinct from, , can be seen. The peak effect was observed in vs measurements in fixed field as well, an example is shown in Fig. 11b). However, several features of the PE are better manifest in vs measurements at fixed angle, on which we concentrate below.
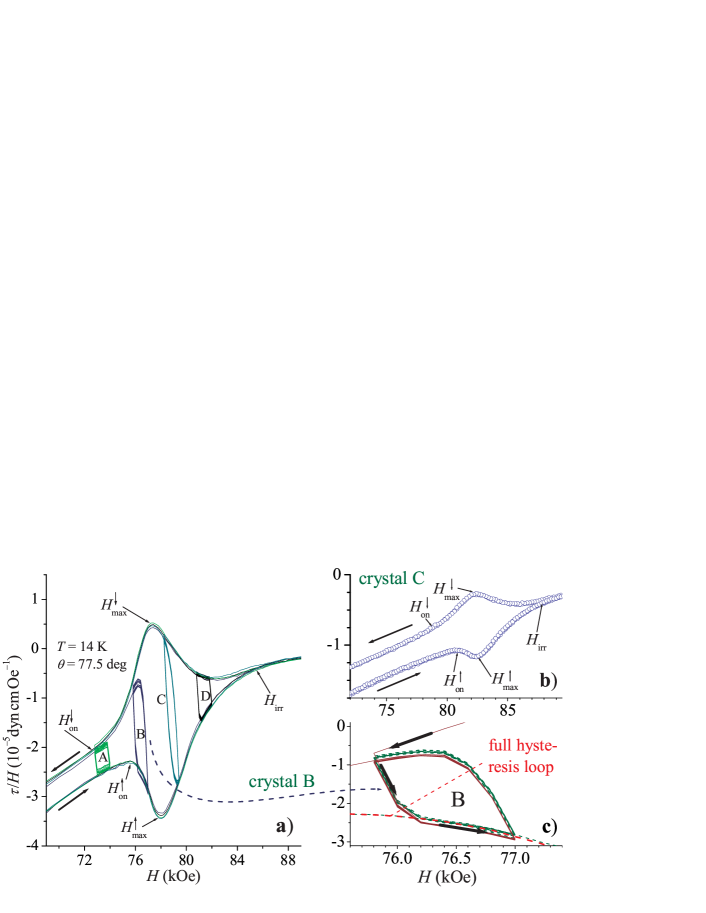
A magnification of the PE region of the curve shown in Fig. 11a) is presented in Fig. 12a). The peak is well pronounced and very sharp (full width at half maximum in comparison to the location in fields of about ). Various characteristic fields are indicated: The maximum of the peak for field increasing () and decreasing () branch of the hysteresis loop, and the onsets of the peak, and . The separation of the two onset fields is larger than the separation of the maximum fields, similar to the case of the cuprate superconductors [163]. Also indicated is the irreversibility field , where the two branches of the hysteresis loops meet. The peak resembles qualitatively the peaks observed in NbSe2 [104, 160] and CeRu2 [164]. In NbSe2, there are strong indications that the peak effect indeed is a signature of the order-disorder phase transition [161].
Figure 12b) shows a measurement on crystal C with the same external conditions as in panel a). In this crystal, the PE is less pronounced, but still clearly discernible. It is located in slightly higher fields, . Crystal C was grown with the same technique as crystal B, but under slightly different conditions. These two crystals have pronouncedly different pinning properties, particularly for field directions close to parallel to the layers (see Angst [17]). The presence of the PE in two crystals with such pronounced differences strongly indicates that the PE, or rather its underlying mechanism, is an intrinsic feature of MgB2. That this is indeed the case is also supported by the recent observations of similar peak effects on single crystalline MgB2 from other sources by electrical transport [86, 87], ac susceptibility with a Hall probe [86, 165], and torque magnetometry [120].
The peak effect shown in Fig. 12 is similar to the peak effect in NbSe2, where it is attributed to the order-disorder transition, as we mentioned above. The order-disorder transition region is accompanied by history effects in the critical current density (a brief discussion of this point can be found in Ref. [17]), a feature observed experimentally for example in NbSe2 [160, 161], and very useful to identify the transition.
To investigate possible history dependences of the critical current density, we performed several minor hysteresis loop (MHL) measurements in and around the peak of crystal B [96]: The field is cycled up and down by a small amount ( in steps of ) several times, ideally until the loops retrace each other, indicating that the vortex system reached a stable pinned state in the given field [160, 164]. MHL measured, within full loops, in four different regions of the PE are indicated in Fig. 12a) (A-D). MHL B is magnified in Fig. 12c): The initial branch of the MHL started from the branch of the full hysteresis loop (FHL) (full line indicated by arrows) clearly is below the branch of the FHL (thick dashed), indicating larger hysteresis. This behavior contradicts Bean’s critical state model [167], where the hysteresis of partial hysteresis loops can never be higher than the one of the full loop. It can be explained by the vortex configuration on the branch of the FHL (where the MHL was started) having a higher than the vortex configuration on the branch. Repeated cycling studies furthermore indicate the meta-stable nature of the this “high field vortex configuration”, at [96, 17]. In MHL A, similar but less pronounced effects were observed, whereas no history effects were discerned in studying MHL B, C, and additional MHL far below the PE.
The findings of the detail study of minor hysteresis loops of the peak effect in MgB2 [96, 17] can be summarized as follows: Between and , pronounced history effects occur. They can be accounted for by the coexistence of a metastable high-field vortex configuration with high pinning and a stable low-field, low pinning configuration. Above and below , no significant history effects are observed, indicating that there is only one vortex configuration, which is stable. The larger hysteresis width of MHL started from indicates pinning in the configuration stable above to be stronger than pinning in the configuration stable below . This is exactly what is expected for the order-disorder transition [161, 17]. Particularly, the “overshoot” of an MHL over the full hysteresis loop [Fig. 12c)] is difficult to explain without a “two metastable vortex configurations” scenario. Specifically, it cannot be explained by relaxation effects, since this should always lead to lower hysteresis of the MHL with respect to full hysteresis loops.
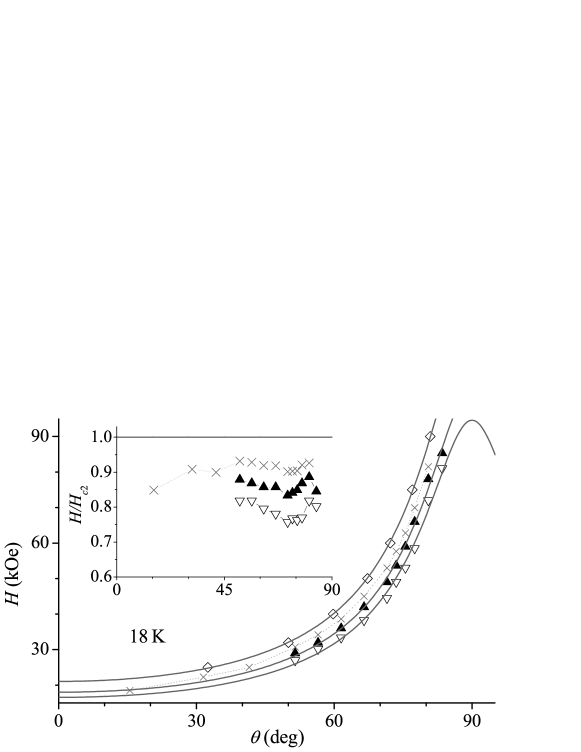
Figure 13a) shows the irreversible part of the torque, scaled by , vs field, at for various angles. The scaling was chosen to minimize the angle and field dependence intrinsic to the torque. Since the peak is not visible at all temperatures and angles as well as in Fig. 12, onsets and maxima were determined from irreversible torque curves as those shown in Fig. 13a). The was defined as the field, where the irreversible torque starts to deviate from a straight line behavior, as indicated in the figure for the curve measured at . The onset defined in this way is close to as indicated in Fig. 12a), but we note that with the determination of onsets and maxima from the irreversible torque, the fine details of the differences in the field increasing and decreasing branch of the hysteresis loops are lost. It can be seen in Fig. 13a) that the height of the peaks varies in a pronounced way with the angle . The peak height is shown in panel b), with and without subtraction of an extrapolated linear background. It indicates that the peak effect is most pronounced in the region of angles between about and . This angle region is independent of temperature, as shown in the inset of Fig. 13b).

One possible explanation for this behavior is an influence of stacking faults on the peak effect. Although the presence of the peak effect, and it’s location, are not affected by stacking faults, the extent of hysteresis may be. The difference of how pronounced the peaks of crystals B and C are [see Figs. 11 and 12b)] supports such a scenario. The location in higher fields of the peak effect in crystal C indicates that there is less point-like disorder present in this crystal than in crystal B, if we accept the PE as a signature of the order-disorder transition [156, 157, 158]. What is difficult to explain with only one sort of disorder varying is the smaller ratio of the hysteresis width within to the hysteresis width below the PE, , of crystal C, as compared to crystal B. Both the angular PE amplitude maximum and the difference in the ratio of crystals B and C might be attributed to the influence of non-collective strong pinning by stacking faults in crystal B. This point was discussed in more detail by Angst [17].
The variation of the peak onsets and maxima with angle at is shown, together with and [166], in Fig. 14. These characteristic peak fields follow the angular dependence of , as indicated by fits to the theoretical dependence according to the anisotropic Ginzburg-Landau theory [Eq. (5) of Sec. 3], while the angular scaling of the irreversibility field is less clear. This can be seen also in the inset, displaying the dependence of the characteristic fields, reduced by the upper critical field. The onset field is approximately constant at about and the maximum field at about . is located at about , but seems to get slightly lower as . The good angular scaling of the peak onset and maximum fields supports the conclusion that they are unaffected by stacking faults.
Torque measurements are not possible for or and SQUID measurements performed with and gave no indication of the peak effect. However, ac susceptibility measurements on the same crystals indicate the peak effect to be present both for and , confirming that the underlying mechanism is a feature for all directions of [79, 168]. This conclusion is supported also by recent reports of other authors, in the case of from transport data [87, 86] and ac susceptibility with a local Hall probe [86, 165], in the case of from transport data [86].
The phase diagram for an angle of between and the axis of the crystal (corresponding roughly to the angle where the PE is most visible), is presented in Fig. 15. In the inset, scaled irreversible torque vs curves are shown. The magnitude of the peaks is reduced quickly by increasing the temperature. The main panel shows the temperature dependence of the characteristic fields. The abrupt end of and is due to the decreased sensitivity of the magnetometer (In fact, the peak effect is discernible at temperatures up to in measurements of the torque vs angle, such as shown in Fig. 11b) [79]) and due to the smearing of the effective pinning landscape by thermal fluctuations [17], as indicated by the drop of the irreversibility line.
In a recent report of low frequency ac susceptibility measurements [165], the peak effect was observed for at temperatures up to about , and interpreted in terms of the order-disorder transition as well. Pissas et al. [165] report the transformation of the PE into a “step-like” ac susceptibility for the temperature interval between and , and interpreted this as a signature of thermal melting. In our case, no step-like feature in the reversible torque was observed in the continuation of the PE. It should be emphasized, that thermal melting so far below would be at odds [96] with theoretical expectations [105].
The equilibrium order-disorder transition, which corresponds to [96], is located in fields of about in crystal B and in about in crystal C. The peak effect observed in other crystals by transport was reported to be located even closer to [87, 86]. These differences are natural for a disorder-induced phase transition in crystals with varying degrees of disorder. Form and location of the PE observed in MgB2 resembles results obtained on NbSe2 single crystals with varying degrees of disorder [169], but are rather different from the order-disorder transition in cuprate superconductors [163, 17].
6 Conclusions
We have reviewed superconducting state anisotropy effects in magnesium diboride MgB2, with the main focus on results obtained by torque magnetometry. MgB2 is a “two band” or “two gap” superconductor: the superconductivity is Fermi sheet dependent in an extreme way, with a large gap (strong superconductivity) on the Fermi sheets and a roughly three times smaller gap on the Fermi sheets. This is possible because of the very different coupling to the lattice vibrations in these two sets of bands and because of there is very low hybridization between them, resulting in a very low impurity scattering rate between them. Pronounced and unusual anisotropy effects originate in this two band superconductivity and in the very different electronic anisotropies of the two sets of bands.
One of the unusual anisotropy effects in the superconducting state is the very pronounced temperature dependence of the upper critical field anisotropy , falling from a value close to (with some sample dependence) the electronic anisotropy of the bands () at zero temperature to low values of the order of about for temperatures approaching . There is a good qualitative agreement between various experiments as well as theoretical studies on this. The origin of this temperature dependence of is the increased “mixing” of the two sets of bands by thermally excited quasiparticles at higher temperatures at low temperatures the upper critical field is mainly determined by the stronger superconducting bands, which has the higher field scale. The interplay between the different field scales, anisotropies, and interband mixing also leads to the observed deviations of the angular dependence of from conventional behavior. No general consensus has yet emerged concerning the impact of the different intraband impurity scattering rate on the upper critical field. Concerning the lower critical fields, the available experimental data is sparse, preventing the drawing of firm conclusions.
The anisotropy effects on the upper critical field, as well as on other quantities, implies a breakdown of the standard (one band) anisotropic Ginzburg-Landau theory, except in a tiny (less than ) region below . Below this region, microscopic calculations have to be used, or at least a two band formulation of the anisotropic Ginzburg-Landau theory involving two order parameters and two sets of length scales and , as well as some description of the coupling between these two components.
In the mixed state, experimentally deduced anisotropies are different from different quantities, and also often depend on the model used to analyze the data. However, all experimental results [at least those spanning an extended field region including (at low temperatures) the range of ] find anisotropies that are monotonically increasing as a function of the magnetic field and that are consistent with reaching for or already in lower fields. In the case of torque magnetometry, describing the data with an equation allowing for different anisotropies of the penetration depth and the coherence length yields anisotropies of these length scales that are rather similar.
The field dependent effective anisotropies of various mixed state quantities are qualitatively well described by a crossover from a low field region, where the quantities are determined by similar contributions from the isotropic and the anisotropic bands, to a high field region, where they are (almost) determined by the bands alone. This crossover is due to the very low “intrinsic upper critical field of the bands” , an order of magnitude lower than the one (in direction) of the bands, because of the weaker superconductivity (smaller gap) in the bands. In decoupled and superconductors, there would be a sharp transition at , but the coupling between the two sets of band transforms this into a smooth crossover, which in addition may be qualitatively different for the gaps and the quasi-particle excitations in the vortex cores. This may also explain the qualitatively different forms of the field dependence of the anisotropy as observed for example in torque, small angle neutron scattering, and specific heat experiments.
The existence of different length scales for the two sets of bands, rather directly demonstrated for the coherence length (for example by scanning tunnelling spectroscopy and analysis of field dependent specific heat data), but not yet for the penetration depth (naturally, there is only one local field distribution for the whole of MgB2), strongly suggests that any phenomenological model should be extended to a two band version before being applied to the analysis of data obtained on MgB2 otherwise obtained “best fit” single band values of basic length scales will be effective values that acquire a field dependence due to the field dependence of the relative contributions of the two sets of bands, although the bands specific length scales likely are not field dependent. In the case of the London model, which was used so successfully for the analysis of torque, small angle neutron scattering, muon spin rotation, magnetization, and many other data measured e.g. on cuprate superconductors, it is rather unclear whether such an extension can be successful. This is so because of the large overlap of the bands vortex cores throughout most of the mixed state phase diagram, which violates a basic assumption of the London model. It is clear, that while the puzzling mixed state anisotropy effects may be understood on a qualitative level, there are still open questions concerning their more quantitative description.
From the study of cuprate superconductors is known that the mixed state can be strongly affected by thermal fluctuations and inevitably present material disorder, leading to phase diagrams containing more transition lines than the upper and lower critical fields. The material disorder leads for example to a destruction of the (quasi)ordered vortex lattice in fields lower than the upper critical field. This happens in an order-disorder transition, which was also observed in conventional superconductors, such as NbSe2. This transition, manifested by a peak in the critical current density with peculiar history effects is observed in MgB2 as well, by torque magnetometry, as well as various other measurements. MgB2 is interesting in terms of these additional “vortex matter” transitions as well, because of the intermediate importance of thermal fluctuations, compared to cuprate and conventional superconductors. A melting transition driven predominantly by thermal fluctuations has not been observed clearly in MgB2 so far though. We note that there are possible influences of the two band superconductivity on the non-equilibrium properties and these additional transitions of vortex matter as well. However, a direct influence has not been indicated by any experiment so far, and is thus left for future studies.
We would like to conclude this chapter by briefly commenting on the consequences of the results that were reviewed for applications of MgB2. The relatively high and critical current densities (not affected by “weak links” across boundaries), coupled with the easy and cheap processing (as compared to the high cuprate superconductors) has created also an intense technical interest in MgB2 [18]. However, the relatively large electronic anisotropy of the bands, which inevitable becomes the relevant anisotropy when the magnetic field is increased to values depressing the superconductivity in the isotropic bands, rather degrades the possibility of granular MgB2 material to carry high critical current densities in high magnetic fields: correspondingly, has been found to be a rapidly decreasing function of the applied magnetic field [3]. In high quality single crystals, magnetization curves are almost reversible in a wide region even at low temperature [see Fig. 11a)]. It will be important to maximize the pinning properties by increasing the disordered vortex phase, which is restricted to a small region below in clean material (see Fig. 15), through the controlled introduction of uncorrelated material defects. This increases the processing requirements for MgB2 based materials for high field applications. However, the potential of strongly affecting also the anisotropy by selectively tuning the intraband impurity scattering rates [91, 122] may lead to applicability enhancements that cannot yet be predicted.
Acknowledgements
We would like to thank J. Jun, J. Karpinski, and S. M. Kazakov of ETH Zürich, D. Di Castro, H. Keller, S. Kohout, and J. Roos of the University of Zürich, A. Wisniewski of the Polish Academy of Sciences, and P. Miranović of Okayama University for their help and comments during our collaborations at the time when the torque experiments being reviewed here were performed. We are grateful to D. Larbalestier and H. J. Choi for the permission to use figures from their papers [18, 15] (Figs. 1 and 2 in this chapter). MA would like to thank B. Batlogg and H. R. Ott for valuable comments he received during the preparation of his thesis [17], in which a large part of the torque results reviewed here was already presented, and furthermore F. Bouquet, A. Golubov, V. G. Kogan, and P. Miranović for fruitful discussions of various details of the general picture presented in this chapter and for the communication of calculated numerical data and formulas.
References
- [1] V. Russell, R. Hirst, F. A. Kanda, and A. J. King, Acta Cryst. 6, 870 (1953).
- [2] J. Nagamatsu, N. Nakagawa, T. Muranaka, Y. Zenitani, and J. Akimitsu, Nature 410, 63 (2001).
- [3] C. Buzea and T. Yamashita, Supercond. Sci. Technol. 14, R115 (2001).
- [4] The belief that the transition temperature of conventional phonon mediated superconductors was limited to some to was widespread. See for example High-Temperature Superconductivity, edited by V. L. Ginzburg and D. A. Kirzhnits (Consultants Bureau, New York, 1982); R. J. Cava, J. Am. Ceram. Soc. 83, 5 (2000). It should be mentioned, however, that in papers trying to theoretically calculate , it was generally cautioned that any such numerical limits can only be obtained for a given class of materials [see, e.g., W. L. McMillan, Phys. Rev. 167, 331 (1967)], while new classes of materials may have much higher . A relatively old idea concerning such a different material with much higher was for example the speculative metallic hydrogen [see, e.g., N. W. Ashcroft, Phys. Rev. Lett. 21, 1748 (1968)].
- [5] S. L. Bud’ko, G. Lapertot, C. Petrovic, C. E. Cunningham, N. Anderson, and P. C. Canfield, Phys. Rev. Lett. 86, 1877 (2001).
- [6] H. Kotegawa, K. Ishida, Y. Kitaoka, T. Muranaka, and J. Akimitsu, Phys. Rev. Lett. 87, 127001 (2001).
- [7] D. Di Castro, R. Khasanov, D. Eshchenko, A. Shengelaya, I. M. Savic, K. Conder, S. M. Kazakov, J. Karpinski, M. Angst, J. Roos, and H. Keller, in preparation.
- [8] See, e.g., H. Keller, Physica B 326, 283 (2003), and references therein.
- [9] H. Schmidt, J. F. Zasadzinski, K. E. Gray, and D. G. Hinks, Phys. Rev. B 63, 220504(R) (2001).
- [10] Y. Wang, T. Plackowski, and A. Junod, Physica C 355, 179 (2001).
- [11] F. Bouquet, R. A. Fisher, N. E. Phillips, D. G. Hinks, and J. D. Jorgensen, Phys. Rev. Lett. 87, 047001 (2001).
- [12] D. G. Hinks, H. Claus, and J. D. Jorgensen, Nature 411, 457 (2001).
- [13] A. Y. Liu, I. I. Mazin, and J. Kortus, Phys. Rev. Lett. 87, 087005 (2001).
- [14] H. J. Choi, D. Roundy, H. Sun, M. L. Cohen, and S. G. Louie, Phys. Rev. B 66, 020513(R) (2002).
- [15] H. J. Choi, D. Roundy, H. Sun, M. L. Cohen, and S. G. Louie, Nature 418, 758 (2002).
- [16] P. C. Canfield and G. W. Crabtree, Physics Today 56, 34 (2003).
-
[17]
M. Angst, PhD thesis, ETH Zürich, Switzerland, 2003. Available online at
http://e-collection.ethbib.ethz.ch/show?type=diss&nr=14887. - [18] D. Larbalestier, A. Gurevich, D. M. Feldmann, and A. Polyanskii, Nature 414, 368 (2001).
- [19] H. Suhl, B. T. Matthias, and L. R. Walker, Phys. Rev. Lett. 3, 552 (1959).
- [20] J. R. Carlson and C. B. Satterthwaite, Phys. Rev. Lett. 24, 461 (1970).
- [21] W. H. Butler and P. B. Allen, in Superconductivity in D- and F- Metals, edited by D. H. Douglass (Plenum, New York, 1976).
- [22] G. Binnig, A. Baratoff, H. E. Hoenig, and J. G. Bednorz, Phys. Rev. Lett. 45, 1352 (1980).
- [23] V. Z. Kresin and S. A. Wolf, Phys. Rev. B 41, 4278 (1990).
- [24] W. E. Pickett, Rev. Mod. Phys. 61, 433 (1989).
- [25] K. D. Belashchenko, M. van Schilfgaarde, and V. P. Antropov, Phys. Rev. B 64, 092503 (2001).
- [26] J. M. An and W. E. Pickett, Phys. Rev. Lett. 86, 4366 (2001).
- [27] J. Kortus, I. I. Mazin, K. D. Belashchenko, V. P. Antropov, and L. L. Boyer, Phys. Rev. Lett. 86, 4656 (2001).
- [28] K.-P. Bohnen, R. Heid, and B. Renker, Phys. Rev. Lett. 86, 5771 (2001).
- [29] Y. Kong, O. V. Dolgov, O. Jepsen, and O. K. Andersen, Phys. Rev. B 64, 020501(R) (2001).
- [30] T. Yildirim, O. Gülseren, J. W. Lynn, C. M. Brown, T. J. Udovic, Q. Huang, N. Rogado, K. A. Regan, M. A. Hayward, J. S. Slusky, T. He, M. K. Haas, P. Khalifah, K. Inumaru, and R. J. Cava, Phys. Rev. Lett. 87, 037001 (2001).
- [31] Its three natural electrons, plus the one it gained from magnesium.
- [32] L. Boeri, G. B. Bachelet, E. Cappelluti, and L. Pietronero, Phys. Rev. B 65, 214501 (2002).
- [33] A. Shukla, M. Calandra, M. d’Astuto, M. Lazzeri, F. Mauri, C. Bellin, M. Krisch, J. Karpinski, S. M. Kazakov, J. Jun, D. Daghero, and K. Parlinski, Phys. Rev. Lett. 90, 095506 (2003).
- [34] Recently, it was argued, that nonadiabatic effects due to closeness of the Fermi level to the top of the bands are important for the pairing in MgB2 and that nonadiabatic pairing is the primary source of the high . See E. Cappelluti, S. Ciuchi, C. Grimaldi, L. Pietronero, and S. Strässler, Phys. Rev. Lett. 88, 117003 (2002), and Ref. [32]. However, the absence of a boron isotope effect on the bands effective mass [7] points against the importance of nonadiabatic effects for the superconductivity in MgB2.
- [35] I. I. Mazin and V. P. Antropov, Physica C 385, 49 (2003).
- [36] It is quite well known for a long time that anisotropy in the pairing interaction raises : The notion that pairing anisotropy is beneficial to high appeared the first time, as an almost incidental remark, in Ref. [170]. A quite general theoretical study of interaction anisotropy and can be found, for example, in O. T. Valls and M. T. Béal-Monod, Phys. Rev. B 51, 8438 (1995).
- [37] A. A. Golubov and I. I. Mazin, Phys. Rev. B 55, 15146 (1997).
- [38] I. I. Mazin, O. K. Andersen, O. Jepsen, O. V. Dolgov, J. Kortus, A. A. Golubov, A. B. Kuz’menko, and D. van der Marel, Phys. Rev. Lett. 89, 107002 (2002).
- [39] E. A. Yelland, J. R. Cooper, A. Carrington, N. E. Hussey, P. J. Meeson, S. Lee, A. Yamamoto, and S. Tajima, Phys. Rev. Lett. 88, 217002 (2002).
- [40] A. Carrington, P. J. Meeson, J. R. Cooper, L. Balicas, N. E. Hussey, E. A. Yelland, S. Lee, A. Yamamoto, S. Tajima, S. M. Kazakov, and J. Karpinski, submitted to Phys. Rev. Lett., preprint on cond-mat/0304435.
- [41] H. Uchiyama, K. M. Shen, S. Lee, A. Damascelli, D. H. Lu, D. L. Feng, Z.-X. Shen, and S. Tajima, Phys. Rev. Lett. 88, 157002 (2002).
- [42] P. Szabó, P. Samuely, J. Kamarík, T. Klein, J. Marcus, D. Fruchart, S. Miraglia, C. Marcenat, and A. G. M. Jansen, Phys. Rev. Lett. 87, 137005 (2001).
- [43] F. Laube, G. Goll, J. Hagel, H. v. Lohneysen, D. Ernst, and T. Wolf, Europhys. Lett. 56, 296 (2001).
- [44] R. S. Gonnelli, D. Daghero, G. A. Ummarino, V. A. Stepanov, J. Jun, S. M. Kazakov, and J. Karpinski, Phys. Rev. Lett. 89, 247004 (2002).
- [45] F. Giubileo, D. Roditchev, W. Sacks, R. Lamy, and J. Klein, Europhys. Lett. 58, 764 (2002).
- [46] F. Giubileo, D. Roditchev, W. Sacks, R. Lamy, D. Thanh, J. Klein, S. Miraglia, D. Fruchart, J. Marcus, and P. Monod, Phys. Rev. Lett. 87, 177008 (2001).
- [47] M. Iavarone, G. Karapetrov, A. E. Koshelev, W. K. Kwok, G. W. Crabtree, D. G. Hinks, W. N. Kang, E.-M. Choi, H. J. Kim, H.-J. Kim, and S. I. Lee, Phys. Rev. Lett. 89, 187002 (2002).
- [48] M. R. Eskildsen, M. Kugler, S. Tanaka, J. Jun, S. M. Kazakov, J. Karpinski, and Ø. Fischer, Phys. Rev. Lett. 89, 187003 (2002).
- [49] S. Tsuda, T. Yokoya, T. Kiss, Y. Takano, K. Togano, H. Kito, H. Ihara, and S. Shin, Phys. Rev. Lett. 87, 177006 (2001).
- [50] H. Schmidt, J. F. Zasadzinski, K. E. Gray, and D. G. Hinks, Phys. Rev. Lett. 88, 127002 (2002).
- [51] X. Chen, M. Konstantinovic, J. Irwin, D. Lawrie, and J. Franck, Phys. Rev. Lett. 87, 157002 (2001).
- [52] J. W. Quilty, S. Lee, A. Yamamoto, and S. Tajima, Phys. Rev. Lett. 88, 087001 (2002).
- [53] S. Souma, Y. Machida, T. Sato, T. Takahashi, H. Matsui, S.-C. Wang, H. Ding, A. Kaminski, J. C. Campuzano, S. Sasaki, and K. Kadowaki, Nature 423, 65 (2003).
- [54] F. Bouquet, Y. Wang, R. A. Fisher, D. G. Hinks, J. D. Jorgensen, A. Junod, and N. E. Phillips, Europhys. Lett. 56, 856 (2001).
- [55] A. V. Sologubenko, J. Jun, S. M. Kazakov, J. Karpinski, and H. R. Ott, Phys. Rev. B 66, 014504 (2002).
- [56] A. A. Golubov, J. Kortus, O. V. Dolgov, O. Jepsen, Y. Kong, O. K. Andersen, B. J. Gibson, K. Ahn, and R. K. Kremer, J. Phys.: Cond. Mat. 14, 1353 (2002).
- [57] F. Simon, A. Jánossy, T. Fehér, F. Murányi, S. Garaj, L. Forró, C. Petrovic, S. L. Bud’ko, G. Lapertot, V. G. Kogan, and P. C. Canfield, Phys. Rev. Lett. 87, 047002 (2001).
- [58] S. L. Bud’ko, V. G. Kogan, and P. C. Canfield, Phys. Rev. B 64, 180506(R) (2001).
- [59] O. F. de Lima, R. A. Ribeiro, M. A. Avila, C. A. Cardoso, and A. A. Coelho, Phys. Rev. Lett. 86, 5974 (2001).
- [60] O. F. de Lima, C. A. Cardoso, R. A. Ribeiro, M. A. Avila, and A. A. Coelho, Phys. Rev. B 64, 144517 (2001).
- [61] G. Papavassiliou, M. Pissas, M. Fardis, M. Karayanni, and C. Christides, Phys. Rev. B 65, 012510 (2002).
- [62] K. H. P. Kim, J.-H. Choi, C. U. Jung, P. Chowdhury, H.-S. Lee, M.-S. Park, H.-J. Kim, J. Y. Kim, Z. Du, E.-M. Choi, M.-S. Kim, W. N. Kang, S.-I. Lee, G. Y. Sung, and J. Y. Lee, Phys. Rev. B 65, 100510(R) (2002).
- [63] M. Xu, H. Kitazawa, Y. Takano, J. Ye, K. Nishida, H. Abe, A. Matsushita, and G. Kido, Appl. Phys. Lett. 79, 2779 (2001).
- [64] S. Lee, H. Mori, T. Masui, Y. Eltsev, A. Yamamoto, and S. Tajima, J. Phys. Soc. Jpn. 70, 2255 (2001).
- [65] A. K. Pradhan, Z. X. Shi, M. Tokunaga, T. Tamegai, Y. Takano, K. Togano, H. Kito, and H. Ihara, Phys. Rev. B 64, 212509 (2001).
- [66] M. Tinkham, Introduction to Superconductivity (McGraw Hill, New York, 1996).
- [67] In fact, in the microscopic derivations of the anisotropic Ginzburg-Landau theory, the effective mass tensor is given by , where denotes an average over the Fermi surface, and describes the dependence of the superconducting gap. Therefore, the effective mass tensor components actually entering the GL free energy functional are not identical to the band effective masses. See Ref. [71].
- [68] V. L. Ginzburg and L. D. Landau, Zh. Eksp. Teor. Fiz. 20, 1064 (1950).
- [69] V. L. Ginzburg, Zh. Eksp. Teor. Fiz. 23, 236 (1952).
- [70] C. Caroli, P. G. De Gennes, and J. Matricon, Phys. Konden. Mater. 1, 176 (1963).
- [71] L. P. Gor’kov and T. K. Melik-Barkhudarov, Zh. Eksperim. i Teor. Fiz. 45, 1493 (1963), [English transl.: Soviet Phys. JETP 18, 1031 (1964)].
- [72] D. R. Tilley, Proc. Phys. Soc. London 86, 678 (1965); 86, 678 (1965).
- [73] G. Blatter, V. B. Geshkenbein, and A. I. Larkin, Phys. Rev. Lett. 68, 875 (1992).
- [74] Y. Muto, K. Noto, H. Nakatsuji, and N. Toyota, Nuovo Cimento B 38, 503 (1977).
- [75] K. Takanaka, Phys. Stat. Sol. B 68, 623 (1975).
- [76] H. Teichler, Phys. Stat. Sol. B 72, 211 (1975).
- [77] M. Angst, R. Puzniak, A. Wisniewski, J. Jun, S. M. Kazakov, J. Karpinski, J. Roos, and H. Keller, Phys. Rev. Lett. 88, 167004 (2002).
- [78] J. Karpinski, M. Angst, J. Jun, S. M. Kazakov, R. Puzniak, A. Wisniewski, J. Roos, H. Keller, A. Perucchi, L. Degiorgi, M. R. Eskildsen, P. Bordet, L. Vinnikov, and A. Mironov, Supercond. Sci. Technol. 16, 221 (2003).
- [79] M. Angst, R. Puzniak, A. Wisniewski, J. Roos, H. Keller, P. Miranović, J. Jun, S. M. Kazakov, and J. Karpinski, Physica C 385, 143 (2003).
- [80] M. Angst, D. Di Castro, R. Puzniak, A. Wisniewski, J. Jun, S. M. Kazakov, J. Karpinski, S. Kohout, and H. Keller, submitted to Physica C, prepreint on cond-mat/0304400.
- [81] A. V. Sologubenko, J. Jun, S. M. Kazakov, J. Karpinski, and H. R. Ott, Phys. Rev. B 65, 180505(R) (2002).
- [82] S. L. Bud’ko and P. C. Canfield, Phys. Rev. B 65, 212501 (2002).
- [83] Y. Eltsev, S. Lee, K. Nakao, N. Chikumoto, S. Tajima, N. Koshizuka, and M. Murakami, Phys. Rev. B 65, 140501(R) (2002).
- [84] C. Ferdeghini, V. Ferrando, V. Braccini, M. R. Cimberle, D. Marré, P. Manfrinetti, A. Palenzona, and M. Putti, Eur. Phys. J. B 30, 147 (2002).
- [85] M. Zehetmayer, M. Eisterer, J. Jun, S. M. Kazakov, J. Karpinski, A. Wisniewski, and H. W. Weber, Phys. Rev. B 66, 052505 (2002).
- [86] L. Lyard, P. Samuely, P. Szabo, T. Klein, C. Marcenat, L. Paulius, K. H. P. Kim, C. U. Jung, H.-S. Lee, B. Kang, S. Choi, S.-I. Lee, J. Marcus, S. Blanchard, A. G. M. Jansen, U. Welp, G. Karapetrov, and W. K. Kwok, Phys. Rev. B 66, 180502(R) (2002).
- [87] U. Welp, G. Karapetrov, W. K. Kwok, G. W. Crabtree, C. Marcenat, L. Paulius, T. Klein, J. Marcus, K. H. P. Kim, C. U. Jung, H.-S. Lee, B. Kang, and S.-I. Lee, Phys. Rev. B 67, 012505 (2003).
- [88] Y. Machida, S. Sasaki, H. Fujii, M. Furuyama, I. Kakeya, and K. Kadowaki, Phys. Rev. B 67, 094507 (2003).
- [89] A. I. Posazhennikova, T. Dahm, and K. Maki, Europhys. Lett. 60, 134 (2002).
- [90] P. Miranović, K. Machida, and V. G. Kogan, J. Phys. Soc. Jpn. 72, 221 (2003).
- [91] A. Gurevich, Phys. Rev. B in print (1 May 2003 issue), preprint on cond-mat/0212129.
- [92] T. Dahm and N. Schopohl, cond-mat/0212188.
- [93] A. A. Golubov and A. E. Koshelev, submitted to Phys. Rev. B, preprint on cond-mat/0303237.
- [94] Four MgB2 single crystals were used in all torque studies, labeled A, B, C, and D, throughout this chapter. Crystal A with the smallest volume of about was measured in the home made torque magnetometer with a maximum field of and shaking option. Crystals B and C were measured with the Quantum Design PPMS with torque option, operating with fields up to . Crystal D was measured in the same magnetometer as crystal A, but using a capacitive torque sensor [C. Rossel, M. Willemin, A. Gasser, H. Bothuizen, G. I. Meijer, and H. Keller, Rev. Sci. Instrum. 69, 3199 (1998)] instead of a piezoresistive one.
- [95] J. Karpinski, S. M. Kazakov, J. Jun, M. Angst, R. Puzniak, A. Wisniewski, and P. Bordet, Physica C 385, 42 (2003).
- [96] M. Angst, R. Puzniak, A. Wisniewski, J. Jun, S. M. Kazakov, and J. Karpinski, Phys. Rev. B 67, 012502 (2003).
- [97] M. Willemin, C. Rossel, J. Brugger, M. H. Despont, H. Rothuizen, P. Vettiger, J. Hofer, and H. Keller, J. Appl. Phys. 83, 1163 (1998).
- [98] M. Willemin, C. Rossel, J. Hofer, H. Keller, A. Erb, and E. Walker, Phys. Rev. B 58, R5940 (1998).
- [99] M. Willemin, A. Schilling, H. Keller, C. Rossel, J. Hofer, U. Welp, W. K. Kwok, R. J. Olsson, and G. W. Crabtree, Phys. Rev. Lett. 81, 4236 (1998).
- [100] Form and angular regime of the deviation from a straight line are incompatible with a superconducting signal, because the maximum of a superconducting signal would be much closer to for an anisotropic superconductor.
- [101] This is what justifies our AGLT based analysis a posteriori. Note that closer to , there are deviations of the angular dependence of from AGLT predictions [Eq. (5)]. This is discussed later.
- [102] Note that there are at least two inequivalent definitions of the Ginzburg number used in the literature. Throughout this thesis, we use the definition also used in Ref. [105].
- [103] E. M. Forgan, S. J. Levett, P. G. Kealey, R. Cubitt, C. D. Dewhurst, and D. Fort, Phys. Rev. Lett. 88, 167003 (2002).
- [104] V. V. Eremenko, V. A. Sirenko, Y. A. Shabakayeva, R. Schleser, and P. L. Gammel, Low Temp. Phys. 28, 6 (2002).
- [105] G. P. Mikitik and E. H. Brandt, Phys. Rev. B 64, 184514 (2001).
- [106] T. Schneider and J. M. Singer, Phase Transition Approach to High Temperature Superconductivity (Imperial College Press, London, 2000).
- [107] P. A. Lee and S. R. Shenoy, Phys. Rev. Lett. 28, 1025 (1972).
- [108] S. Ullah and A. T. Dorsey, Phys. Rev. Lett. 65, 2066 (1990).
- [109] U. Welp, S. Fleshler, W. K. Kwok, R. A. Klemm, V. M. Vinokur, J. Downey, B. Veal, and G. W. Crabtree, Phys. Rev. Lett. 67, 3180 (1991).
- [110] N. K. Wilkin and M. A. Moore, Phys. Rev. B 48, 3464 (1993).
- [111] I. D. Lawrie, Phys. Rev. B 50, 9456 (1994).
- [112] A. Dulcic, M. Pozek, D. Paar, E.-M. Choi, H.-J. Kim, W. N. Kang, and S.-I. Lee, Phys. Rev. B 67, 020507(R) (2003).
- [113] A. Buzdin and D. Feinberg, Physica C 220, 74 (1992).
- [114] Since the function is not fixed for different angles of anisotropic superconductors and depends slightly on the angle [J. M. Calero, J. C. Granada, and E. Z. da Silva, Phys. Rev. B 56 6114 (1997)] in order to get very accurate experimental data of , reliable e.g. for the discussion of tiny details of the deviation of from the anisotropic Ginzburg-Landau angular dependence [80], the angular dependence of should be taken into account in the determination of .
- [115] The upper critical field dataset of crystal C is not complete, at , the datasets of the two crystals also agree, within error bars.
- [116] P. Miranović, private communication.
- [117] The determination of from electrical transport measurements is problematic in the case of MgB2. In Ref. [86], a criterion was chosen that gave values matching those determined by specific heat and ac susceptibility measured on the same crystal (for and ). This criterion is different from the onset criterion chosen in earlier studies.
- [118] We note that the parameter values for which best agreement with Ref. [93] is seen are - higher than those of the AGLT “best fit”.
- [119] E. Helfand and N. R. Werthamer, Phys. Rev. 147, 288 (1966).
- [120] J. R. Cooper, private communication.
- [121] K. D. Usadel, Phys. Rev. Lett. 25, 507 (1970).
- [122] R. A. Ribeiro, S. L. Bud’ko, C. Petrovic, and P. C. Canfield, Physica C 384, 227 (2003).
- [123] A. Perucchi, L. Degiorgi, J. Jun, M. Angst, and J. Karpinski, Phys. Rev. Lett. 89, 097001 (2002).
- [124] A. E. Koshelev and A. A. Golubov, Phys. Rev. Lett. 90, 177002 (2003).
- [125] F. Bouquet, Y. Wang, I. Sheikin, T. Plackowski, A. Junod, S. Lee, and S. Tajima, Phys. Rev. Lett. 89, 257001 (2002).
- [126] V. G. Kogan, Phys. Rev. B 66, 020509 (2002).
- [127] A. A. Golubov, A. Brinkman, O. V. Dolgov, J. Kortus, and O. Jepsen, Phys. Rev. B 66, 054524 (2002).
- [128] A. Brinkman, A. A. Golubov, and H. Rogalla, Phys. Rev. B 65, 180517(R) (2002).
- [129] F. Manzano and A. Carrington, Phys. Rev. Lett. 88, 047002 (2002).
- [130] G. K. Perkins, J. Moore, Y. Bugoslavsky, L. F. Cohen, J. Jun, S. M. Kazakov, J. Karpinski, and A. D. Caplin, Supercond. Sci. Technol. 15, 1156 (2002).
- [131] E. Zeldov, A. I. Larkin, M. Konczykowski, B. Khaykovich, D. Majer, V. B. Geshkenbein, and V. M. Vinokur, Physica C 235-240, 2761 (1994).
- [132] D. E. Farrell, C. M. Williams, S. A. Wolf, N. P. Bansal, and V. G. Kogan, Phys. Rev. Lett. 61, 2805 (1988).
- [133] D. E. Farrell, S. Bonham, J. Foster, Y. C. Chang, P. Z. Jiang, K. G. Vandervoort, D. J. Lam, and V. G. Kogan, Phys. Rev. Lett. 63, 782 (1989).
- [134] D. Zech, C. Rossel, L. Lesne, H. Keller, S. L. Lee, and J. Karpinski, Phys. Rev. B 54, 12535 (1996).
- [135] J. Hofer, J. Karpinski, M. Willemin, G. I. Meijer, E. M. Kopnin, R. Molinski, H. Schwer, C. Rossel, and H. Keller, Physica C 297, 103 (1998).
- [136] V. G. Kogan, Phys. Rev. B 24, 1572 (1981).
- [137] V. G. Kogan, M. M. Fang, and S. Mitra, Phys. Rev. B 38, 11958 (1988).
- [138] V. G. Kogan, Phys. Rev. B 38, 7049 (1988).
- [139] Z. Hao and J. R. Clem, Phys. Rev. Lett. 67, 2371 (1991).
- [140] Z. Hao and J. R. Clem, Phys. Rev. B 43, 7622 (1991).
- [141] M. Angst, R. Puzniak, A. Wisniewski, J. Roos, H. Keller, and J. Karpinski, submitted to Phys. Rev. B, preprint on cond-mat/0206407.
- [142] E. H. Brandt and G. P. Mikitik, Phys. Rev. Lett. 89, 027002 (2002); G. P. Mikitik and E. H. Brandt, Phys. Rev. B 67, 104511 (2003).
- [143] Only in the case of the lowest temperatures and fields measured there was a small irreversibility remaining even after shaking, always limited to angles in the interval from to . In these cases, the data within the interval from to were excluded from the analysis with Eq. (9).
- [144] K. Takahashi, T. Atsumi, N. Yamamoto, M. Xu, H. Kitazawa, and T. Ishida, Phys. Rev. B 66, 012501 (2002).
- [145] For , is generalized to mean the anisotropy of the coherence lengths .
- [146] V. G. Kogan, Phys. Rev. Lett. 89, 237005 (2002).
- [147] Note that these correspond to the in Ref. [146].
- [148] N. Nakai, M. Ichioka, and K. Machida, J. Phys. Soc. Jpn. 71, 23 (2002).
- [149] M. Yethiraj, H. A. Mook, G. D. Wignall, R. Cubitt, E. M. Forgan, S. L. Lee, D. M. Paul, and T. Armstrong, Phys. Rev. Lett. 71, 3019 (1993).
- [150] L. J. Campbell, M. M. Doria, and V. G. Kogan, Phys. Rev. B 38, 2439 (1988).
- [151] R. Cubitt, S. Levett, S. L. Bud’ko, N. E. Anderson, and P. C. Canfield, Phys. Rev. Lett. 90, 157002 (2003).
- [152] M. R. Eskildsen, private communication.
- [153] E. Babaev, Phys. Rev. Lett. 89, 067001 (2002).
- [154] A. Gurevich and V. M. Vinokur, Phys. Rev. Lett. 90, 047004 (2003).
- [155] A. Schilling, R. A. Fisher, N. E. Phillips, U. Welp, D. Dasgupta, W. K. Kwok, and G. W. Crabtree, Nature 382, 791 (1996).
- [156] T. Giamarchi and P. Le Doussal, Phys. Rev. Lett. 72, 1530 (1994).
- [157] B. Khaykovich, E. Zeldov, D. Majer, T. W. Li, P. H. Kes, and M. Konczykowski, Phys. Rev. Lett. 76, 2555 (1996).
- [158] D. Giller, A. Shaulov, R. Prozorov, Y. Abulafia, Y. Wolfus, L. Burlachkov, Y. Yeshurun, E. Zeldov, V. M. Vinokur, J. L. Peng, and R. L. Greene, Phys. Rev. Lett. 79, 2542 (1997).
- [159] We follow convention and treat melting and order-disorder transition separately, although there is evidence that they form one line of phase transitions, which just changes character from thermally driven to disorder driven. See N. Avraham et al., Nature 411, 451 (2001).
- [160] G. Ravikumar, V. C. Sahni, A. K. Grover, S. Ramakrishnan, P. L. Gammel, D. J. Bishop, E. Bucher, M. J. Higgins, and S. Bhattacharya, Phys. Rev. B 63, 024505 (2001).
- [161] M. Marchevsky, M. J. Higgins, and S. Bhattacharya, Nature 409, 591 (2001).
- [162] X. S. Ling, S. R. Park, B. A. McClain, S. M. Choi, D. C. Dender, and J. W. Lynn, Phys. Rev. Lett. 86, 712 (2001).
- [163] See e.g. M. Angst, S. M. Kazakov, J. Karpinski, A. Wisniewski, R. Puzniak, and M. Baran , Phys. Rev. B 65, 094518 (2002), and references therein.
- [164] S. B. Roy, P. Chaddah, and S. Chaudhary, Phys. Rev. B 62, 9191 (2000).
- [165] M. Pissas, S. Lee, A. Yamamoto, and S. Tajima, Phys. Rev. Lett. 89, 097002 (2002).
- [166] A criterion was used for defining .
- [167] C. P. Bean, Phys. Rev. Lett. 8, 250 (1962).
- [168] R. Puzniak et al., unpublished.
- [169] See, e.g., S. S. Banerjee, N. G. Patil, S. Ramakrishnan, A. K. Grover, S. Bhattacharya, P. K. Mishra, G. Ravikumar, T. V. C. Rao, V. C. Sahni, M. J. Higgins, C. V. Tomy, G. Balakrishnan, and D. M. Paul, Phys. Rev. B 59, 6043 (1999).
- [170] D. Markowitz and L. P. Kadanoff, Phys. Rev. 131, 563 (1963).