Permanent address: ]Laboratoire d’Optique des Solides, CNRS and Université Pierre and Marie Currie, T13-C80, 4 pl. Jussieu, F-75252 Paris - Cedex 05, France
Equation of state and phonon frequency calculations of diamond at high pressures.
Abstract
The pressure-volume relationship and the zone-center optical phonon frequency of cubic diamond at pressures up to 600 GPa have been calculated based on Density Functional Theory within the Local Density Approximation and the Generalized Gradient Approximation. Three different approaches, viz. a pseudopotential method applied in the basis of plane waves, an all-electron method relying on Augmented Plane Waves plus Local Orbitals, and an intermediate approach implemented in the basis of Projector Augmented Waves have been used. All these methods and approximations yield consistent results for the pressure derivative of the bulk modulus and the volume dependence of the mode Grüneisen parameter of diamond. The results are at variance with recent precise measurements up to 140 GPa. Possible implications for the experimental pressure determination based on the ruby luminescence method are discussed.
pacs:
PACS: 71.15.Nc, 63.20.-e, 62.50.+pI Introduction
Diamond is the archetype of the covalently bonded, tetrahedrally coordinated insulators. It’s extreme hardness is highly valued in technology and is also exploited in high pressure research when using the diamond anvil cell. The elastic properties of diamond near ambient conditions are well characterized through ultrasonic and Brillouin techniques. However, as a consequence of the small compressibility, the changes in elastic properties under high hydrostatic pressure are not well confined experimentally. This, for instance, applies to the variation of the bulk modulus with pressure , , a basic parameter in the equation-of-state (EOS) modelling. A property closely related to the compression behavior of diamond is the pressure-induced frequency shift of the threefold degenerate F2g zone-center optical phonon mode; its shift with pressure provides an approximate measure of the change in relative density, because the mode Grüneisen parameter is close to oneMitra69 ; Whalley76 ; Grims78 ; Hanfl85b .
High-pressure x-ray diffraction experimentsAleks87 ; Gille99 ; Occelli02 yield the ambient-pressure bulk modulus in good agreement with acoustic measurementsMcSki72 ; Grims75 ; Ramda93 ; Vogel96 ; Zoubo98 . The analysis of diffraction data is usually based on adopting obtained from ultrasonic measurements up to 0.2 GPaMcSki72 . The only exception is the recent diffraction study of diamond to 140 GPa by Occelli et al.Occelli02 , who report , at variance with the ultrasonic measurement. It was subsequently arguedHolza02 that the ruby pressure calibrationMao86 employed in the diffraction work of Ref. [Occelli02, ] may need a revision. If so, the pressure shift of the F2g phonon frequency, also studied by Occelli et al. up to 140 GPa, should be affected in a similar manner. The F2g phonon mode behavior at high pressures was frequently studied by Raman spectroscopyMitra69 ; Whalley76 ; Grims78 ; Hanfl85b ; Boppa85 ; Aleks87 ; Gonch85 ; Aleks86 ; Tardi90 ; Muino94 ; Schif97 and its possible role in pressure calibration was addressed early onHanfl85b ; Aleks87 ; Sherm85 .
We report the calculation of the EOS and optical phonon frequency of diamond at high pressures within Density Functional Theory (DFT). Extensive theoretical work on diamond under pressure by ab initio methods has addressed changes in bonding, elasticity, lattice dynamics, thermodynamical properties, phase stability, and electronic excitations, see, e.g., Refs. [Zunger77, ; Yin83, ; Cheli84, ; Cohen85, ; Cheli87, ; Hanfl85b, ; Niels86, ; Cardo86, ; Fahy87, ; Fahy87a, ; Fahy87b, ; Fahy88, ; Mailh91, ; Vanca92, ; Pavon93, ; Willa94, ; Clark95, ; Scand96, ; Serra98, ; Xie99, ; Wu99, ; Zhao99, ]. Here, we are interested in a specific question: What are, based on different implementations and approximations of DFT, the constraints on of diamond and on the nonlinear pressure shift of the optical phonon frequency. The calculated values of reported in the literature scatter by about 25%, spanning a range similar to that of the experimental results. Calculated pressure effects on the optical phonon frequency were reported in Refs. [Hanfl85b, ] and [Niels86, ]. Results of a more recent calculationWu99 show some disagreement with Refs. [Hanfl85b, ] and [Niels86, ]. In view of new experimental resultsOccelli02 and the – at least apparent – uncertainties in the previous theoretical predictions we considered it worthwhile to revisit the calculation of the EOS and optical phonon frequency of diamond under pressure, combined with accurate procedures to extract the parameters of interest.
II Details of the calculations
The total energy calculations performed in this work are based on DFTHohenberg64 within, on one hand, the Local Density ApproximationKohn65 (LDA) and, on the other hand, the Generalized Gradient ApproximationPW92 ; PBE96 (GGA). In order to grasp the uncertainties consequent to the choice of the computational method and of its inherent assumptions, we are using simultaneously three different approaches, viz. the pseudopotential method applied in the basis of plane wavesGonze02 ; Goe97 ; PTAA92 ; Gon96 (PW), an all-electron method relying on the Augmented Plane Waves plus Local Orbitalssoft:WIEN2k ; SNS00 ; MBSS01 (APW+lo), and an intermediate approach implemented in the basis of Projector Augmented Wavessoft:VASP-short ; Kress99 (PAW); the latter approachBloch94 treats the valence states as part of an all-electron problem and describes them by all-electron wave-functions.
The pseudopotential employed is the “dual-space” separable pseudopotential of Hartwigsen, Goedecker, and HutterHartw98 and its GGA counterpart constructed by X. GonzeGonze02 ; Gonze ; the PAW potentials were constructed by G. Kresse and denoted as C_h in Ref. [soft:VASP-short, ]. All methods take into account scalar-relativistic corrections (though no meaningful contribution expected in diamond), either explicitly (APW+lo) or through the construction of the (pseudo-)potentials.
The numerical convergence of all three methods, with respect to the size of the basis set and k-space sampling was thoroughly tested. The plane-wave cutoffs of 75 Hartree and 1500 eV were applied with, respectively, the PW and the PAW-basis. These rather large values are required for getting reliable results for the pressure which is calculated analytically, in both approaches, with the aid of the stress theoremNielsen83 ; Nielsen85 . In the APW+lo method a muffin-tin radius of a.u. was used. The plane-wave expansion was limited by and the charge density Fourier expansion by Ry1/2. In the APW+lo method the results were generated from fitted as described below.
The integration over the Brillouin zone is performed using the same set of 28 k-points in the irreducible wedge in both plane-wave based approaches; the set was generated by the “special points” approach Monkh76 using a mesh with 4 different fractional shifts. In the APW+lo approach the tetrahedron integration was employedJA71 ; BJA94 , based on a uniform, -centered mesh of 47 k-points.
The frozen-phonon approach, which consists in the evaluation of the total energy of the crystal with frozen-in atomic displacements, was applied (in the two plane-wave based methods only) with the same cutoffs and with the same k-point mesh ( + 4 shifts) which, due to the lowered symmetry, results in a 91 k-points set. Small displacements and with = 0.002 were applied to the two atoms of the basis – thus either compressing or stretching the C(1) – C(2) bond, like in the zone-center F2g mode – and the two values obtained for [viz. the (outward) and (inward)] were averaged. The eigenfrequency is then found from the expression for the energy of a harmonic oscillator
| (1) |
where is the atomic mass. The above-mentioned averaging procedure of the (outward) and (inward) eliminates the cubic contribution to . It turns out that the remaining quartic anharmonicity is small at and contributes to the uncertainty of the resulting eigenfrequencies by less than 0.1 cm-1 (checked by repeating the same calculations with displacements =0.0015 and 0.003).
Total energies, pressures, and phonon frequencies were calculated at 12 different volumes ranging from 6.35 Å3/atom down to 3.35 Å3/atom, i.e., for about 10% volume expansion to 40% compression relative to the experimental equilibrium volume of 5.6725 Å3/atom at 300 K Sato02 . The lower volume limit corresponds to roughly 600 GPa maximum pressure.
III Pressure-volume relationship
III.1 Analytical form
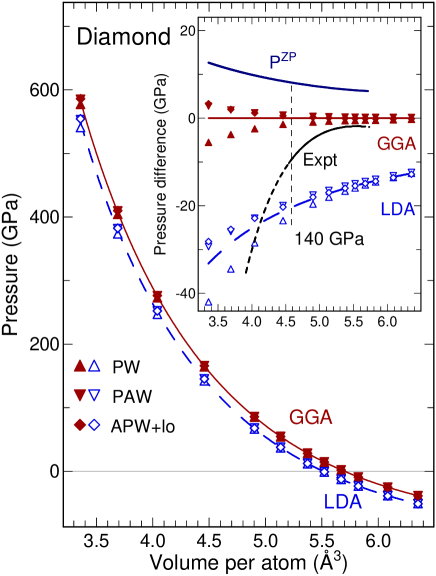
Figure 1 shows calculated pressures as a function of volume. An excellent consistency of the data points obtained by the three different methods is immediately apparent. Also, the present results substantiate the claims made in Ref. [Kress99, ] concerning the equivalence of the PAW approach with all-electron methods such as that of Ref. [soft:WIEN2k, ].
The proper analysis of the results yields the equilibrium properties , , and (throughout this manuscript the subscript ’zero’ refers to zero (ambient) pressure or equilibrium volume, either calculated or experimental depending on context). One also needs to identify an analytical form of the behavior which, using the above parameters, fits the calculated pressures over the full volume range.
We have tried several of the common equation-of-state formsMurna44 ; Birch78 ; Vinet86 ; Holza96 . The best analytical expression, in the least-squares sense, was identified as
| (2) |
where , , and . With Eq. 2 is a blend of the VinetVinet86 (or RydbergStace81 ; Gaura02 ) form and the HolzapfelHolza96 expression, for which and , respectively. Actually, the parameter varies between 3.4 and 3.6 for individual sets of calculated data of diamond. Without loss of significant digits in the fitted parameters of interest, we fix at a value of 7/2; in this case the energy versus volume relation, obtained by integration of Eq. 2, can be written without invoking special functions other than the error function:
| (3) | |||||
Here, is the energy at . Equation 2 was used to fit the results obtained via the stress theorem (PW and PAW methods), while Eq. 3 served to determine the EOS parameters from total energies (APW+lo method). For the PW and PAW methods it was carefully checked that the directly calculated data are consistent with those obtained by differentiation of . For all sets of calculated or data the rms deviations were less than 0.04 GPa or 0.05 meV, respectively.
Aleksandrov et al.Aleks87 pointed out that a quadratic dependence of pressure on change in relative density , written as
| (4) |
applies in the case of diamond for GPa. This expression is found to fit the calculated results up to 600 GPa quite well. It is only in the statistical sense that Eq. 4 is slightly inferior to Eq. 2, i.e., the rms deviations are larger by a factor of two, but this is not relevant for the present discussion. The bulk modulus, obtained by differentiation of Eq. 4 with respect to normalized volume, is given by
| (5) |
Équation 5 corresponds to a quadratic dependence of the bulk modulus on relative change in density.
| Method | n | |||||||
|---|---|---|---|---|---|---|---|---|
| Å3 | GPa | cm-1 | cm-1/GPa | |||||
| All LDA | 5.510(5) | 465(3) | 3.63(3) | 7/2 | 1322(2) | 1.003(3) | 0.79(5) | 2.87 |
| All GGA | 5.697(4) | 433(2) | 3.67(3) | 7/2 | 1290(2) | 0.995(3) | 0.80(5) | 3.00 |
| GGA&LDA normalized | 1 | 1 | 3.65(5) | 7/2 | 1 | 1.000(5) | 0.80(5) | |
| Expt. =300 K | 5.6725111Ref. [Sato02, ]. | 442222Ref. [McSki72, ]; ultrasonic experiments up to 0.2 GPa. | 4.0(5)222Ref. [McSki72, ]; ultrasonic experiments up to 0.2 GPa. | 1332.5 | 0.962(15)333Experimental mode Grüneisen parameters reported in the literature [Mitra69, ; Whalley76, ; Grims78, ; Hanfl85b, ; Boppa85, ; Aleks86, ; Aleks87, ; Tardi90, ] vary between 0.90 to 1.06. | 2.90(5)444’Best’ value in the literature according to Ref. [Schif97, ]. | ||
| 444.8(8)555Ref. [Vogel96, ]; Brillouin and Raman scattering. | 1332.40(5)555Ref. [Vogel96, ]; Brillouin and Raman scattering. | 1.00(3)666Value obtained for a revised linear pressure coefficient of the ruby line shift as explained in the text. | 3.00(10)666Value obtained for a revised linear pressure coefficient of the ruby line shift as explained in the text. | |||||
| 5.674(1)777Ref. [Occelli02, ]; x-ray diffraction (Vinet fit) and Raman scattering up to 140 GPa. The mode Grüneisen parameter is the average for the pressure range 0–140 GPa. | 446(1)777Ref. [Occelli02, ]; x-ray diffraction (Vinet fit) and Raman scattering up to 140 GPa. The mode Grüneisen parameter is the average for the pressure range 0–140 GPa. | 3.0(1)777Ref. [Occelli02, ]; x-ray diffraction (Vinet fit) and Raman scattering up to 140 GPa. The mode Grüneisen parameter is the average for the pressure range 0–140 GPa. | 2 | 1333777Ref. [Occelli02, ]; x-ray diffraction (Vinet fit) and Raman scattering up to 140 GPa. The mode Grüneisen parameter is the average for the pressure range 0–140 GPa. | =0.97777Ref. [Occelli02, ]; x-ray diffraction (Vinet fit) and Raman scattering up to 140 GPa. The mode Grüneisen parameter is the average for the pressure range 0–140 GPa. | 2.83777Ref. [Occelli02, ]; x-ray diffraction (Vinet fit) and Raman scattering up to 140 GPa. The mode Grüneisen parameter is the average for the pressure range 0–140 GPa. | ||
| Expt. 0 K | 5.6707111Ref. [Sato02, ]. | 445999Estimated value, see text. | 1332.70(3) | |||||
| Static lattice | 5.5886888Ref. [Herre00, ]; the classical limit in path integral Monte Carlo simulations. | 469999Estimated value, see text. | ||||||
| 5.6122101010Ref. [Vogel96, ]; based on extrapolation of isotope effects. | 462999Estimated value, see text. |
III.2 Calculated EOS parameters
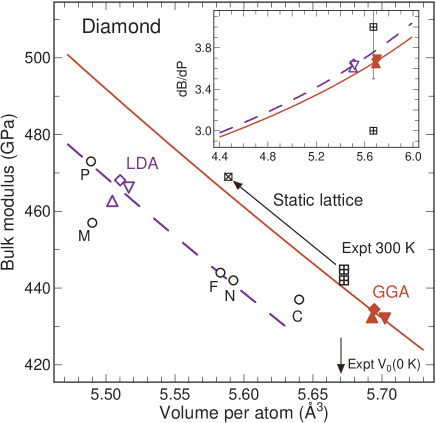
The obtained pairs of (,) values are displayed in Fig. 2. Within a given approximation for the exchange-correlation functional (GGA or LDA), the three methods employed here (PW, PAW, APW+lo) yield results for and which are in very good agreement with each other. The choice of the exchange-correlation functional, however, leads to differences of 4% in and 5% in , reflecting in part the well-known overbinding of the LDA. All values (cf. inset to Fig. 2) fall into a narrow range between 3.6 and 3.7 , the difference between averaged LDA and GGA results being close to 1%.
Since the calculated EOS parameters clearly split into two groups, i.e. the GGA and LDA results, with nearly identical parameter values within each group, we have combined the points for GGA and LDA, respectively, to obtain the GGA and LDA parameters , , and listed in Table 1. The corresponding relations are shown by solid and broken lines in Fig. 1, where the inset illustrates deviations of individual calculated results from the average curves. Similarly, the solid and broken lines in Fig. 2 and its inset show the corresponding volume dependences of the bulk modulus and its pressure derivative.
The larger value for LDA compared to GGA correlates with the smaller equilibrium volume. However, the curve for LDA falls below that for GGA (see Fig. 2). This also applies to values obtained in other self-consistent LDA calculations for diamond Niels86 ; Fahy87 ; Mailh91 ; Pavon93 (represented by open circles in Fig. 2).
III.3 Zero-point motion effects
The calculated results for and should be compared to experimental properties after ’correction’ for vibrational effects. Thermal effects are almost negligible at 300 K because of the high Debye temperature of diamond (2000 K), but zero-point motion needs to be considered. According to Monte Carlo simulationsHerre00 the static-lattice equilibrium volume for diamond is about 5.59 Å3. All the data for shown in Fig. 2 fall into a range of % around this value. The static-lattice bulk modulus at Å3 is estimated to be 469 GPa (this follows from the experimental values of and and the calculated ). Thus, relative to static-lattice properties, the GGA results cannot be considered superior to the LDA ones; they appear better when compared to experimental data because the GGA errors happen to mimic the zero-point effects.
The zero-point vibrational pressure , i.e., the isochoric change in pressure when zero-point motion is switched on, is about 6 GPa at the static-lattice value of Herre00 . An approximate relation for the volume dependence of is
where is the isobaric volume expansion due to zero-point motion. For getting within the quasi-harmonic thermodynamics, we simply refer to the calculated pressure dependence of the zero-point expansion presented in Fig. 10 of Ref. [Herre00, ]. The corresponding volume dependence of is displayed in the inset of Fig. 1. increases by about 6 GPa at 600 GPa. Adding such small changes in to the calculated results leads to an increase of the values by about 1%, but would not affect the calculated values (within the estimated uncertainty of the optimum value given below).
III.4 The essence of the EOS calculations
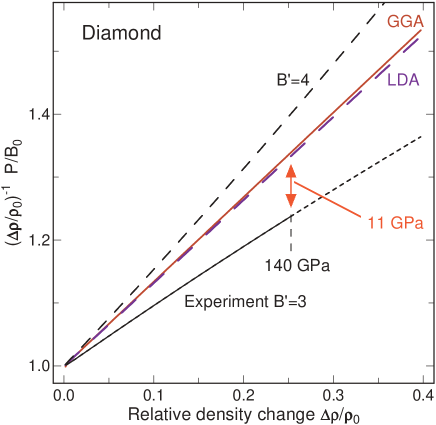
In Fig. 3, the calculated relations are plotted in reduced coordinates, i.e. pressure normalized by as a function of . In this representation small differences in ambient-pressure volumes and bulk moduli are suppressed and a linear slope corresponds to a quadratic dependence of pressure on change in relative density (Eq. 4). The LDA and GGA results hardly differ in slope. In this way, Fig. 3 illustrates the main information we extract from our EOS calculations for diamond:
(1) The value of does not depend much on crystal potential and basis set issues and on approximations for the exchange-correlation functional. Our average value is
where the small uncertainty reflects the scatter for the different methods of calculation.
(2) Within the volume range considered here, the most appropriate 3-parameter analytical form for the relation of diamond (Eq. 2 or 4) is transferable between LDA and GGA solutions; only and need to be adjusted.
(3) Inserting the calculated value and the experimental data for and (see Table 1) into Eq. 2 (Eq. 4) is considered to yield, on the basis of this work, the optimum representation of the EOS of diamond at 300 K. Actually, at the experimental the GGA bulk modulus (calculated value of 440 GPa plus 1% correction for zero-point motion effects) happens to be very close to the experimental , and the calculated pressure at the experimental is only 2 GPa. Therefore, the optimum EOS corresponds to the relation obtained from GGA calculations, with only a small correction applied.
III.5 Comparison with other results for
Calculated values of reported in the literature are 3.54 [Cheli84, ], 3.6, 4.5 [Niels86, ], 3.24 [Fahy87, ], 3.5 [Pavon93, ] and 3.97 [Herre00, ]. In some cases, the differences to our result are small. Larger deviations may in part result from the procedure used to extract the EOS parameters (e.g., fit of a Murnaghan equation which is inadequate).
The experimental value =4 0.5 (Ref. [McSki72, ]) derived from sound speed measurements at low pressures (0.2 GPa) is not sufficiently accurate to test the calculated result.
The only other experimental value of stems from the recent x-ray diffraction experiments up to 140 GPaOccelli02 . The EOS data appear to be of high quality. They were measured using helium as a pressure medium which is considered to provide almost hydrostatic conditions in DAC experiments. The obtained value of is inconsistent with the ultrasonic result and also significantly smaller than the calculated value. The latter difference is illustrated in Fig. 3. At nominally 140 GPa, about the maximum pressure reached in the experiments, the difference between our calculated value and that Ref. [Occelli02, ] translates to a pressure difference of about +11 GPa. This means that either repulsion is slightly overestimated in the calculations (independent of the exchange-correlation functional) or that the experimental data suffer from systematic errors, a combination of these effects not being ruled out. We will return to this issue below.
IV Optical phonon frequency
IV.1 Calculated phonon frequency versus volume
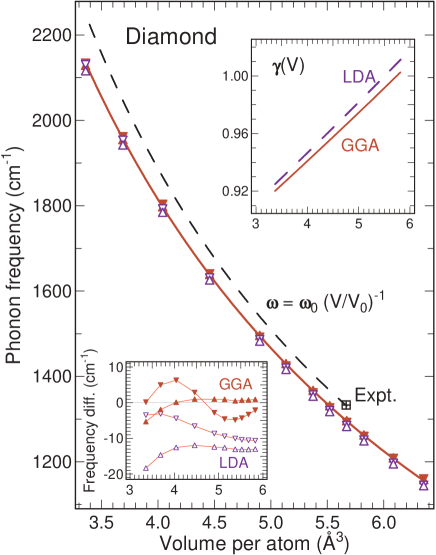
Figure 4 shows calculated F2g phonon frequencies as a function of volume. At a given volume, the frequencies of all calculations are quite consistent with each other. The frequencies are too low by about 3% if compared to the experimental phonon frequency at ambient pressure. This small discrepancy does not originate from anharmonicity connected to the frozen-phonon displacement.
The volume dependence of phonon frequencies is usually characterized by the simple scaling law
| (6) |
which assumes that the mode Grüneisen parameter is independent of volume. The frozen-phonon results indicate some volume dependence of , an observation which was also noted by NielsenNiels86 . The expression
| (7) |
with yields a slightly better match of our frozen-phonon results (3 cm-1 rms deviation or better for individual sets). Within standard deviations, the parameters and for the combined GGA and LDA results are identical (see Table 1). The upper inset to Fig. 4 illustrates the small volume dependence of the mode Grüneisen parameter resulting from .
With () it follows from Eq. 5 that the ratio of normalized bulk modulus to normalized phonon frequency is approximately linear in relative density and the slope is :
| (8) |
This scaling between bulk modulus and optical phonon frequency could come handy as a simple relation between an elastic and a dynamical property of diamond.
IV.2 Calculated vs. experimental mode Grüneisen parameter
To compare the calculated phonon results with experimental data, we first consider the measured linear pressure coefficient of the phonon frequency. According to Schiferl et al.Schif97 , the ’best’ experimental value in the literature, taken as the average of Refs. [Hanfl85b, ; Boppa85, ; Muino94, ], should be cm-1/GPa (). This value originates from experiments which employed the ruby pressure calibration with a linear coefficient GPa for the R1 line wavelength () shift near zero pressure as determined by Piermarini et al.Pierm75 Recent high-precision measurements of the ruby line shift up to 1 GPaGrass01 and a reinterpretationHolza02 of R1 line shift data measured up to 20 GPaPierm75 ; Nakan00 indicate that the parameter is smaller ( GPa) compared to the previously accepted value. This revision leads to a corresponding increase of the phonon pressure coefficient. In this context it is helpful that the ratio of the diamond phonon frequency shift to ruby wavelength shift is explicitly given in Refs. [Hanfl85b, ] and [Aleks87, ]. The results, 7.94(10) cm-1/nm and 7.85(6) cm-1/nm, agree quite well with each other. Taking the average value (7.9(1) cm-1/nm) in combination with = 1820(30) GPa, the corrected value from DAC experiments should be cm-1/GPa. Within experimental uncertainties, this linear pressure coefficient agrees with results obtained by methods which do not involve any ruby calibrationMitra69 ; Whalley76 ; Grims78 , in particular that of Whalley et al.Whalley76 With =444.8 GPa the corresponding mode Grüneisen parameter becomes , the error being mainly due to the uncertainty of the ruby coefficient . We note the excellent agreement of the corrected experimental value for with the results obtained within the LDA and GGA approximations (see Table 1).
Occelli et al. report an average mode Grüneisen parameter of for the range 0–140 GPa. It should be pointed out that their value of is independent of the pressure scale used in the experiments because the volume was measured directly. Taking into account the predicted volume dependence (see inset to Fig. 4), the calculations are fully consistent with the experimental volume dependence of the phonon frequency. This is no longer the case if we turn to the pressure dependence.
IV.3 The pressure – phonon-frequency relationship
One can solve Eq. 7 for the relative volume, insert the corresponding expression into Eq. 2 (Eq. 4), and use the ’GGA’ and ’LDA’ parameters from Table 1 to obtain an analytical form for pressure as a function of phonon frequency. On the other hand, in the analysis of earlier phonon calculationsHanfl85b ; Niels86 , the behavior was parametrized using the analog of a Birch expressionBirch78
| (9) |
with . Equation 9 (more or less an ad hoc choice in the earlier work) happens to yield excellent representations of the present calculated results. To facilitate direct comparison with Refs. [Hanfl85b, ] and [Niels86, ], the parameters and are summarized in Table 2. Note that for our calculated data is the only adjustable parameter, because .
| Method or | ||||
|---|---|---|---|---|
| Source | cm-1 | GPa | cm-1/GPa | |
| All GGA | 1290 | 429(6) | 0.045(50) | 3.00 |
| All LDA | 1322 | 460(3) | 0.090(20) | 2.87 |
| Hanfland et al.111Ref. [Hanfl85b, ]. | 1341 | 480 | 0.118 | 2.79 |
| Nielsen222Ref. [Niels86, ]. | 1306 | 456 | 0.066 | 2.86 |
| Experiment | 1333 | 460 | - | 2.90(5)333Refs. [Schif97, ]. |
| Experiment | 1333 | 446 | - | 3.00(10)444Corrected value based on revised linear pressure coefficient of the ruby R1 line shift. |
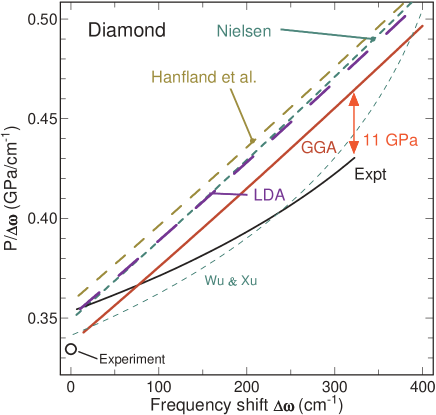
Applicability of Eq. 4 in combination with implies a nearly quadratic dependence of pressure on change in phonon frequency. Thus, we compare calculated and experimental results in terms of reduced coordinates and , cf. Fig. 5. Most of the calculated results represented in Fig. 5, i.e., the present ones within LDA and GGA and those of Refs. [Hanfl85b, ] and [Niels86, ], agree very well with respect to the slope. This is of course reflected in the small scatter of the values given in Table 2. The average value from our calculations is
Inserting this value and the experimental data for and (Table 2) into Eq. 9 yields the dependence consistent with experimental data near ambient pressure and with the nonlinear behavior predicted by the present calculations.
In the reduced coordinates of Fig. 5 the calculated results of Wu and XuWu99 do not agree well with those of other calculations. They use the quadratic function
| (10) |
to fit their data. The choice of pressure as the independent variable in a quadratic expression is not appropriate in view of Eq. 4 and . It leads to parameter correlation which is the possible reason that their results exhibit curvature in Fig. 5.
Occelli et al.Occelli02 have measured the optical phonon frequency for pressures up to 140 GPa. They also give frequency as a quadratic function of pressure, i.e, cm-1/GPa and cm-1/GPa2 in Eq. 10. The curvature of their data in Fig. 5 could again be related to the particular choice of the fitting function. The main observation, however, is that the average slope for the experimental data differs from the one predicted by theory. At the frequency corresponding to 140 GPa experimental pressure the pressure difference between calculations and experiment again amounts to about 11 GPa.
The sign and magnitude of this difference is very similar to that encountered when comparing experimental and calculated EOS results. Thus, in terms of pressure we find differences between calculated and experimental results which are about the same for different physical quantities considered. This hints to an explanation where the discrepancies are caused by the same systematic error(s).
V Remarks on the ruby calibration
We consider the possibility that the discrepancy in the high pressure regime between experimental and calculated EOS and phonon frequency results for diamond are caused by some error in the experimental pressure scale, i.e. the calibration of the ruby R1 line shift according to Ref. [Mao86, ].
HolzapfelHolza02 recently proposed a revised ruby pressure scale, based on an analysis of published EOS data of selected elemental solids, including those of Ref. [Occelli02, ] for diamond. The revised ruby calibration was cast into a three-parameter analytical expression for pressure as a function of the R1 line wavelength. With the recommended parameter valuesHolza02 and when restricted to about 200 GPa pressure (a range beyond the upper limit of most DAC studies), the revised calibration can be represented by a simple second-order polynomial in frequency shift of the R1 line. This is evident from Fig. 6 which shows plots of versus for Holzapfel’s revised scale and for the 1978/1986 scales of Mao et al.Mao78 ; Mao86 We write the quadratic polynomial aslambda
| (11) |
A linear regression for the ’Revised’ line in Fig. 6 with GPa (fixed value as recommended in Ref. [Holza02, ]) gives a slope parameter of =15.8.
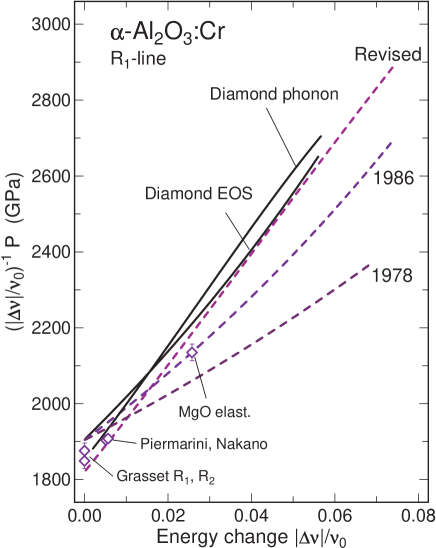
From the experimental and data of diamondOccelli02 one can recover the ruby line shift according to the ruby calibrationMao86 used in the experimental work. Combining the experimental and , respectively, with the calculated and relations reported here yields as shown by the two solid lines in Fig. 6. These curves run more or less parallel to Holzapfel’s revised calibration. Obviously, both the calculated and relations for diamond in combination with the experimental data of Ref. [Occelli02, ] support the proposed revision of the ruby pressure scale. It should be noted that the ruby calibration discussed by Aleksandrov et al.Aleks87 would be a little higher in pressure, but in the coordinates of Fig. 6 it exhibits a slope similar to that of the ’revised’ line.
VI Conclusions
We offer the following conclusions:
(1) The results of the first-principles EOS and phonon frequency calculations for diamond reported here do not depend on the computational method, i.e., the choice of the crystal potential and basis sets in the PW, PAW, and APW+lo methods.
(2) The calculated equilibrium values for volume () and bulk modulus () of diamond do depend on the exchange-correlation functional (LDA or GGA), a well-known fact in density functional theory. However, the value of the pressure derivative of the bulk modulus [=3.65(5)] and the analytical form of the relation are not affected within the volume range (40% compression) covered here. In other words, the calculated nonlinear component in the behavior is independent of the method of calculation and the exchange-correlation approximation.
(3) The different theoretical methods and approximations also yield very similar results for the nonlinearity in the pressure versus phonon frequency relation .
(4) Both the calculated and relations exhibit a nonlinear behavior which is more pronounced than that observed in recent x-ray diffraction and Raman measurements of diamond up to 140 GPaOccelli02 . In terms of absolute pressure, the differences between theoretical and experimental results are essentially the same for the and behavior, of the order of 10 GPa at an experimental pressure of 140 GPa.
(5) Our calculated nonlinearity of agrees well with that obtained in earlier ab initio phonon frequency calculations for diamond under pressureHanfl85b ; Niels86 . The work of Hanfland et al.Hanfl85b indicated the need to reconsider the calibration of the ruby pressure scale used at that timeMao78 . The ’quasi-hydrostatic’ (1986) ruby calibrationMao86 reduced the discrepancy between theoretical predictions and experimental results. The remaining difference discussed here at least calls for some caution when experimental data measured above 50 GPa and based on the 1986 ruby pressure scale are compared to ab initio calculations or reduced shock wave data.
Acknowledgements.
The authors thank P. Loubeyre and W. B. Holzapfel for making available preprints of Refs. [Occelli02, ] and [Holza02, ], respectively. Part of the computer resources used in this work were provided by the Scientific Committee of IDRIS (Institut du Développement et des Ressources en Informatique Scientifique), Orsay (France).References
- (1) S. S. Mitra, O. Brafman, W. B. Daniels, and R. K. Crawford, Phys. Rev. 186, 942 (1969).
- (2) E. Whalley, A. Lavergne, and P. T. T. Wong, Rev. Sci. Instrum. 47, 845 (1976).
- (3) M. H. Grimsditch, E. Anastassakis, and M. Cardona, Phys. Rev. B 18, 901 (1978).
- (4) M. Hanfland, K. Syassen, S. Fahy, S. Louie, and M. Cohen, Phys. Rev. B 31, 6896 (1985).
- (5) I. V. Aleksandrov, A. F. Goncharov, A. N. Zisman, and S. M. Stishov, Sov. Phys. JETP 66, 384 (1987).
- (6) P. Gillet, G. Fiquet, I. Daniel, B. Reynard, and M. Hanfland, Phys. Rev. B 60, 14660 (1999).
- (7) F. Occelli, P. Loubeyre, and R. LeToullec, Nature (2003), preprint of August 2002.
- (8) H. J. McSkimin and P. Andreatch, J. Appl. Phys. 43, 2944 (1972).
- (9) M. H. Grimsditch and A. K. Ramdas, Phys. Rev. B 11, 3139 (1975).
- (10) A. K. Ramdas, S. Rodriguez, M. Grimsditch, T. R. Anthony, and W. Banholzer, Phys. Rev. Lett. 71, 189 (1993).
- (11) R. Vogelgesang, A. K. Ramdas, S. Rodriguez, M. Grimsditch, and T. R. Anthony, Phys. Rev. B 54, 3989 (1996).
- (12) E. S. Zouboulis, M. Grimsditch, A. K. Ramdas, and S. Rodriguez, Phys. Rev. B 57, 2889 (1998).
- (13) W. B. Holzapfel, J. Appl. Phys. 93, 1813 (2003).
- (14) H. K. Mao, J. Xu, and P. M. Bell, J. Geophys. Res. 91, 4673 (1986).
- (15) H. Boppart, J. Vanstraaten, and I. F. Silvera, Phys. Rev. B 32, 1423 (1985).
- (16) A. F. Goncharov, I. N. Makarenko, and S. M. Stishov, JEPT Lett. 41, 184 (1985).
- (17) I. Aleksandrov, A. F. Goncharov, and S. M. Stishov, JEPT Lett. 44, 611 (1986).
- (18) A. Tardieu, F. Cansell, and J. P. Petitet, J. Appl. Phys. 68,, 3243 (1990).
- (19) M. Muinov, H. Kanda, and S. M. Stishov, Phys. Rev. B 50, 13860 (1994).
- (20) D. Schiferl, M. Nicol, J. M. Zaug, S. K. Sharma, T. F. Cooney, S. Y. Wang, T. R. Anthony, and J. F. Fleischer, J. Appl. Phys. 82, 3256 (1997).
- (21) W. F. Sherman, J. Phys. C: Solid State Phys. 18, L973 (1985).
- (22) A. Zunger and A. J. Freeman, Phys. Rev. B 15, 5049 (1977).
- (23) M. T. Yin and M. L. Cohen, Phys. Rev. Lett. 50, 2006 (1983).
- (24) J. R. Chelikowsky and S. G. Louie, Phys. Rev. B 29, 3470 (1984).
- (25) M. L. Cohen, Phys. Rev. B 32, 7988 (1985).
- (26) J. R. Chelikowsky, Phys. Rev. B 35, 1174 (1987).
- (27) O. H. Nielsen, Phys. Rev. B 34, 5808 (1986).
- (28) M. Cardona and N. Christensen, Solid State Commun. 58, 421 (1986).
- (29) S. Fahy and S. G. Louie, Phys. Rev. B 36, 3373 (1987).
- (30) S. Fahy, S. G. Louie, and M. L. Cohen, Phys. Rev. B 35, 7623 (1987).
- (31) S. Fahy, K. J. Chang, S. G. Louie, and M. L. Cohen, Phys. Rev. B 35, 5856 (1987).
- (32) S. Fahy, X. W. Wang, and S. G. Louie, Phys. Rev. Lett. 61, 1631 (1988).
- (33) C. Mailhiot and A. K. McMahan, Phys. Rev. B 44, 11578 (1991).
- (34) P. E. Van Camp, V. E. Van Doren, and J. T. Devreese, Solid State Commun. 84, 731 (1992).
- (35) P. Pavone, K. Karch, O. Schütt, W. Windl, D. Strauch, P. Giannozzi, and S. Baroni, Phys. Rev. B 48, 3156 (1993).
- (36) M. Willatzen, M. Cardona, and N. Christensen, Phys. Rev. B 50, 18054 (1994).
- (37) S. J. Clark, G. J. Ackland, and J. Crain, Phys. Rev. B 52, 15035 (1995).
- (38) S. Scandolo, G. L. Chiarotti, and E. Tosatti, phys. stat. sol. (b) 198, 447 (1996).
- (39) S. Serra, G. Benedek, M. Facchinetti, and L. Miglio, Phys. Rev. B 57, 5661 (1998).
- (40) J. Xie, S. P. Chen, J. S. Tse, S. de Gironcoli, and S. Baroni, Phys. Rev. B 60, 9444 (1999).
- (41) B. R. Wu and J. Xu, Phys. Rev. B 60, 2964 (1999).
- (42) J. J. Zhao, S. Scandolo, J. Kohanoff, G. L. Chiarotti, and E. Tosatti, Appl. Phys. Lett. 75, 487 (1999).
- (43) P. Hohenberg and W. Kohn, Phys. Rev. 136, B864 (1964).
- (44) W. Kohn and L. J. Sham, Phys. Rev. 140, A1133 (1965).
- (45) J. P. Perdew and Y. Wang, Phys. Rev. B 45, 13244 (1992).
- (46) J. P. Perdew, S. Burke, and M. Ernzerhof, Phys. Rev. Lett. 77, 3865 (1996).
- (47) X. Gonze, J.-M. Beuken, R. Caracas, F. Detraux, M. Fuchs, G.-M. Rignanese, L. Sindic, M. Verstraete, G. Zerah, F. Jollet, M. Torrent, A. Roy, et al., Computational Materials Science 25, 478 (2002), URL http://www.abinit.org.
- (48) S. Goedecker, SIAM J. Sci. Comp. 18, 1605 (1997).
- (49) M. Payne, M. Teter, D. Allan, T. Arias, and J. Joannopoulos, Rev. Mod. Phys. 64, 1045 (1992).
- (50) X. Gonze, Phys. Rev. B 54, 4383 (1996).
- (51) P. Blacha, K. Schwarz, G. K. H. Madsen, D. Kvasnicka, and J. Luitz, WIEN2k, an augmented plane wave + local orbitals program for calculating crystal properties (Karlheinz Schwarz, Techn. Universität Wien, Austria, 2001).
- (52) E. Sjösted, L. Nordström, and D. J. Singh, Solid State Commun. 114, 15 (2000).
- (53) G. K. H. Madsen, P. Blaha, K. Schwarz, E. Sjöstedt, and L. Nordström, Phys. Rev. B 64, 195134 (2001).
- (54) G. Kresse and J. Hafner, Phys. Rev. B 47, R558 (1993); G. Kresse, Ph.D. Thesis,Technische Universität Wien (1993); G. Kresse and J. Furthmüller, Comput. Mater. Sci. 6, 15 (1996); Phys. Rev. B 54, 11169 (1996).
- (55) G. Kresse and J. Joubert, Phys. Rev. B 59, 1758 (1999).
- (56) P. E. Blöchl, Phys. Rev. B 50, 17953 (1994).
- (57) C. Hartwigsen, S. Goedecker, and J. Hutter, Phys. Rev. B 58, 3641 (1998).
- (58) X. Gonze, private communication; see the pseudopotential entry at www.abinit.org for the parameters.
- (59) O. H. Nielsen and R. M. Martin, Phys. Rev. Lett. 50, 697 (1983).
- (60) O. H. Nielsen and R. M. Martin, Phys. Rev. B 32, 3780 (1985).
- (61) H. J. Monkhorst and J. D. Pack, Phys. Rev. B 13, 5188 (1976).
- (62) O. Jepsen and O. K. Andersen, Solid State Commun. 9, 1763 (1971).
- (63) P. E. Blöchl, O. Jepsen, and O. K. Andersen, Phys. Rev. B 49, 16223 (1994).
- (64) T. Sato, K. Ohashi, T. Sudoh, K. Haruna, and H. Maeta, Phys. Rev. B 65, 92102 (2002), the ambient-pressure lattice constants of pure diamond with natural isotopic composition are given as 3.56688 Å at 300 K and 3.566505 Å at 0 K.
- (65) F. D. Murnaghan, Proc. Nat. Acad. Sci. USA 30, 244 (1944).
- (66) F. Birch, J. Geophys. Res. 83, 1257 (1978).
- (67) P. Vinet, J. Ferrante, J. R. Smith, and J. H. Rose, J. Phys.: Cond. Matter 19, L467 (1986).
- (68) W. B. Holzapfel, Rep. Prog. Phys. 59, 29 (1996).
- (69) F. D. Stacey, B. J. Brennan, and R. D. Irvine, Geophys. Surv. 4, 189 (1981).
- (70) S. Gaurav, B. S. Sharma, S. B. Sharma, and S. C. Upadhyaya, Physica B 322, 328 (2002).
- (71) C. P. Herrero and R. Ramirez, Phys. Rev. B 63, 24103 (2000).
- (72) G. J. Piermarini, S. Block, J. D. Barnett, and R. A. Forman, J. Appl. Phys. 46, 2774 (1975).
- (73) O. Grasset, High Pressure Research 21, 139 (2001).
- (74) K. Nakano, Y. Akahama, and Y. Ohishi, Jpn. J. Appl. Phys. 39 (3A), 1249 (1978).
- (75) H. K. Mao, P. M. Bell, J. W. Shaner, and D. J. Steinberg, J. Appl. Phys. 49, 3276 (1978).
-
(76)
For practical purposes one may prefer to rewrite the
relation in terms of wavelength:
Note that it is the wavelength at a given pressure which appears in the denominators. - (77) C.-S. Zha, H. Mao, and R. J. Hemley, Proc. Nat. Acad. Sci. USA 97, 13494 (2000).