[
First-order nature of the ferromagnetic phase transition in (La-Ca)MnO3 near optimal doping
Abstract
Neutron scattering has been used to study the nature of the ferromagnetic transition in single crystals of La0.7Ca0.3MnO3 and La0.8Ca0.2MnO3, and polycrystalline samples of La0.67Ca0.33MnO3 and La5/8Ca3/8MnO3 where the naturally occurring 16O can be replaced with the 18O isotope. Small angle neutron scattering on the single crystal reveals a discontinuous change in the scattering at the Curie temperature for wave vectors below 0.065 Å-1. Strong relaxation effects are observed for this domain scattering, for the magnetic order parameter, and for the quasielastic scattering, demonstrating that the transition is not continuous in nature, in good agreement with the temperature dependence of the central component of the magnetic fluctuation spectrum, the polaron correlations, and the spin stiffness reported previously. This behavior contrasts with the continuous behavior observed for the crystal, which is well away from optimal doping. There is a large oxygen isotope effect observed for the in the polycrystalline samples, and the Curie temperature is decreased by 7 K by substituting 50% in the sample. For the optimally doped sample we observed K and K at 90% substitution. Although is decreased by 5 K for the sample the temperature dependence of the spin-wave stiffness is found to be identical for the two samples. These results indicate that is not solely determined by the magnetic subsystem, but instead the ferromagnetic phase is truncated by the formation of polarons which cause an abrupt transition to the paramagnetic, insulating state. Application of uniaxial stress in the single crystal sharply enhances the polaron scattering at room temperature. Measurements of the phonon density-of-states show only modest differences above and below and between the two different isotopic samples.
pacs:
75.47.Gk, 75.47.Lx, 75.30.Ds, 63.20.Dj]
I Introduction
One of the simplifying features of conventional isotropic ferromagnets such as Fe, Co, Ni, and EuO is the isolation of the spin system from the underlying lattice. This made these types of materials ideal candidates to investigate the critical dynamics, scaling behavior, and nature of second-order phase transitions. This situation contrasts dramatically with the colossal magnetoresistive (CMR) oxides, exemplified by La1-xCaxMnO3, where the electronic, lattice, and magnetic degrees of freedom are intimately intertwined.[3, 4, 5, 6, 7, 8, 9, 10] This coupling leads to a number of interesting physical phenomena, including orbital ordering, charge ordering, polarons, stripes, ferromagnetic droplet formation at small[11, 12] and large , and the dramatic decrease in the electrical resistance in the ferromagnetic-metallic state that is the CMR effect. Investigations of these phenomena and the close relationship between CMR compounds, relaxor ferroelectrics, and high temperature superconductors has made this a field of intense study. An additional strong motivation comes from the possibility of technical applications of CMR materials in a new generation of magnetic sensors, read/write heads, and for a variety of new spin-sensitive electronics.
In the CMR materials the transport and magnetic order are connected through the ferromagnetic double exchange mechanism[13] while the Jahn-Teller effect locally distorts the lattice that surrounds a Mn3+ ion,[3, 4, 10, 14, 15, 16, 17] coupling the electronic and magnetic degrees of freedom with the lattice. The resulting ferromagnetic transition was found to be dramatically different from conventional isotropic ferromagnets, and was interpreted as a discontinuous transition between the ferromagnetic-metallic state and the paramagnetic-insulting state.[18] In particular, the spin wave stiffness was found not to renormalize to zero at the Curie temperature as it should in a second-order transition. Instead, the spin wave intensities decreased rather than increasing, and the spectral weight of the magnetic fluctuations shifted to a quasielastic spin-diffusive peak in the fluctuation spectrum that rapidly developed as and peaked near .[18, 19, 20] Concomitant with this spin-diffusive component is the development of diffuse lattice (polaron) scattering, that is correlated in a way that is consistent with the formation of zig-zag, CE-type structural stripes. The intensity for these polaron-polaron correlations also increases dramatically as in a manner very similar to the spin-diffusion component, and the temperature dependence for both of these closely follows the resistivity of the metal-insulator transition.[7, 20, 21, 22, 23, 24, 25, 26, 27] It has recently been observed that these polarons form a glass above the ferromagnetic-metallic to paramagnetic-insulator transition, which subsequently melts at a higher transition temperature to a fluid.[28, 29]
Considering the broad range of compositions, dopings, and crystal structures that comprise the CMR class of materials, it is not simply the observation of polarons and charge ordering that is significant, but the establishment of a clear relationship between the metal-insulator transition and polaron formation that is crucial. We have continued our neutron scattering investigations using single crystal samples of La0.7Ca0.3MnO3 and La0.8Ca0.2MnO3, and polycrystalline samples of La0.67Ca0.33MnO3 and La5/8Ca3/8MnO3 that have been treated with 16O and 18O isotopes. The results demonstrate a ferromagnetic transition that is clearly first order in nature, as interpreted in the original measurements on this system.[18] The results also make it clear that the observed is determined not by magnetic interactions but instead by polaron formation; the formation of polarons truncates the ferromagnetic-metallic state. We also show that the application of uniaxial stress enhances the polaron scattering. Finally, we have measured the phonon density-of-states both above and below for both isotopes of oxygen, and observe small but measurable differences in the lattice dynamics.
II Experimental Details
The single crystal samples of La0.7Ca0.3MnO3 and La0.8Ca0.2MnO3 were grown by the floating zone technique and have a mass of g. The crystal mosaics were single peaked with an intrinsic width less than a degree. In this range of compositions the crystal structure is orthorhombic but the distortion is small and the crystallographic domains appear to be equally populated. Therefore, on average, the sample itself is cubic, and we use cubic notation for simplicity. Nearest-neighbor manganese atoms are then along the [100]-type directions. The crystals were mounted in the plane and the cubic lattice parameter was Å at room temperature. Elastic and inelastic neutron scattering measurements were collected on the BT-2 and BT-9 thermal triple axis spectrometers at the NIST Center for Neutron Research, using pyrolytic graphite monochromators, analyzers, and filters. Small angle neutron scattering data were obtained on the NG-7 30 m SANS spectrometer.
The single crystal has a Curie temperature of 251 K, which is the highest for any Ca doped crystals. It has not proved possible yet to grow crystals with higher Ca content, and therefore bulk studies at higher are restricted to polycrystalline samples. For the isotope studies a 20 g polycrystalline sample of La5/8Ca3/8MnO3 was specifically prepared for the measurements, using the standard solid-state reaction technique. This Ca concentration was chosen because it is at the maximum and therefore any change in the Curie temperature cannot be caused by small changes in the overall oxygen content.[30, 31] At each stage of the measurements high resolution powder diffraction measurements were carried out using the BT-1 powder diffractometer to characterize the powder sample(s), and at each stage the samples were found to be single phase. To implement the isotope substitution, the original sample was divided in half and each half was heat treated in parallel with either 16O and 18O, respectively, through an established procedure.[14] The fraction of isotopic substitution was determined by measuring the weight change, which established that approximately 90% substitution of 18O was achieved. Bulk magnetization measurements were taken using a commercial SQUID magnetometer,[32] while the ferromagnetic order parameter was measured by neutron diffraction. The nuclear scattering amplitudes for 16O and 18O are indistinguishable so that the total oxygen content can be determined by diffraction, but the fraction of substitution cannot be determined by this technique. After the 18O inelastic and diffraction measurements were completed, the sample was converted back to 16O and the properties were re-measured to establish that there was no change in the composition or changes in properties from the initial sample, within experimental error. Finally, measurements were also carried out on the original powder sample[18, 33] for comparison purposes. This sample was re-heat treated at higher temperatures compared to the original preparation (and a small amount of Ca may have been lost in this process), and then the isotope substitution was performed. In these initial measurements only 50% substitution was achieved due to the limited amount of 18O available at the time, but the shift in was still larger than at optimal doping.
BT-2 and BT-9 thermal triple-axis spectrometers were employed to determine the magnetic order parameters and spin dynamics. For doping between and La1-xCaxMnO3 compounds are ferromagnetic at low temperatures.[30, 31] At smaller there is anisotropy in the dispersion relations and additional excitations, [34] but in the regime of interest here the system behaves to a very good approximation as an ideal isotropic ferromagnet. In polycrystalline samples this makes it possible to measure the spin dynamics around the forward scattering direction using the (000) peak reciprocal lattice point,[18, 35] while of course in single crystals the dispersion relations and linewidths can be measured around any reciprocal lattice point.[36] In either case the long wavelength excitations in a ferromagnet should have quadratic dispersion
| (1) |
with a temperature-dependent spin wave stiffness and a possible spin wave gap that would arise from anisotropy. The spin wave spectrum has been found to be gapless within the precision of neutron inelastic scattering measurements,[7] which indicates that these materials are to a very good approximation rotationally isotropic.
The phonon density-of-states was measured on the Filter Analyzer Neutron Spectrometer (FANS) and the time-of-flight Fermi Chopper Spectrometer (FCS). Uncertainties quoted for all the neutron measurements are statistical and represent one standard deviation.
III Magnetic Properties for x=0.2
In Fig. 1(a) we show a measurement of the ferromagnetic (110) Bragg peak in the vicinity of the Curie temperature for the single crystal. Above the Curie temperature only the Bragg peak due to nuclear scattering is observed, while below the magnetic contribution to the peak intensity is proportional to square of the order parameter (magnetization). This magnetic intensity is well described by a power law, except in the immediate vicinity of the Curie point where critical scattering is significant, and these data were excluded from the fit. The fit gives K, and an (effective) exponent which is close to the prediction of the three-dimensional Heisenberg model ().[37] The errors represent statistical uncertainties only, and no account was taken of a possible spread of transition temperatures since the critical properties are not central to the present investigation. This Curie temperature is in good agreement with the values of 175 K, [38] 178 K,[39] and 185 K[34] reported previously for single crystals of the same nominal composition.
The spin wave spectrum has been measured at small wave vectors, and the spin wave stiffness coefficient is shown in Fig. 1(b) as a function of temperature. Each constant- scan was least-squares fit to a quadratic dispersion law convoluted with the instrumental resolution. Correcting for the spectrometer resolution has the effect of decreasing the observed value of by , and the low temperature value was determined to be meV-Å2 for this single crystal. This is in good agreement with the values previously reported for this composition.[34, 38, 39] As the Curie temperature is approached the spin wave intensities were found to increase due to the increase in the thermal population of spin waves, caused by the combined higher temperatures and lower values. In Fig. 1(b) we see that appears to renormalize to zero at , as expected for a conventional second-order ferromagnetic transition. We

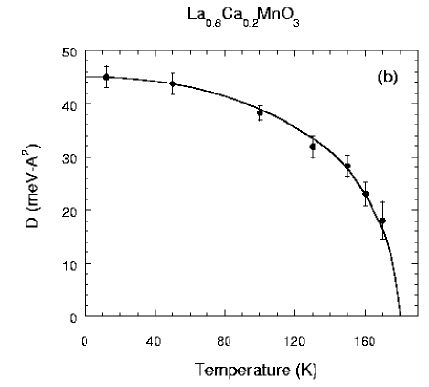
did not find the development of a central quasielastic component to the magnetic fluctuation spectrum, in contrast to the behavior found in the metallic regime.[18, 19, 20, 39] For the composition, Dai et al. [39] also did not find a central component, but they did suggest that was finite, which we do not see in the present measurements.
The overall behavior changes as increases to the optimal doping range for ferromagnetism. The excitations at long wavelengths are still isotropic spin waves with quadratic dispersion, but as mentioned in the introduction fails to renormalize to zero at . Instead a quasielastic peak appears in the fluctuation spectrum, indicative of the type of spin diffusion that occurs above . This was interpreted as a coexistence between the low- ferromagnetic-metallic phase, and the high- paramagnetic-insulator phase, with the phase fractions changing with temperature.[18, 40] The spin diffusion component then grows at the expense of the spin wave intensities. Measurements of the magnetic correlation length as one approaches from above show that this length does not diverge at the transition as would be expected for a continuous transition.[18, 20, 41] This agrees with measurements of the paramagnetic scattering, and the correlation length is only weakly temperature dependent at 15 Å through the transition. These features cannot be explained in the context of a conventional second-order ferromagnetic phase transition, but can be understood if one assumes that long range ferromagnetic order is not the sole order parameter of the transition and that the coupling to the other order parameter forces the transition to be first order. [42]
IV Magnetic Properties Near Optimal Doping
For a conventional ferromagnet above the magnetic scattering is concentrated around the Bragg peaks with -dependent intensity that follows the Ornstein-Zernike form
| (2) |
The correlation length in real space is the parameter that diverges at for a second order transition. Such a divergence was not observed in previous polycrystalline measurements,[18, 41] or in more recent single crystal measurements made around Bragg peaks.[19, 20] However, SANS measurements on polycrystalline samples are restricted due to the large amount of small angle metallurgical scattering from the crystallites, and therefore we have pursued SANS measurements on the
single crystal where high quality data could be obtained over a wide range of wave vectors and temperature, and where we have also been able to measure the time-dependence of the scattering.
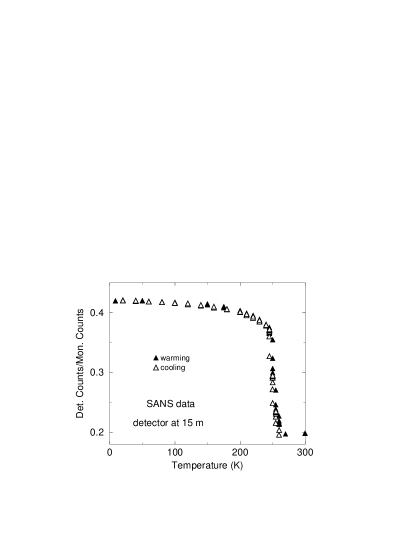
The results are quite different from conventional second-order behavior, as (now) expected. The Ornstein-Zernike behavior in Eq. (2) is maintained for Å-1 with a short and weakly temperature-dependent correlation length as found previously.[20] For smaller , on the other hand, there is a discontinuous increase in the scattering at that cannot be described in terms of the Ornstein-Zernike form or the common Porod form ().[43] This scattering is strongly peaked in the forward direction, and dominates the intensity on the (two-dimensional position-sensitive) detector. Figure 2 shows the temperature variation of this scattering, recorded as the total counts on the detector. This corresponds to an integration of the scattered intensity from roughly Å-1 to Å-1. The wavelength is equal to and the detector was 15 m from the sample for this measurement. The dependence of the intensity is typical for scattering from domains and domain walls,[44] and the abrupt nature of its onset is consistent with the transition being discontinuous.

One hallmark of first-order transitions is that, even if thermal hysteresis is too small to be observed, they are accompanied by relaxation effects. Figure 3 shows SANS measurements at three different wave vectors as a function of time, after warming to 250 K. The time for the sample to equilibrate near is clearly quite long. The data can be described by an exponential decay with relaxation time , and the solid curve is a fit of this form to the data. Different values of gave similar values of within statistical uncertainties, showing that all length scales measured in these SANS experiments exhibit similar relaxation times. Warming was performed in steps
of 5 K every 40 minutes for these measurements, and the relaxation time was found to be maximized at .
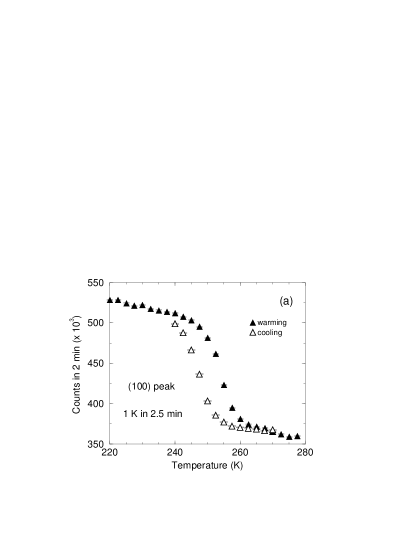
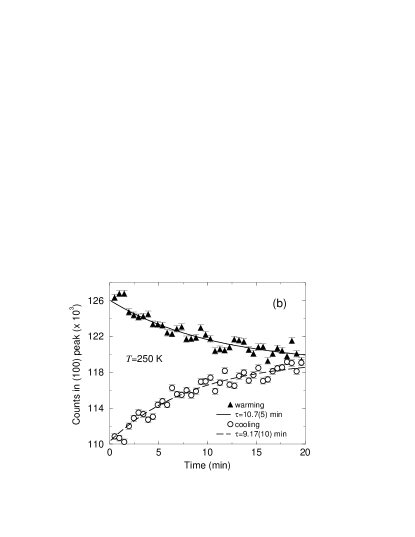
One of the difficulties in unambiguously identifying this as a first order transition has been that, although does not renormalize to zero, the magnetic contribution to the intensity of the Bragg peaks appears to be continuous. In particular, although there are some “irreversibilities” observed on warming and cooling,[18] no clear hysteresis has been identified. The availability of the single crystal has allowed us to investigate the behavior of the magnetic Bragg peak in detail. In Fig. 4(a) we plot the intensity of the (100) Bragg peak, and we see a clear difference on warming and cooling. This apparent hysteresis is due to relaxation effects, and in Fig. 4(b) we show the time dependence of the scattering, after the sample temperature arrives at the set point. The curves are fits to exponential relaxation functions, which describe the data quite well. The fitted versus
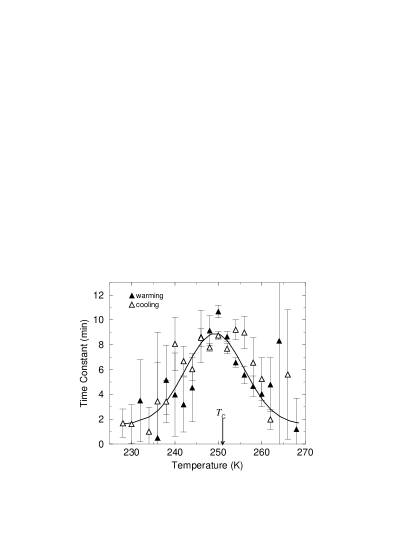
temperature is shown in Fig. 5, on warming and cooling. Although the statistical uncertainties are large, particularly when the total change in scattering between two temperatures is small, we can clearly see that is maximized near .
A further result of the time-dependent measurements is that the asymptotic value of the order parameter at any particular temperature is identical on warming and cooling, as shown in Fig. 6. Thus there is no true thermal hysteresis in the asymptotic time region. We note that the value for determined in these measurements, K, is slightly lower than the preliminary value we reported previously K.[20] The (correct) value of 251 K is determined here by locating the inflection point,

after taking the data on warming and cooling and properly taking into account the long time-scale behavior of the system. This value is also in good agreement with the abrupt onset of SANS shown in Fig. 2. The SANS data also lack true thermal hysteresis.
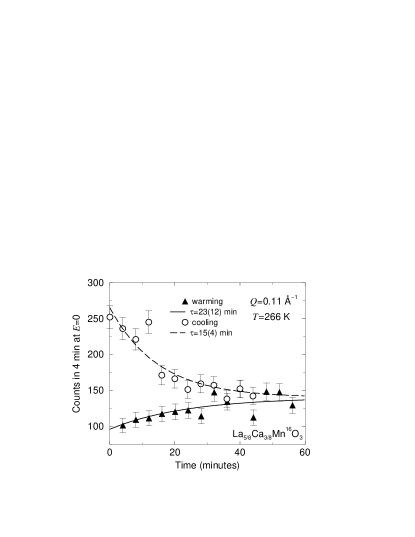
We also measured the relaxation of the central quasielastic component of the magnetic fluctuation spectrum just below for the 16O sample, and the data are shown in Fig. 7. The sample temperature was changed to 266 K from well below or well above this temperature, and the data collection at the elastic position was started when the sample block reached the set point. The measured relaxation times are somewhat different for the two cases, but it is clear that the asymptotic values are identical within statistical uncertainties. Hence, the activation barrier and latent heat for this transition are rather small, which has hindered the identification of this as a first order transition in the specific heat until recently. [45] Previous measurements of the order parameter (and measurements reported in the next section on polycrystalline samples) had always shown some irreversibility on warming and cooling as a result of the activation barrier, but the temperature variation in the order parameter always appeared to be continuous.
A Effect of uniaxial stress
One of the characteristic features of CMR materials is their extraordinary sensitivity to external perturbations. The application of a magnetic field, for example, represents a very modest energy in a system that orders at 250 K, but a magnetic field can drive the metal-insulator transition and the associated CMR effect. Stress, which is always present in thin films, also has a dramatic effect on the electronic properties, and is one of the primary reasons for the rejuvenation of interest in this class of materials. [46] We have already established that the formation of polarons in the paramagnetic state is directly related to the resistivity, [20] and we may then anticipate that the polarons themselves will be directly affected by stress.
To date there have been only a few studies of CMR as a function of applied force, using two-dimensional strain in thin films[47] and hydrostatic pressure.[38, 48] In addition, the effects of internal pressure that result from substitution of smaller Pr ions for the La A-site cation, for example, have been performed. Other options for cation doping have shown that the behavior of the entire La-Ca phase diagram can be achieved via changing the average radius at the A-site. [42, 49, 50] Results can often be understood in terms of the double exchange model when the distortion of the ideal perovskite lattice is considered. Changing the average radius of the A-site cation changes the tilt of the oxygen octahedra that surround the B-site cation, which effects the electronic band width and the double exchange. An increase in distortion away from the ideal perovskite structure tends to favor charge-ordered insulating behavior, where the antiferromagnetic interaction dominates over metallic ferromagnetism.
Our single crystal of La0.7Ca0.3MnO3 was mounted in a stress rig on the BT-9 triple axis spectrometer in the zone. Stress was applied along the axis of the crystal, roughly 30 degrees from (001) in the direction of (220). All measurements were made at room temperature where the charge peak intensity has dropped to roughly 30% of its maximum value near . Given the geometric limitations imposed by the stress rig we were essentially limited to measurements near the (220) peak using an incident energy of 52 meV. The charge order peaks are broad (corresponding to short range correlations) and occur at wave vectors (, , 0). Near (220) these occur at (1.75 2.25 0) and (2.25 1.75 0); the structure factor is negligible for the “longitudinal” peaks at (1.75 1.75 0) and (2.25 2.25 0). In Fig. 8 we show a transverse scan of the charge order peak at (2.25 1.75 0) at 0 kbar and 1 kbar. The intensity of the peak has increased by nearly a factor of two, while the intensity of the fundamental Bragg peaks are unaffected at this level of stress. It is evident that the diffuse scattering, which is related to the “single-polaron” diffuse scattering, has also increased. Uniaxial stress therefore has a rather dramatic effect on the polaron scattering.
Because of the rather large change in intensity that was observed when 1 kbar of stress was applied, we reduced the force to zero in order to determine the behavior at lower values of the stress. The polaron intensity was reduced, but not to the initial value; the observed scattering was about half way between the initial data and the 1 kbar data. Subsequent measurements up to 0.5 kbar showed no change, and with further increase the scattering began to increase up to the 1 kbar data. Hence we believe that the scattering would increase approximately linearly with stress from the virgin state. Unfortunately,
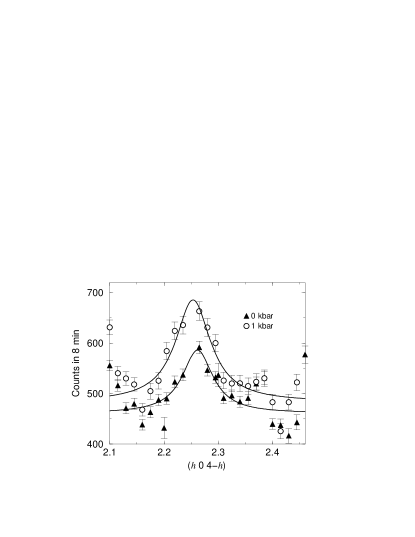
shortly after returning to 1 kbar of stress, the crystal shattered, ending the data collection.
B Oxygen Isotope Effects
One very strong indication for some type of coupled transition in La1-xCaxMnO3 is the oxygen isotope effect.[14, 51, 52, 53, 54, 55, 56, 57] Conventionally, magnetism is a property that emerges from the electronic structure of the system, which is determined by the component elements and the crystal structure that they assume. Once that crystal structure is determined, the specific isotopic masses of the components do not usually enter into the electronic Hamiltonian. The classic example that runs contrary to this is BCS (Bardeen-Cooper-Schriffer) superconductors where the phonons lead to an attractive interaction between the electrons and fundamentally change the nature of the low temperature electronic structure (a gapped superconductor rather than a Fermi liquid). Such phonon effects are limited to temperatures less than 40 K. However, in La0.8Ca0.2MnO3 substitution of 18O for 16O leads to a 20 K decrease in , from 180 K to 160 K.[14] An isotope effect in antiferromagnetic La0.5Ca0.5MnO3 is also seen, but in the opposite direction and effecting the Néel temperature.[51]
To investigate the effect of oxygen isotope substitution on the magnetic behavior we chose to work at , where is maximized and the CMR effect is large.[31] This choice of minimizes any possible variation in or distribution of with overall oxygen content. Indeed, for the measurements in Ref. [14] the observed oxygen isotope effect has been partially attributed to different oxygen stoichiometry.[53] For the present samples the high resolution powder diffraction measurements could be used to establish that the oxygen contents for both samples
were identical within experimental uncertainties, and thus there can be no significant variation in due to the total oxygen content. The lattice parameters, average atomic positions and occupancies were identical as well. Density measurements indicate that roughly 90% of the 16O was replaced by 18O in the substituted sample.
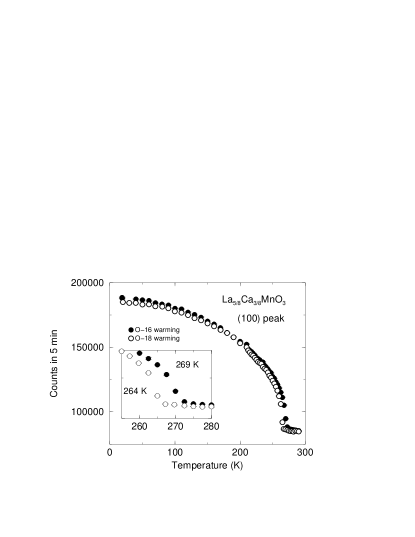
Figure 9 shows the intensity of the (100) powder peak as a function of temperature for the two samples, to determine the effect of oxygen isotope substitution on . The data were obtained as a function of warming at identical heating rates. The Curie temperature of the 18O sample is 5 K lower than the 16O sample, as can been seen in the inset. The same 5 K difference was seen on cooling, along with a 5 K irreversibility in both the curves relative to the warming runs. Given the first-order nature of the transition the irreversibility is expected and is consistent with previous measurements. Taking the average of these warming and cooling runs gives K and K. As we pointed out earlier for the single crystal measurements, these ’s are determined from the inflection points of the order parameter curves. The value of for the 16O sample is indeed the maximum value seen on the Ca-concentration phase diagram and is a further indication of the high quality of these samples.
This 5 K shift is much smaller than reported in the sample, so for comparison we have also made measurements on the original sample. With only 50% 18O substitution we obtained K. It is noteworthy that the transition for the partially substituted sample was just as sharp as for the fully substituted sample, indicating that there is no significant effect on the properties caused by the oxygen isotopic randomness. The larger isotopic shift with decreasing that we find is in good agreement with the trends already established for this system.
Having confirmed that oxygen isotope substitution changes , the next question is how the magnetic interaction strength changes, which we characterize by
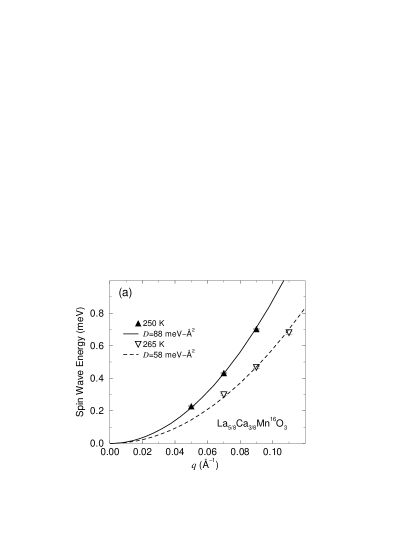
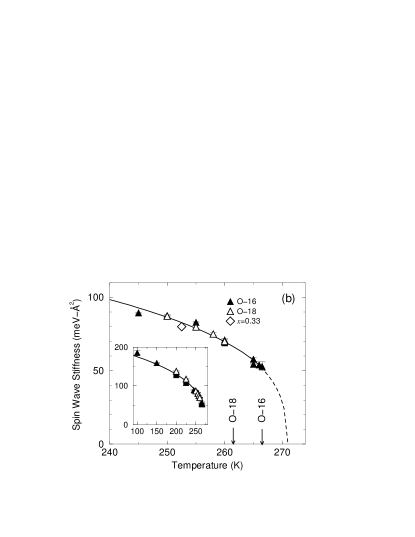
measuring the spin dynamics. In Fig. 10(a) we show the low- spin wave dispersion in the 16O sample at 250 K and 265 K. The dispersion is well described by Eq. (1) with gapless excitations, typical of these isotropic ferromagnets.[18, 19, 20, 25, 58] The spin wave stiffness has decreased considerably over this temperature range upon approaching . Similar measurements were made to determine in the 18O sample. Figure 10(b) shows a comparison of versus for the two samples. The two samples show identical results for over the entire temperature range where spin waves are observed. Note also that there are in fact two complete sets of data for the 16O, one taken with the two samples heat treated in parallel, and one set taken after exchanging the 18O for 16O. Both sets of data are identical. The only difference found is that for the lower- 18O sample the measurements cannot be continued to as high a temperature as with the 16O sample. This result obviously cannot be understood in the conventional context of ferromagnetism since has changed but the ferromagnetic interaction as measured by has not. Hence it is clear that is not determined by magnetic interactions alone.
The data can be well described by a power law in this temperature range, with an extrapolated value of K which is identical for both isotopes. The exponent used in this fit is , which is fairly close to the prediction of the Heisenberg model .[37] The particular value of the exponent is not the central issue here; the point is that the exchange interaction is not affected by the isotope substitution, and the extrapolated is identical for both samples. For both samples the actual magnetic transition occurs before has renormalized to zero, but note that the renormalization has progressed much farther than is the case for samples with lower , lower samples. Indeed, Fernandez-Baca et al.[19] have established that changes little over a wide range of tolerance factor, while large changes in occur. From this point of view the (O isotope-independent) magnetic interactions determine this extrapolated , but polaron formation truncates the transition, thereby determining the observed . This truncation occurs in a first-order manner and leaves at a finite value, and is the determining factor for over a range of . Other measurements of for smaller compounds are very similar to the samples, just with a different truncation value at the different ’s. The downturn in with decreasing in the phase diagram is then caused by polaron formation rather than a weakening of the double exchange mechanism. This behavior continues until the system becomes insulating, and suddenly drops. For our insulating sample is 3 times smaller than in the optimally doped sample, in good agreement with the results of Refs. [39] and [59].
This rapid truncation of ferromagnetism is clearly revealed in Fig. 11, which shows the magnetic fluctuation spectrum as a function of temperature at a wave vector Å-1 for the two samples. The elastic incoherent nuclear scattering and a flat temperature independent background have been removed from these spectra, and the solid curves are fits to the spin wave dispersion [Eq. (1)] plus a quasielastic (spin diffusion) spectral weight function convoluted with the instrumental resolution. Spectra at a series of ’s were obtained at each temperature, and the data collection time between runs at different temperatures is sufficiently long that there are no irreversibility effects due to warming and cooling. For the 16O sample [Fig. 11(a)] we see a three component spectrum at 265 K, just below . The spin waves are observed in energy gain (0) and energy loss (0)
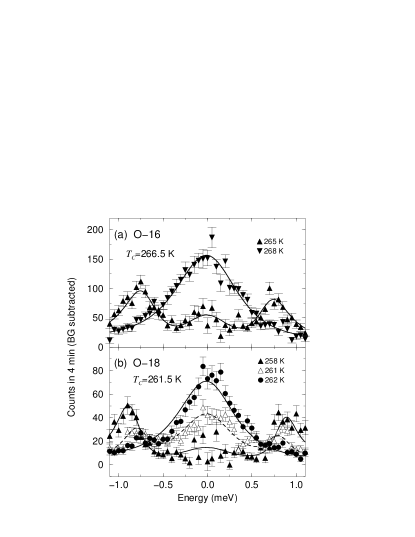
at 0.8 meV. At 268 K, just above , the spin waves have disappeared and the scattering is purely quasielastic (peaked at ). For the 18O sample [Fig. 11(b)], on the other hand, we observe well defined spin waves below at 258 K along with a quasielastic component fitted to the data. At 261 K the central component has increased to form a clear peak (at this ), while the spin waves have lost over 50% of their intensity and have moved to lower energies, consistent with all previous observations of the lower compounds which show growth of the central peak at the expense of the spin waves. But further increasing temperature by only 1 K wipes out the spin waves entirely, leaving only a central peak that corresponds to ferromagnetic correlations in the paramagnetic phase. This very rapid temperature evolution is evidence for the truncation of the magnetically ordered phase in a first-order manner. The nature of the magnetic fluctuation spectrum is the same for both samples, except that the transition for the 16O sample is extended higher in temperature by 5 K, which results in a value that is about 30% lower than for the 18O sample. Note in particular that the data for the 18O sample is pure spin diffusion for 262 K, while for the 16O sample we have propagating excitations at 265 K. We remark that we have taken data for temperatures between the ones shown in Fig. 11 to examine the possibility that there is a sudden decrease in the spin wave energies that might be attributable to a sudden decrease in the effective exchange energy, but all the data indicate that we have two-phase coexistence,[18] a ferromagnetic-metallic phase and a paramagnetic-polaron glass insulator. For lower samples the truncation occurs at lower temperature, with a corresponding higher value of as indicated in Fig. 10(b). Thus the transition at lower is more strongly first order. We have also found that the central peak usually was observable over a wider range of temperature at smaller , 15 K or more, compared to the 5 K range observed here. This may also be related to how close the system is to the extrapolated second-order phase transition temperature .[45, 58]
C Phonon Density-of-States
With the strong evidence that polaron formation plays a crucial role in the ferromagnetic-metallic/paramagnetic-insulator phase transition, the question becomes what controls polaron formation. Given the general relationship between isotope effects and lattice dynamics, and the electron-phonon coupling through the Jahn-Teller effect,[60] we decided to measure the phonon density-of-states in our samples using time-of-flight and filter analyzer spectrometer techniques.
The time-of-flight Fermi chopper spectrometer uses cold monochromatic neutrons incident on the sample, and then detects the inelastically scattered neutrons in a bank of detectors. Near room temperature one can reliably measure energy transfers up to meV. The density-of-states is obtained by removing the thermal population factor, weighting the scattering by (assumes phonon scattering), and then averaging over a range of . Note that for low energies and modest values of a considerable part of the spectrum is magnetic in origin for these samples. We have made no attempt to separate out the magnetic contribution from the lattice (nuclear) contribution.
The filter analyzer spectrometer (FANS) uses cooled polycrystalline beryllium and polycrystalline graphite as an analyzer, so that only neutrons with energies below 1.7 meV reach the detectors. The detectors span a large solid angle (1.3 steradians), and the incident energy is scanned to determine the inelastic scattering. In contrast to the Fermi chopper spectrometer this instrument is designed to operate in energy loss mode and no correction needs
to be is made for since a term enters into the resolution volume. A run with an empty sample can was used to remove background. We used a pyrolytic graphite monochromator over the range of 15 meV to 40 meV and a Cu(220) monochromator for energies between 38 meV and 120 meV. Data sets for each sample were merged together after background subtraction. A similar merging was performed to include the low-energy time-of-flight data. After merging, the data were corrected for multiphonon effects, which tended to be significant only above 75 meV. Additional experimental details are given in Ref. [61].
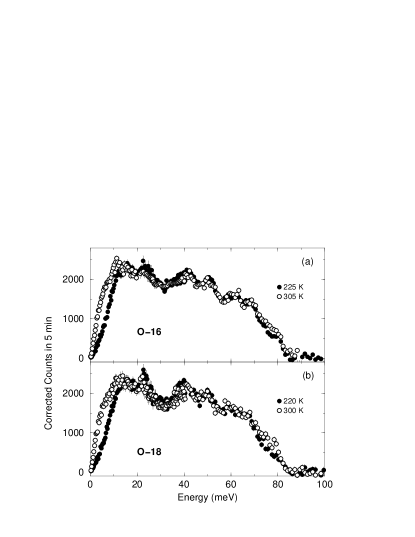
Results for the phonon density-of-states taken above and below appear in Fig. 12. Identifiable peaks appear in the data at 17, 25, 42, 51, and 63 meV. There are no phonons above 85 meV after multiphonon corrections. These observations are in agreement with recent single-crystal measurements of the phonon spectra of La0.7Ca0.3MnO3, which show no phonons above 72 meV and substantial flat regions in the dispersion branches at 23 meV and 50 meV and an optical band near 40 meV.[62] Corresponding peaks in Raman scattering for an sample are found at 17, 25, and 51 meV.[63] Other Raman peaks are also observed at 8, 10, 30, and 54 meV with a broad maximum at 85 meV. Single crystal phonon dispersion measurements on the related CMR compound La0.7Sr0.3MnO3 show phonon branches up to 72 meV with no gaps between branches when averaging over the entire zone.[64] Substantial magnon-phonon interactions have also been reported,[65] but it is likely that these effects can only be observed in single crystals. For the present density-of-states data at low energies there are substantial differences above and below , but this originates from the change in the magnetic scattering from spin diffusion above to propagating spin waves below. At higher energies the biggest difference is in the
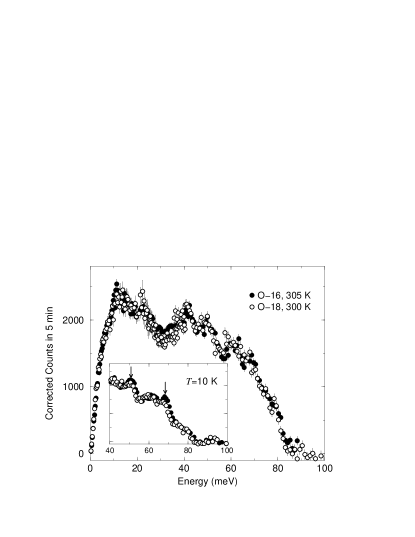
16O data between 75 and 80 meV, where the signal at 305 K is slightly higher than at 225 K. A similar effect can be seen in the 18O data except that the scatter in the data is larger. In other perovskites this energy region corresponds to the oxygen breathing modes but there was no specific peak seen in our data that could be identified with a mode of vibration in this energy region. There may be a slight decrease in intensity of the peak near 51 meV in the 16O data. Both these trends are borne out by measurements at 10 K in the 40 to 100 meV range. The published single crystal results [62] for the sample are far more conclusive and show significant damping effects on the longitudinal Jahn-Teller (100) breathing mode which has an energy of 72 meV at the zone center and 51 meV at the zone boundary. Near the zone boundary the intensity of the phonons strongly decreases with temperature until the mode disappears above . This is consistent with a decrease in the 51 meV peak seen in our data. Similar changes are also seen in the Raman scattering.[63] Overall, however, the changes in the phonon density-of-states are modest.
A comparison between the different samples above also reveals that they are nearly identical, as shown in Fig. 13 where we compare the phonon density-of-states between samples rather than between temperatures. The different temperatures were chosen to reflect the different values. The region that looks most affected by oxygen isotope substitution at these temperatures is between 20 and 40 meV where the scattering intensity near 30 meV is lower for the 18O sample than the 16O sample. Raman measurements by Franck et al. [53] near 0 K showed that the oxygen modes at 28 meV and 53 meV are shifted downward by 1 meV and 2.6 meV for the 18O sample. At low temperatures (inset) there does seem to be a difference in the spectra at 68 meV where the 16O peak may be slightly higher and more clearly defined. Overall, however, only small changes are observed in the density-of-states, either with change in isotope, or with change in temperature above versus below , which is in agreement with recent tunneling data.[66]
V Discussion
The increase in the ferromagnetic transition when 18O is replaced by 16O, and the concomitant extension of the spin wave regime without any change in the overall magnetic energetics, demonstrates in an unambiguous way that the ferromagnetic state is prematurely truncated, and that the transition from the ferromagnetic-metallic state to the paramagnetic-insulator state is first order in nature. For the optimally doped composition the extrapolated Curie point, where the transition would be second order, is just above the observed ferromagnetic transition, indicating that the transition is weakly first order at this composition. It is this proximity to the second-order fixed point that enables the large (30%) decrease in the value of the spin stiffness upon 18O replaced by 16O, making it unambiguous that the ferromagnetic state is truncated. At somewhat higher Ca concentrations the transition in fact becomes second order.[45]
The origin for the first-order truncation is the sudden formation of polarons in the system, which trap the carriers and render the system insulating. It is the polaron formation temperature that determines the observed in the first-order regime, not the strength of the magnetic interactions. Replacing 16O by 18O lowers the energy of the Jahn-Teller phonon, making it easier to form polarons and consequently lowers the transition temperature. The application of stress also lowers the barrier for polaron formation. Lowering the Ca concentration below the composition decreases the observed Curie temperature, while the exchange energy is (initially) unaffected.[19] This downturn in in the phase diagram then originates from lowering the energy for polaron formation, as it becomes easier for the system to form correlated Jahn-Teller distortions; recall that at pure LaMnO3 is strongly Jahn-Teller distorted, forming a structure with long range orbital (and antiferromagnetic) order. The temperature range where the polaron glass is observed [28, 29] would then be expected to become larger with decreasing . This trend continues until the system becomes insulating around , where the double-exchange interaction is lost and the magnetic energetics drops precipitously.[39, 59]
Ultimately it is the structure that determines the energetics for polaron formation, which can be cast in the form of the tolerance factor .[42, 49] The Ca system has a relatively small and forms polarons relatively easily, and the polaron formation occurs in the ferromagnetic state and causes a first-order transition. Larger ions such as Sr or Ba have a substantially larger , and do not appear to form a significant number of polarons below . The ferromagnetic transition then becomes a conventional second-order transition, that is uncoupled from the resistivity transition.[67, 68] It will be interesting to determine if there are dynamic polarons in the Sr and Ba substituted systems.
VI Acknowledgments.
We thank L. Vasiliu-Doloc for her assistance, and thank A. J. Millis, J. A. Fernandez-Baca, P. Dai, and L. Vasiliu-Doloc for helpful discussions. Work at the University of Maryland and Rutgers University was supported by the NSF-MRSEC Grant No. DMR 00-80008. Work at NIST was supported in part by the Binational Science Foundation, grant number 2000073. Work in Moscow was supported by ISTC grant #1859.
REFERENCES
- [1] Present address: Department of Physics, St. Francis Xavier University, Antigonish, N.S. B2G 2W5 Canada and email cadams@stfx.ca.
- [2] Present address: Department of Physics, Astronomy, and Geosciences, Towson University, Towson, MD 21252-0001.
- [3] E. O. Wollan and W. C. Koehler, Phys. Rev. 100, 545 (1955).
- [4] J. B. Goodenough, Phys. Rev. 100, 564 (1955).
- [5] Y. Tokura and N. Nagaosa, Science 288, 462 (2000).
- [6] A. P. Ramirez, J. Phys.: Condens. Matter 9, 8171 (1997).
- [7] For a review of the spin dynamics see J. W. Lynn, J. Supercond. & Novel Mag. 13, 263 (2000).
- [8] E. Dagotto, T. Hotta, and A. Moreo, Phys. Rep. 344, 1 (2001).
- [9] K. H. Kim, M. Uehara, V. Kiryukhin, and S.-W. Cheong, cond-mat/0212113.
- [10] See, for example, A. J. Millis, P. B. Littlewood, and B. I. Shraiman, Phys. Rev. Lett. 74, 5144 (1995); H. Röder, J. Zang, and A. R. Bishop, ibid. 76, 1356 (1996); A. J. Millis, Phys. Rev. B 53, 8434 (1996); C. M. Varma, ibid. 54, 7328 (1996); A. S. Alexandrov and A. M. Bratkovsky, Phys. Rev. Lett. 82, 141 (1999); A. Moreo, S. Yunoki, and E. Dagotto, Science 283, 2034 (1999). P. Schlottmann, Phys. Rev. B 62, 439 (2000); D. I. Golosov, Phys. Rev. Lett. 84, 3974 (2000); J. van den Brink, G. Khaliullin, and D. Khomskii, cond-mat/0206053; Y. Motome and N. Furukawa, cond-mat/0203041
- [11] M. Hennion, F. Moussa, G. Biotteau, J. Rodriguez-Carvajal, L. Pinsard, and A. Revcolevschi, Phys. Rev. Lett. 81, 1957 (1998).
- [12] E. Granado, C. D. Ling, J. J. Neumeier, J. W. Lynn, and D. N. Argyriou (preprint).
- [13] C. Zener, Phys. Rev. 82, 403 (1951).
- [14] G. M. Zhao, K. Conder, H. Keller, and K. A. Müller, Nature (London) 381, 676 (1996).
- [15] S. Mori, C. H. Chen, and S-W. Cheong, Nature (London) 392, 473 (1998); S. Mori, C. H. Chen, and S-W. Cheong, Phys. Rev. Lett. 81, 3972 (1998).
- [16] S. J. L. Billinge, R. G. DiFrancesco, G. H. Kwei, J. J. Neumeier, and J. D. Thompson, Phys. Rev. Lett. 77, 715 (1996); D. Louca, T. Egami, E. L. Brosha, H. Röder, and A. R. Bishop, Phys. Rev. B 56, R8475 (1997).
- [17] A. S. Alexandrov and N. F. Mott, Polarons and Bipolarons (World Scientific, Singapore, 1995).
- [18] J. W. Lynn, R. W. Erwin, J. A. Borchers, Q. Huang, A. Santoro, J-L. Peng, and Z. Y. Li, Phys. Rev. Lett. 76, 4046 (1996); J. W. Lynn, R. W. Erwin, J. A. Borchers, A. Santoro, Q. Huang, J-L. Peng, and R. L. Greene, J. Appl. Phys. 81, 5488 (1997).
- [19] J. A. Fernandez-Baca, P. Dai, H. Y. Hwang, C. Kloc, and S-W. Cheong, Phys. Rev. Lett. 80, 4012 (1998).
- [20] C. P. Adams, J. W. Lynn, Y. M. Mukovskii, A. A. Arsenov, and D. A. Shulyatev, Phys. Rev. Lett. 85, 3954 (2000).
- [21] P. Dai, J. A. Fernandez-Baca, N. Wakabayashi, E. W. Plummer, Y. Tomioka, and Y. Tokura, Phys. Rev. Lett. 85, 2553 (2000).
- [22] L. Vasiliu-Doloc, S. Rosenkranz, R. Osborn, S. K. Sinha, J. W. Lynn, J. Mesot, O. H. Seeck, G. Preosti, A. J. Fedro, and J. F. Mitchell, Phys. Rev. Lett. 83, 4393 (1999).
- [23] S. Shimomura, N. Wakabayashi, H. Kuwahara, and Y. Tokura, Phys. Rev. Lett. 83, 4389 (1999).
- [24] K. H. Kim, M. Uehara, and S-W. Cheong, Phys. Rev. B 62, R11945 (2000).
- [25] J. W. Lynn, C. P. Adams, Y. M. Mukovskii, A. A. Arsenov, and D. A. Shulyatev, J. Appl. Phys. 89, 6846 (2001).
- [26] C. S. Nelson, M. v. Zimmermann, Y. J. Kim, J. P. Hill, D. Gibbs, V. Kiryukhin, T. Y. Koo, S-W. Cheong, D. Casa, B. Keimer, Y. Tomioka, Y. Tokura, T. Gog, and C. T. Venkataraman, Phys. Rev. B 64, 174405 (2001).
- [27] V. Kiryukhin, T. Y. Koo, A. Borissov, Y. J. Kim, C. S. Nelson, J. P. Hill, D. Gibbs, and S-W. Cheong, Phys. Rev. B 65, 094421 (2002).
- [28] D. N. Argyriou, J. W. Lynn, R. Osborn, B. Campbell, J. F. Mitchell, U. Ruett, H. N. Bordallo, A. Wildes, and C. D. Ling, Phys. Rev. Lett. 89, 036401 (2002).
- [29] J. W. Lynn, D. N. Argyriou, F. M. Woodward, Y. Ren, L. Chapon, Y. M. Mukovskii, and D. A. Shulyatev (preprint).
- [30] P. Schiffer, A. P. Ramirez, W. Bao, and S.-W. Cheong, Phys. Rev. Lett 75, 3336 (1995).
- [31] S-W. Cheong and C. H. Chen, in Colosssal Magnetoresistance, Charge Ordering, and Related Properties of Manganese Oxides, edited by B. Raveau and C. N. R. Rao (World Scientific, New Jersey, 1998), p. 241.
- [32] V. N. Smolyaninova, A. Biswas, P. Fournier, S. Lofland, X. Zhang, Guo-meng Zhao, and R. L. Greene, Phys. Rev. B 65, 104419 (2002).
- [33] Q. Huang, A. Santoro, J. W. Lynn, R. W. Erwin, J. A. Borchers, J. L. Peng, K. Ghosh, and R. L. Greene, Phys. Rev. B 58, 2684 (1998).
- [34] G. Biotteau, M. Hennion, F. Moussa, J. Rodriguez-Carvajal, L. Pinsard, A. Revcolevschi, Y. M. Mukovskii, and D. Shulyatev, Phys. Rev. B 64, 104421 (2001).
- [35] For a review of the experimental technique see J. W. Lynn and J. A. Fernandez-Baca, in The Magnetism of Amorphous Metals and Alloys, edited by J. A. Fernandez-Baca and W-Y. Ching (World Scientific, Singapore, 1995), Chap. 5, p. 221.
- [36] L. Vasiliu-Doloc, J. W. Lynn, A. H. Moudden, A. M. de Leon-Guevara, and A. Revcolevschi, Phys. Rev. B 58, 14913 (1998).
- [37] V. Privman, P. C. Hohenberg, and A. Aharony, in Phase Transitions and Critical Phenomena, edited by C. Domb and J. L. Lebowitz (Academic, New York, 1991), p. 1
- [38] T. Okuda, Y. Tomioka, A. Asamitsu, and Y. Tokura, Phys. Rev. B 61, 8009 (2000).
- [39] P. Dai, J. A. Fernandez-Baca, E. W. Plummer, Y. Tomioka, and Y. Tokura, Phys. Rev. B 64, 224429 (2001).
- [40] R. H. Heffner, J. E. Sonier, D. E. MacLaughlin, G. J. Nieuwenhuys, G. Ehlers, F. Mezei, S.-W. Cheong, J. S. Gardner, and H. Röder, Phys. Rev. Lett. 85, 3285 (2000).
- [41] J. M. deTeresa, M. R. Ibarra, P. A. Algarabel, C. Ritter, C. Marquina, J. Blasco, J. Garcia, A. del Moral, and Z. Arnold, Nature (London) 386, 256 (1997).
- [42] W. Archibald, J.-S. Zhou, and J. B. Goodenough, Phys. Rev. B 53, 14445 (1996).
- [43] J. S. Higgins and H. Benoit, Polymers and Neutron Scattering, Oxford (1994).
- [44] See, for example, J. W. Lynn, L. Vasiliu-Doloc, and M. A. Subramanian, Phys. Rev. Lett. 80, 4582 (1998).
- [45] D. Kim, B. Revaz, B. L. Zink, F. Hellman, J. J. Rhyne, and J. F. Mitchell, Phys. Rev. Lett. 89, 227202 (2002).
- [46] R. von Helmolt, J. Wecker, B. Holzapfel, L. Schultz, and K. Samwer, Phys. Rev. Lett. 71, 2331 (1993); S. Jin, T. H. Tiefel, M. McCormack, R. A. Fastnacht, R. Ramesh, and L. H. Chen, Science 264, 413 (1994).
- [47] A. Biswas, M. Rajeswari, R. C. Srivastava, Y. H. Li, T. Venkatesan, R. L. Greene, and A. J. Millis, Phys. Rev. B 61, 9665 (2000); A. Biswas, M. Rajeswari, R. C. Srivastava, T. Venkatesan, R. L. Greene, Q. Lu, A. L. de Lozanne, and A. J. Millis, ibid. 63, 184424 (2001); J. O’Donnell, M. S. Rzchowski, J. N. Eckstein, and I. Bozovic, Appl. Phys. Lett. 72, 1775 (1998); X. W. Wu, M. S. Rzchowski, H. S. Wang, and Qi Li, Phys. Rev. B 61, 501 (2000).
- [48] J. J. Neumeier, M. F. Hundley, J. D. Thompson, and R. H. Heffner, Phys. Rev. B 52, R7006 (1995).
- [49] H. Y. Hwang, S-W. Cheong, P. G. Radaelli, M. Marezio, and B. Batlogg, Phys. Rev. Lett. 75, 914 (1995).
- [50] H. Kuwahara, Y. Moritomo, Y. Tomioka, A. Asamitsu, M. Kasai, R. Kumai, and Y. Tokura, Phys. Rev. B 56, 9386 (1997); H. Kuwahara, Y. Tomioka, Y. Moritomo, A. Asamitsu, M. Kasai, R. Kumai, and Y. Tokura, Science 272, 80 (1996); Y. Tokura, H. Kuwahara, Y. Moritomo, Y. Tomioka, and A. Asamitsu, Phys. Rev. Lett. 76, 3184 (1996).
- [51] I. Isaac and J. P. Franck, Phys. Rev. B 57, R5602 (1998).
- [52] N. A. Babushkina, L. M. Belova, O. Yu. Gorbenko, A. R. Kaul, A. A. Bosak, V. I. Ozhogin, and K. I. Kugel, Nature (London) 391, 159 (1998).
- [53] J. P. Franck, I. Isaac, Weimin Chen, J. Chrzanowski, and J. C. Irwin, Phys. Rev. B 58, 5189 (1998); J. P. Franck, I. Isaac, Weimin Chen, J. Chrzanowski, J. C. Irwin, and C. C. Holmes, J. Supercond. 12, 263 (1999).
- [54] J.-S. Zhou and J. B. Goodenough, Phys. Rev. Lett. 80, 2665 (1998).
- [55] A. K. Heilman, Y. Y. Xue, Y. Y. Sun, R. L. Meng, Y. S. Wang, B. Lorenz, C. W. Chu, J. P. Franck, and W. Chen, Phys. Rev. B 61, 8950 (2000).
- [56] N. A. Babushkina, A. N. Taldenkov, L. M. Belova, E. A. Chistotina, O. Y. Gorbenko, A. R. Kaul, K. I. Kugel, and D. I. Khomskii, Phys. Rev. B 62, 6081 (2000).
- [57] R. A. Fisher, F. Bouquet, N. E. Phillips, J. P. Franck, G. Zhang, J. E. Gordon, and C. Marcenat, Phys. Rev. B 64, 134425 (2001).
- [58] J. J. Rhyne, H. Kaiser, H. Luo, G. Xiao, and M. L. Gardel, J. Appl. Phys. 83, 7339 (1998); J. J. Rhyne, H. Kaiser, L. Stumpe, J. F. Mitchell, T. McCloskey, and A. R. Chourasia, ibid. 87, 5813 (2000); L. Stumpe, B. Kiry, H. Kaiser, J. J. Rhyne, and J. F. Mitchell, ibid. 91, 7511 (2002).
- [59] J. A. Fernandez-Baca, P. Dai, H. Kawano-Furukawa, H. Yoshizawa, E. W. Plummer, S. Katano, Y. Tomioka, and Y. Tokura, Phys. Rev. B 66, 054434 (2002).
- [60] A. J. Millis, B. I. Shraiman, and R. Mueller, Phys. Rev. Lett. 77, 175 (1996).
- [61] I. W. Sumarlin, J. W. Lynn, D. A. Neumann, J. J. Rush, C-K. Loong, J. L. Peng, and Z. Y. Li, Phys. Rev. B 48, 473 (1993).
- [62] J. Zhang, P. Dai, J. A. Fernandez-Baca, E. W. Plummer, Y. Tomioka, and Y. Tokura, Phys. Rev. Lett. 86, 3823 (2001).
- [63] E. Granado, A. Garciá, J. A. Sanjurjo, C. Rettori, and I. Torriani, Phys. Rev. B 63, 64404 (2001).
- [64] W. Reichardt and M. Braden, Physica B 263, 416 (1999).
- [65] P. Dai, H. Y. Hwang, Jiandi Zhang, J. A. Fernandez-Baca, S.-W. Cheong, C. Kloc, Y. Tomioka, and Y. Tokura Phys. Rev. B 61, 9553 (2000).
- [66] H. D. Hudspeth, F. Sharifi, I. J. Guilaran, P. Xiong, and S. von Molnar, Phys. Rev. B 65, 052405 (2002).
- [67] K. Ghosh, C. J. Lobb, R. L. Greene, S. G. Karabashev, D. A. Shulyatev, A. A. Arsenov, and Y. Mukovskii, Phys. Rev. Lett. 81, 4740 (1998).
- [68] J. W. Lynn, L. Vasiliu-Doloc, K. Ghosh, S. Skanthakumar, S. N. Barilo, G. L. Bychkov, and L. A. Kurnevitch (preprint).