Biology helps you to win a game
Abstract
We present a game of interacting agents which mimics the complex dynamics found in many natural and social systems. These agents modify their strategies periodically, depending on their performances using genetic crossover mechanisms, inspired by biology. We study the performances of the agents under different conditions, and how they adapt themselves. In addition the dynamics of the game is investigated.
I Introduction
Is the “survival of the fittest” principle limited to biology only? Perhaps not and there could be other spheres of life in which this principle is applicable. Competition plays a key role and in order to compete and thus survive in any environment or situation, one primarily needs to adapt in order to succeed. Then what is adaptation and evolution? Adaptation is an alteration or adjustment in structure or habits, often hereditary, by which a species or individual improves its condition in relationship to its environment. Evolution is the change in the genetic composition of a population during successive generations, as a result of natural selection acting on the genetic variation among individuals, and resulting in the development of a new species. Here, we show that in the behaviour of various complex systems found in natural and social environments parisi ; huberman ; nowak ; lux ; arthur , that can be characterized by the competition among interacting agents for scarce resources, adaptation to the environment plays a very important role.
These agents could be diverse in form and in capability, ranging for example, from carcinogenic cells in the human body to multinational firms in the global financial market. In these dynamically evolving complex systems the nature of agents and their behaviour differ a lot but they have a common underlying mechanism. In order to have a deeper understanding of the interactions of the large number of agents, one should first consider the individual capabilities of the agents. Its behaviour may be thought of as a collection of simple rules governing “responses” to numerous “stimuli”. The rules of action serve as the agents’ strategies, and the behaviour of an agent is the rules acting sequentially. Therefore, in order to model any complex dynamically adaptive system, a major concern is the selection and representation of the stimuli and responses, since the behaviour and strategies of the component agents are determined thereby. Then the agent needs to adapt to different situations, where the experience of an agent guides it to change its structure so that as time passes, the agent learns to make better use of the environment for its own benefit. However, the timescales over which the agents adapt vary from one individual to another and also from one system to another.
In complex adaptive systems, many interesting temporal patterns are produced, since a major part of the environment of a particular agent includes other adaptive agents and a considerable amount of agent’s effort goes in adaptation and reaction to the other agents. Thus the situation is considerably different and more complicated than in game theory game and conventional theories in economics, where the study is of patterns in behavioural equilibrium that induce no further interaction.
In this paper, we study a simple game based on the basic minority game challet1 ; challet2 ; cavagna ; riolo ; lamper , where the agents adapt themselves by modifying their strategies from time to time, depending on their current performances, using genetic crossover mechanisms holland ; goldberg ; lawrence ; Marko1 . The game can be a very simple representation of a complex adaptive system. We make a comparative study of their performances with the various mechanisms and in a “test” situation.
II Model
In this section we give a brief description of the model. The basic minority game consists of an odd number of agents who can perform at a given time , any of the two possible actions denoted here by or . The minority game was based on the El Farol bar problem, created by Brian Arthur, in which a population of agents have to decide whether to go to the bar every Thursday night, and so there were two possible actions “to attend” denoted by and “not to attend” denoted by , depending on whether the bar was too crowded or not arthur . An agent wins the game if it is one of the members of the minority group. All the agents are assumed to have access to finite amount of “global” information: a common bit-string “memory” of the most recent outcomes. With this there are possible “history” bit-strings. Now, a “strategy” consists of two possible responses, which in the binary sense are an action or action to each possible history bit-strings. Thus, there are possible strategies constituting the whole “strategy space”.
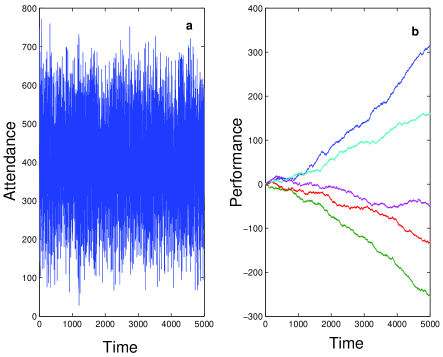
Each time the game has been played, time is incremented by unity and one “virtual” point is assigned to the strategies that predicted the correct outcome and the best strategy is the one which has the highest virtual point score. The performance of a player is measured by the number of times the player wins, and the strategy, which the player uses to win, gets a “real” point. The number of agents who have chosen a particular action, say which represents “to attend”, is denoted by (also referred as “attendance”) and it varies with time. We have plotted the attendance and performance for the basic minority game in Fig. 1.
Now we define the total utility of the system as the number of persons in the minority group at a given time . For convenience, we mathematically define a scaled utility (total utility/maximum utility) as
| (1) |
where , is either equal to or , and is Heaviside step function:
The players examine their performances after every time interval . If a player finds that he is among the fraction (where ) who are the worst performing players, he adapts himself and modifies his strategies. The mechanism by which the player creates new strategies is genetic crossover, whereby he selects the two “parents” from his pool of strategies and creates two new “children” lawrence ; Marko1 , as described in Fig. 2.

If the parents are chosen randomly from the pool of strategies then the mechanism represents a “one-point genetic crossover” and if the parents are the best strategies then the mechanism represents a “hybridized genetic crossover”. The children may replace parents or two worst strategies and accordingly four different interesting cases arise: (a) one-point genetic crossover with parents “killed”, i.e. parents are replaced by the children, (b) one-point genetic crossover with parents “saved”, i.e. the two worst strategies are replaced by the children but the parents are retained, (c) hybridized genetic crossover with parents “killed” and (d) hybridized genetic crossover with parents “saved”.
It should be noted that the mechanism of evolution of strategies is considerably different from earlier attempts challet1 ; li1 ; li2 . This is because in this mechanism the strategies are changed by the agents themselves and even though the strategy space evolves continuously, its size and dimensionality remain the same.
The Hamming distance between two bit-strings is defined as the ratio of the number of uncommon bits to the total length of the bit strings. It is a measure of the correlation between two strategies:
which can be plotted as the game evolves.
III Results
In order to determine which mechanism is the most efficient, we have made a comparative study of the four cases, mentioned earlier. We plot the attendance as a function of time for the different mechanisms in Fig. 3.
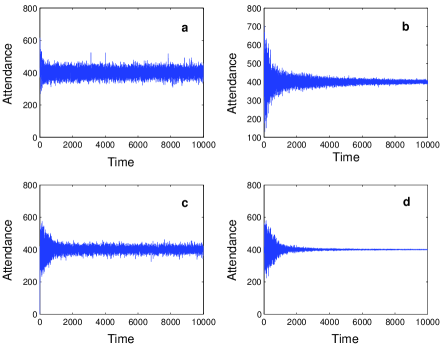
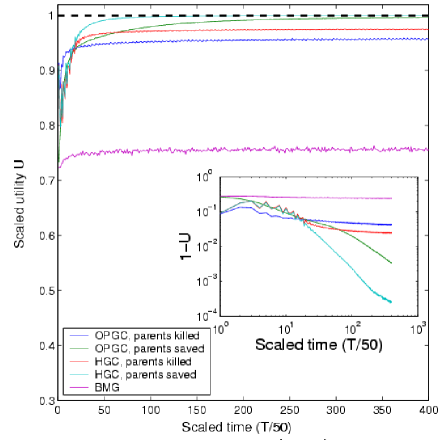
In Fig. 4 we show the total utility of the system in each of the cases (a)-(d), where we have plotted results of the average over 100 runs and each point in the utility curve represents a time average taken over a bin of length 50 time-steps. The simulation time is doubled from those in Fig. 3, in order to expose the asymptotic behaviour better. On the basis of Figs. 3 and 4, we find that the case (d) is the most efficient.
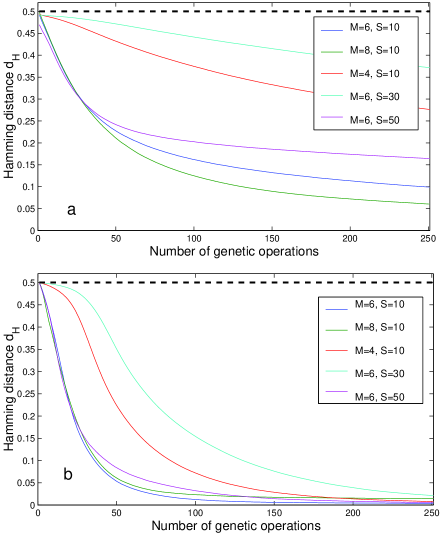
In Fig. 5 (a) one can see the evolution of the average Hamming distance of all the strategies of a player in a game, where the player adapts using one-point genetic crossover and the two worst strategies are replaced by the children and the parents are also saved. It should be noted that the Hamming distance can change only when the worst strategies are replaced by the children and the parents are saved, where the bits in a strategy pool can change over time. Otherwise the bits in the pool of strategies remain the same. We observe that the curves tend to move downwards from around towards zero, which means that as the time evolves, the correlation amongst the strategies increases and the strategies in the pool of a particular agent converges towards one strategy. The nature of the curves depend a lot on the parameters of the game. In Fig. 5 (b) one can see the evolution of the average Hamming distance of all the strategies of a player in the game, where the player adapts using hybridized genetic crossover and the two worst strategies are replaced by the children and the parents are also saved. Here too, the strategies in the pool of a particular agent converges towards one strategy, and at a faster rate than with the previous mechanism. We observe that increasing memory does not change dramatically the convergence rate, but as we increase the number of strategies in the pools, the convergence slows down.
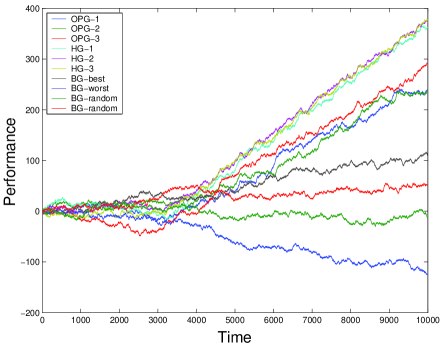
In order to investigate what happens in the level of an individual agent, we created a competitive surrounding– “test” situation where after time-steps, six players begin to adapt and modify their strategies such that three are using hybridized genetic crossover mechanism and the other three one point genetic crossover, where children replace the parents. The rest of the players play the basic minority game. In this case it turns out that in the end the best players are those who use the hybridized mechanism, second best are those using the one-point mechanism, and the bad players those who do not adapt at all. In addition it turns out that the competition amongst the players who adapt using the hybridized genetic crossover mechanism is severe.
IV Conclusion
We can summarize our findings by stating that adaptation improves not only the individual player’s performance but also improves the total utility of the system. The best results are found for the players who adapt and modify their strategies using the hybridized genetic crossover mechanism and the children replace the two worst strategies and the parents are saved. The mechanism of adaptation is very simple and can be used to model different complex adaptive systems. It can also be potentially developed to include other features like mutation. We can thus say that in a way, “biology helps you to win a game”.
Acknowledgements.
This research was partially supported by the Academy of Finland, Research Centre for Computational Science and Engineering, project no. 44897 (Finnish Centre of Excellence Programme 2000-2005).References
- (1) G. Parisi, Physica A 263, 557 (1999).
- (2) B. A. Huberman, P. L. T. Pirolli, J. E. Pitkow and R. M. Lukose, Science 280, 95 (1998).
- (3) M. Nowak and R. May, Nature 359, 826 (1992).
- (4) T. Lux and M. Marchesi, Nature 397, 498 (1999).
- (5) W. B. Arthur, Am. Econ. Rev. 84, 406 (1994).
- (6) R. Myerson, Game Theory: Analysis of Conflict (Harvard University Press, Cambridge, Massachusetts, 1991).
- (7) D. Challet and Y.-C. Zhang, Physica A 246, 407 (1997).
- (8) D. Challet, M. Marsili and R. Zecchina, Phys. Rev. Lett. 84, 1824 (2000).
- (9) R. Savit, R. Manuca and R. Riolo, Phys. Rev. Lett. 82, 2203 (1999).
- (10) A. Cavagna, J. P. Garrahan, I. Giardina and D. Sherrington, Phys. Rev. Lett. 83, 4429 (1999).
- (11) D. Lamper, S. D. Howison and N. F. Johnson, Phys. Rev. Lett. 88, 17902 (2002).
- (12) J. H. Holland, Adaptation in Natural and Artificial Systems, University of Michigan Press, Ann Arbor (1975).
- (13) D. E. Goldberg, Genetic Algorithms in Search, Optimization and Machine Learning, Addison-Wesley, Reading, Massachusetts (1989).
- (14) D. Lawrence (Ed.), Handbook of Genetic Algorithms, Van Nostrand Reinhold, New York (1991).
- (15) M. Sysi-Aho, A. Chakraborti and K. Kaski, preprint available at cond-mat/0209525 (2002); Physica A, in press (2003).
- (16) Y. Li, R. Riolo and R. Savit, Physica A 276, 234 (2000).
- (17) Y. Li, R. Riolo and R. Savit, Physica A 276, 265 (2000).