First Principles Calculations of Ionic Vibrational Frequencies in
Abstract
Lattice dynamics for several ordered supercells with composition (PMN) were calculated with first-principles frozen phonon methods. Nominal symmetries of the supercells studied are reduced by lattice instabilities. Lattice modes corresponding to these instabilities, equilibrium ionic positions, and infrared (IR) reflectivity spectra are reported.
There is ample evidence of 1:1 (NaCl-type; the “random layer model” Davies ) short-range order (SRO) in PMN Krause , but first principles (FP) calculations with sufficiently large supercells to realistically approximate a SRO-disordered PMN crystal are prohibitively time consuming. Relatively small supercells that might reasonably approximation include the structure which was predicted to be the PMN cation-ordering ground state (GS) Burton02 .
One objective of this study is to compute the relaxed GS for different small supercells consisting of 15 and 30 ions, to compare their energies, to compute the relaxed coordinates, dynamical charges, vibrational frequencies, and infrared (IR) reflection spectra for the GS. These results are important to understand possible contribution of the ordered structures to IR reflection and Raman spectra.
A second objective is understanding the nature of the soft vibrational modes in the ordered structures of PMN. It has been reported that relaxors exhibit both ferroelectric (FE) and antiferroelectric (AFE) characteristics, Egami and that competition between FE and AFE fluctuations are the cause of glass-type properties in PMN.
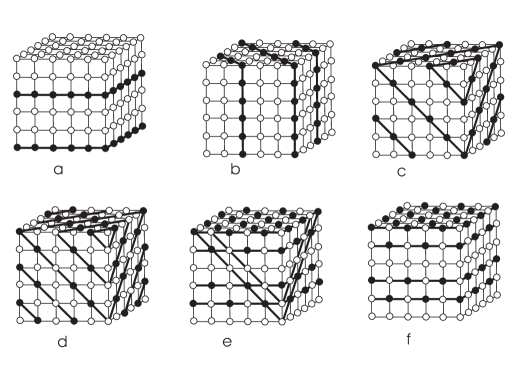
All FP calculations were done with the Vienna ab initio simulation package (VASP) Kresse1 . Several supercells of PMN composition were considered (Fig. 1). Our FP computations show that all these structures are dynamically unstable when the ions are placed on ideal perovskite positions, and full relaxation often leads to suprisingly low symmetry. For example, the FP GS of the structure (an superlattice) is monoclinic with the Pb close to Mg displaced in the (0.18Å,0.05Å,-0.05Å) and (0.18Å,0.05Å,0.05Å) directions. The Pb ions which are between the Nb planes are mostly displaced in the direction by 0.27 Å).
| type | type | type | |||||||||
|---|---|---|---|---|---|---|---|---|---|---|---|
| Mg1 | 7.98 | -0.02 | 8.16 | Mg2 | 4.00 | -0.00 | 4.08 | Nb1 | 4.01 | -0.09 | 8.11 |
| Nb2 | 3.95 | -0.04 | 0.08 | Nb3 | 7.93 | -0.02 | 0.00 | Nb4 | 3.99 | -3.98 | 4.12 |
| O1 | 2.04 | 0.40 | 8.10 | O2 | 5.96 | -0.31 | 8.04 | O3 | 4.40 | 1.98 | 8.12 |
| O4 | 3.66 | -1.98 | 8.10 | O5 | 2.05 | 0.17 | 0.00 | O6 | 6.03 | -0.03 | 12.02 |
| O7 | 4.18 | 2.01 | 12.12 | O8 | 4.00 | -1.98 | 12.07 | O9 | 1.98 | 0.00 | 3.86 |
| O10 | 6.06 | 0.06 | 3.96 | O11 | 4.02 | 2.06 | 3.87 | O12 | 4.06 | -2.02 | 3.92 |
| O13 | 0.27 | -0.01 | 10.21 | O14 | 4.00 | -3.92 | 1.94 | O15 | 0.11 | -0.04 | 6.09 |
| O16 | 3.97 | 0.14 | 10.11 | O17 | 4.12 | 0.02 | 1.95 | O18 | 3.95 | 0.20 | 6.13 |
| Pb1 | 5.75 | 1.99 | 10.07 | Pb2 | 5.96 | 1.98 | 2.41 | Pb3 | 5.84 | 1.87 | 6.30 |
| Pb4 | 1.89 | 1.74 | 10.10 | Pb5 | 5.95 | -2.04 | 2.40 | Pb6 | 2.06 | 1.83 | 6.27 |
Tetragonal PMN is also dynamically unstable, and has has a wide spectrum of instabilities that are associated with FE, AFE, octahedral tilting and other modes. We relaxed the structure after a random initial perturbation of the ions. Relaxed coordinates are listed in Table 1. The basis vectors are: (4.00, -4.00, 0.00), (4.01,4.01,0.01), (0.00,-0.01,34.07) relative to cubic perovskite. Relaxations of ionic coordinates are a complex mixture of octahedral deformations around Mg-ions (with rather large frozen angles) plus AFE, and FE, Pb-displacements in opposition to neighboring O-ions. The -direction displacements differ from -direction displacements. Pb-ions have either two, or four, Mg nearest neighbors (nn): Pb-ions with two Mg nn are displaced, by 0.25 Å, towards the centroid of the nearest Mg-Mg second-nn pair. Pb-ions with four Mg-nn are not displaced. Although we can not prove that the structure in Table 1 is the PMN GS (further relaxations may still reduce its energy in the case), it is dynamically stable and has lower energy than PMN that is relaxed with only FE displacements, or only octahedral tilting.
Dynamical charges for the tetragonal [001] structure are listed in Table 2. Nb ions that have Nb nn in the directions have particularly large . Dynamical charges for Pb also exhibit significant anisotropy, and environment dependence.
| ion | ion | ion | |||||||||
|---|---|---|---|---|---|---|---|---|---|---|---|
| Mg1 | 2.74 | 2.65 | 2.65 | Mg2 | 2.74 | 2.65 | 2.65 | Nb1 | 6.48 | 6.00 | 6.00 |
| Nb2 | 7.87 | 9.11 | 9.11 | Nb3 | 7.87 | 9.11 | 9.11 | Nb4 | 6.48 | 6.00 | 6.00 |
| O1 | -2.61 | -3.62 | -2.82 | O2 | -2.61 | -3.62 | -2.82 | O3 | -2.61 | -2.82 | -3.62 |
| O4 | -2.61 | -2.82 | -3.62 | O5 | -1.99 | -7.04 | -2.09 | O6 | -1.99 | -7.04 | -2.09 |
| O7 | -1.99 | -2.09 | -7.04 | O8 | -1.99 | -2.09 | -7.04 | O9 | -2.61 | -3.62 | -2.82 |
| O10 | -2.61 | -3.62 | -2.82 | O11 | -2.61 | -2.82 | -3.62 | O12 | -2.61 | -3.62 | -2.82 |
| O13 | -4.15 | -2.57 | -2.57 | O14 | -5.71 | -2.42 | -2.42 | O15 | -3.93 | -2.44 | -2.44 |
| O16 | -5.71 | -2.42 | -2.42 | O17 | -4.15 | -2.57 | -2.57 | O18 | -3.93 | -2.44 | -2.44 |
| Pb1 | 3.52 | 4.41 | 4.41 | Pb2 | 3.52 | 4.41 | 4.41 | Pb3 | 4.17 | 3.93 | 3.93 |
| Pb4 | 3.52 | 4.41 | 4.41 | Pb5 | 3.52 | 4.41 | 4.41 | Pb6 | 4.17 | 3.93 | 3.93 |
According to Ghosez Ghosez , dynamical (Born) charges are associated with the average field but not with the local field , as the Szigeti charge is Szigeti . However the product of the Born charge with the average field must equal the product of the Szigeti charge with the local field, Ghosez . It follows that
| (1) |
Consider the average field in a stack of -layers with different dielectric permittivities and :
| (2) |
where is an external field, is sample length parallel to the field, and are the lengths of stacked layers. The local field in a uniform dielectric is
| (3) |
Substituting these expressions into the initial one yields:
| (4) |
It follows that, with two layers, one with low and the other with high electronic dielectric permittivity, in the more polarizable layer decreases, and in the less polarizable layer increases. The FP calculations follow this trend: , which is less polarizable, increases while , which is more polarizable, decreases. Within the Nb plane, one calculates more normal values for .
| ion | ion | ion | |||||||||
|---|---|---|---|---|---|---|---|---|---|---|---|
| Mg1 | 346 | 328 | 340 | Mg2 | 276 | 340 | 344 | Nb1 | 279 | 271 | 290 |
| Nb2 | 322 | 276 | 270 | Nb3 | 318 | 286 | 251 | Nb4 | 301 | 288 | 283 |
| O1 | 385 | 537 | 333 | O2 | 262 | 608 | 251 | O3 | 399 | 331 | 521 |
| O4 | 256 | 267 | 648 | O5 | 300 | 640 | 248 | O6 | 263 | 657 | 257 |
| O7 | 297 | 272 | 625 | O8 | 281 | 246 | 633 | O9 | 292 | 577 | 302 |
| O10 | 281 | 612 | 278 | O11 | 285 | 278 | 600 | O12 | 279 | 299 | 613 |
| O13 | 555 | 264 | 294 | O14 | 661 | 267 | 261 | O15 | 735 | 214 | 207 |
| O16 | 557 | 241 | 250 | O17 | 733 | 233 | 253 | O18 | 596 | 244 | 245 |
| Pb1 | 108 | 88 | 76 | Pb2 | 81 | 78 | 81 | Pb3 | 93 | 81 | 68 |
| Pb4 | 105 | 76 | 89 | Pb5 | 88 | 79 | 70 | Pb6 | 92 | 67 | 76 |
For the 30-ion structure, computed diagonal frequencies of the dynamical matrix are listed in Table 3. The frequencies of Nb-, Mg- and bending O-vibrations are all between (200 to 350) cm-1. The O-vibrations along Mg-O and Nb-O bonds range from (520 to 735) cm-1. The Pb diagonal frequencies are in the range (67 to 108) cm-1.
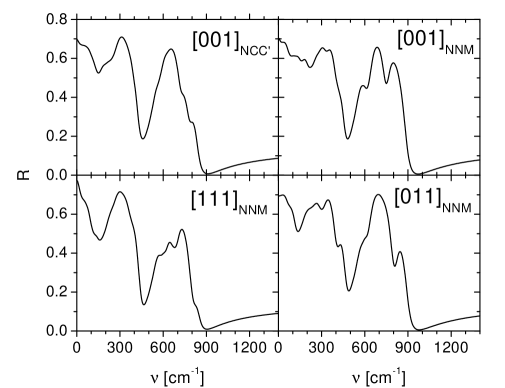
As in experiment Reaney , computed IR reflection spectra (Fig. 2) consist of three main reststrahlen bands of the vibrational modes that are typical of perovskites: the first group is below 120 cm-1; the second spreads from 150 cm-1 to 400 cm-1; and the third is from 500 cm-1 to 800 cm-1. The two lower bands split into two subbands each. Assignments of these bands can be made on the basis of the diagonal frequencies shown in Table 3. In experimental data Reaney , these groups of lines are rather compact as in the computed [001] and [111]MNN structures. However the experimentally determined magnitude of the reflectivity in the interval from 500 cm-1 to 800 cm-1 is lower than in the computation. This could be connected with an overestimation of the oxygen dynamical charge and/or with large damping for some frequencies in this interval (an estimated damping constant of 60 cm-1 was used for all frequencies), or it could be that the systems studied here are not sufficiently representative of SRO-disordered PMN.
The lowest calculated optical frequency in the equilibrium 30-ion [001] structure is 24 cm-1. It is lower than the lowest Pb diagonal frequency (60 cm-1) shown in Table 3 because of the interaction among the ionic vibrations. This mode is a mixture of opposite but not fully compensated Pb-displacements. Other Pb-related modes are spread over the interval (24 to 129) cm-1. Ferroelectric Pb displacements are at (40 and 60 to 90) cm-1 although some contribution to exists in the whole interval from 24 cm-1 to 129 cm-1. Some modes in this interval have large Pb components for definite sites that implies that these modes are quasilocal. The same can be said of some modes in the frequency interval from 500 cm-1 to 800 cm-1: some of these modes have a very large components corresponding to oxygen vibrations along Nb-O-Mg bonds.
Raman spectra show broad lines with gradual temperature dependence in a wide temperature interval Yuzuk ; Husson . The presence of these lines would be forbidden if the ions were in symmetric environments. Ionic displacements due to disorder and symmetry breaking can explain the existence of these Raman lines. A possible measure of the intensities of these lines is the square of the projection of the ionic displacements, from symmetric positions, onto the vibrational modes: , where is the vector of the frozen displacements, and is the vector of the -th vibration in the displacements’ representation.
Low-frequency Raman lines (about 50 cm-1 may be related to the quasilocal Pb-O vibrations Husson . Note that as is typical of Pb-based perovskites that also have large B-cations, such as Mg, that Pb-vibrational branches have relatively small dispersion and are unstable across most of the Brillouin zone. The particular instabilities that freeze in depend sensitively on the local electric fields produced by the Nb-Sc configuration. Freezing of lattice instabilities creates low-symmetry Pb-sites, and also allows AFE Pb-vibrations to couple with FE vibrations.
Calculated structural instabilities in the various supercells imply reductions in their formation energies relative to the values reported in Burton and Cockayne Burton02 , but the hierarchy of formation energies and predicted GS, , are the same. Column one in Table 4 corresponds to the structures with symmetry restrictions imposed (for instance, tetrgonal symmetry was imposed for [001]MNN and [001]). Column two includes relaxation energy, to the GS for each structure.
There are many possible ordered derivatives of the random layer modelDavies that have (111) Nb-layers which alternate with (111) (Nb1/3Mg2/3)-layers in which Nb and Mg are ordered; e.g. Fig. 1d. Some mixed layers in this structure are ordered in stripes and others in an Nb-honeycomb pattern with Mg’s at hexagon centers. This structure has a large formation energy relative to the others in Figs. 1. Apparently intralayer cation ordering increases the total energy relative to a disordered configuration. This is consistent with the conclusion of Hoatson et al.Hoatson who obtained an improved inverse Monte Carlo fit to NMR data with the assumption of Mg-Mg and Nb-Nb clustering within mixed layers. The structure shown in Fig. 1e also has higher energy than .
| ideal structure | relaxed structure | |
| 0.825 | 0.583 | |
| 0.710 | 0.155 | |
| 0.696 | 0.150 | |
| 0.523 | 0 |
Finally, our FP computations have shown that the relaxation of the ionic coordinated in the small supercells of PMN does not change the hierarchy of the energy of these structures: [001] remains to be the GS among the small supercells considered. The low frequency vibrations in this structure is connected with AFE Pb vibrations and with Pb-O stretching mode. The computed IR reflection spectrum, qualitatively, corresponds to experimental data Reaney although there are some discrepancies in the line magnitudes at high frequencies.
S.A.P. appreciates discussions with Toulouse, Svitelskiy, Petzelt, Kamba and Yuzuk.
References
- (1) P. K. Davies and M. A. Akbas, J. Phys. Chem. Sol. 61, 159 (2000).
- (2) H.B. Krause, J.M. Cowley and J. Wheatley, Acta. Cryst. A35, 1015 (1979).
- (3) B. P. Burton and E. Cockayne, Ferroelectrics 270, 173 (2002).
- (4) T. Egami, Ferroelectrics 267, 101 (2002).
- (5) G. Kresse and J. Hafner, Phys. Rev. B47, 558 (1993).
- (6) Ph. Ghosez, Phys. Rev. B58, 6224 (1998).
- (7) B. Szigeti, Trans. Faraday Soc. 45, 155 (1949).
- (8) I. M. Reaney, J. Petzelt, V. V. Voitsekhovskii, F. Chu, and N. Setter, J. Appl. Phys. 76, 2086 (1994).
- (9) V. I. Torgashev, Yu. I. Yuzyuk, L. T. Latush, P. N. Timonin, and R. Farhi, Ferroelectrics 199, 197 (1997).
- (10) E. Husson, L. Abello, and A. Morell, Mat. Res. Bull. 25, 539 (1990).
- (11) G.L. Hoatson, D.H. Zhou, F. Fayon, D. Massiot, and R.L. Vold Phys. Rev. B66 224103 (2002).