Heavy Carriers and Non-Drude Optical Conductivity in MnSi
Abstract
Optical properties of the weakly helimagnetic metal MnSi have been determined in the photon energy range from 2 meV to 4.5 eV using the combination of grazing incidence reflectance at (2 meV to 0.8 eV ) and ellipsometry (0.8 to 4.5 eV). As the sample is cooled below 100 K the effective mass becomes strongly frequency dependent at low frequencies, while the scattering rate developes a linear frequency dependence. The complex optical conductivity can be described by the phenomenological relation used for cuprates and ruthenates.
pacs:
78.20.-e,78.30.-j,71.27.+a,71.28.+d,75.30.-m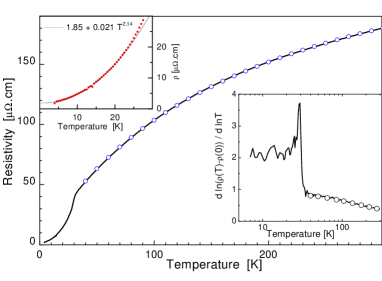
The weakly helimagnetic metal MnSi ( K) has been the subject of intensive studies during the last 40 years. In the helimagnetic phase the resistivity has a dependence, which has been explained as resulting from a coupling of the charge carriers to spin fluctuationsmoriya . Recently interest has shifted to the quantum phase transition pfleiderer ; pfleiderer-nature at a critical pressure of kbar where the Curie temperature becomes zero. The temperature dependence of the resistivity outside the magnetically ordered region, at high pressures, has been found to be proportional to in temperature range far larger than that predicted by the so-called nearly ferromagnetic Fermi-liquid theory (an extension of the Fermi-liquid picture)pfleiderer-nature . This fact has suggested the non-Fermi liquid nature of MnSi in the normal state pfleiderer-nature . Despite these efforts in understanding the physics behind MnSi, few attempts have been made to determine and understand its optical properties. Measurements below of the far infrared normal incidence reflectivity indicated a remarkable departure from the Hagen-Rubens law, usually observed in metalsdamascelli . However, the high value of the reflection coefficient close to the 100 line prevented a detailed analysis of the frequency dependent optical conductivity in this range. In this Letter we overcome this hurdle by using -polarized light at a grazing angle of incidence of , for which the reflection coefficient drops well below the 100 line. We show that the frequency dependent scattering rate, and the effective mass deviate from the behavior expected for Fermi liquids which can be described with an expression for that departs from the usual Drude model.
Single crystals were grown using the travelling floating zone techniquedamascelli ; fath . The temperature dependence of the resistivity is shown in Fig. 1. Fitting the resistivity to the equation in the temperature interval 4K to 23K, we obtain .cm, .cm.K-μ, and . The resistivity increases more rapidly in the region between 23 K and the phase transition. For K the resistivity fits to the formula with cm and cmK-1. The remarkable accuracy of this description is further confirmed by the logarithmic derivative shown in the inset of Fig. 1. The tendency of the resistivity toward saturation at a value for is in agreement with Calandra and Gunnarsson’s resultgunnarsson that the resistivity saturates when the mean free path (roughly the Ioffe-Regel limit), where is the density of the electrons and is lattice parameter. Also this indicates that, if the temperature saturation would be absent, the resistivity would be proportional to , where the exponent with a very high accuracy. These observations stand in stark contrast to the temperature dependence predicted from the model of spin-fluctuations in itinerant electron magnetismmoriya . Yet the overall temperature dependence, and the strong reduction of below indicate a dominant electronic (or spin) contribution to the scattering mechanism.
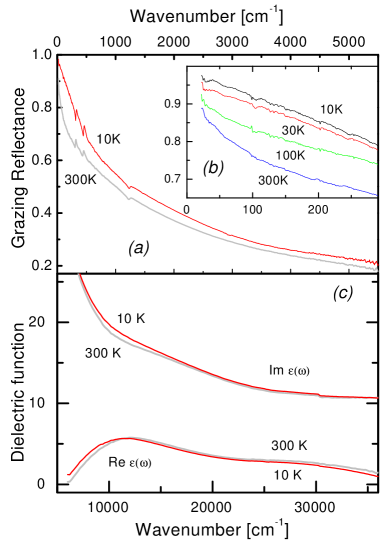
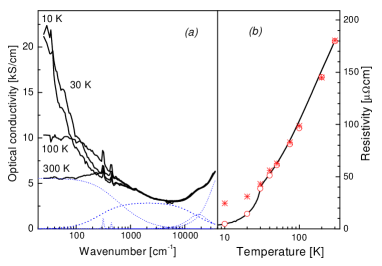
Grazing incidence reflectivity was measured in the range 20 to 6000 cm-1 using a Bruker 113v FT-IR spectrometer (see Fig. 2a and 2b). The temperature dependence was measured using a home-built cryostat, the special construction of which guarantees the stable and temperature independent optical alignment of the sample. The intensities were calibrated against a gold reference film which was evaporated in situ without repositioning or rotating the sample-holder. In the range 20 to 100 cm-1 we measured the temperature dependence of the grazing reflectivity with 0.5 K intervals below 50 K and 2 K intervals above 50 K. The complex dielectric function in the range 6000 to 36000 cm-1 was measured with a commercial (Woollam VASE32) ellipsometric spectrometer for the same set of temperatures as the grazing reflectivities using an ultra high vacuum cryostat (shown for 10 K and 300 K in Fig. 2c). The complex dielectric function was calculated from the complete data set (grazing infrared reflectance and visible ellipsometry) using Kramers-Kronig relations, following the procedure described in Ref. eb, . Below 20 cm-1 the reflectivity data were extrapolated to fit the experimentally measured DC conductivities. The optical conductivity is shown for some temperatures in Fig. 3.
The first remarkable feature in the spectra is the similarity of the optical conductivity to the response of heavy fermion systemsdegiorgi . In those materials, has almost no temperature dependence down to a frequency of 10 cm-1 and, below this frequency, a narrow mode centered at zero frequency is formed degiorgi . Similar behavior has also been noticed for -ceriumeb in the mid-infrared frequency range. Following a common procedure in the study of the electrodynamic response of heavy fermion systems, we have calculated and from the optical conductivity using the extended Drude-model hopfield :
| (1) |
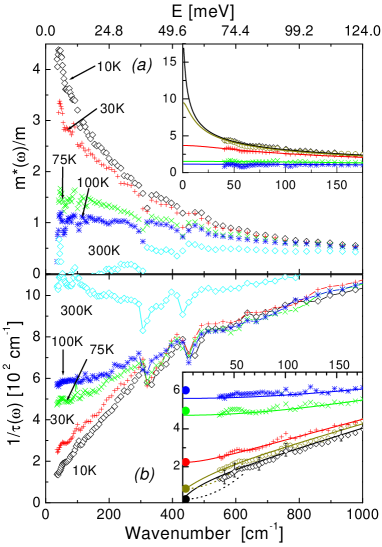
adopting the value cm-1 for the plasma frequency, motivated by the least square fits which we will discuss below. Fig. 4a indicates a significant mass renormalization at low frequencies which, at the lowest measured temperatures, shows no indication of reaching a frequency independent value. Previous de Haas-van Alphen experiments (at 0.35 K) taillefer provided an average enhancement of 4.5 times the cyclotron mass, although values as high as 14 were observed for some of the orbits. This average value was found to be compatible with the enhancement of the linear coefficient of the heat capacity 5.2 calculated from specific heat data of Ref. fawcett, . In comparison, our data show at 10 K and at the lowest measured frequency an enhancement of 4, and an enhancement of 17 when we extrapolate the data to .
The second remarkable feature is the behavior of (Fig. 4b). At high temperatures this quantity becomes frequency independent, as expected for a Drude peak. Already at 100 K is no longer a constant. Approaching the phase transition becomes strongly frequency dependent between 30 and 300 cm-1 and it follows approximately a linear frequency dependence in this frequency range. In contrast, other correlated systems, such as heavy fermions degiorgi ; eb and perovskite titanates katsufuji , show a frequency-dependent scattering rate with an dependence at low frequencies. Indeed the theory of Fermi liquids pines predicts
| (2) |
with . The same expression was obtained by Millis and Lee considering the Anderson lattice model millis , and qualitatively similar behavior has been calculated by Riseborough in the context of spin-fluctuationsriseborough . MnSi has also a dependence of the DC resistivity below and the corresponding expected frequency dependence of is plotted in the inset of the lower panel of Fig. 4 (dotted lines) for 10 and 20 K. There is a mismatch with the experimental , both in absolute value and the observed trend, which is outside the experimental error bars. However it can not be excluded, that at an even lower frequency the experimental would cross over to a -dependence.
Above, we have pointed out various striking results in the optical response of MnSi. In order to understand their nature, let us take a closer look at the low frequency data. From 300 to 75 K, follows a behavior (see Fig. 2b). This can be easily understood from the fact that at low frequencies, from the Fresnel formulae, can be written approximately as:
| (3) |
where is the angle of incidence. In the case that is constant and goes to zero, this expression reduces to the well known Hagen-Rubens law. In the Drude picture this corresponds to the frequency range where the scattering rate is larger than . In contrast, below 75 K our measured does not follow a behavior. Combining the Drude model with the Fresnel equations for reflectivity, a plateau in the reflectivity is expected for intermediate frequencies (frequencies larger than the scattering rate but much lower than the plasma frequency). To check this more closely we measured below 100 cm-1 in a finer temperature mesh. Our results show no sign of a plateau, instead evolves gradually to a linear frequency dependence when T is lowered. We can then conclude that either the peak centered at zero frequency departs from the Drude picture or other modes appear at low temperatures and at low frequencies.
To distinguish between these alternatives we have fitted, simultaneously, the measured reflectivity, ellipsometry and resistivity with two models. First we modelled the data with a Drude peak and a set of oscillators. In this case, the fit fails to reproduce the measured DC resistivities at low temperatures (stars in Fig. 3b). On the other hand, if we give more fitting weight to , the result is a poor fit of at low frequencies. Although this can in principle by remedied by introducing an arbitrary number of oscillators at frequencies below 100 cm-1, the infrared properties together with the DC resistivity can be summarized in an economical way (i.e. requiring a minimal set of adjustable parameters) when we replace the Drude formula withmarel-nfl
| (4) |
which for corresponds to the model by Ioffe and Millisioffe-millis , and for to Anderson’spwa power-law formula , both in the context of the optical conductivity of the cuprate high Tc superconductors. Eq. 4, in the case , has been shown to describe the optical conductivity of SrRuO3, below 40 K, in the range [6-2400]cm-1 with dodge . For SrRuO3 this behavior has been justified as arising from the coupling of electrons to orbital degrees of freedomlaad , and in the context of the discrete filamentary model of charge transportphillips .
Our new fit, non-Drude plus Lorentz oscillators (whose individual components at 300 K are displayed in Fig. 3a), gives the same overall result at high temperatures (75 K) as the Drude fit. However, at low temperatures, the non-Drude equation gives a better fit at low frequencies and, what is more important, reproduces at all temperatures (open symbols in Fig. 3b). Therefore, we conclude that the low frequency optical response of MnSi is best described by Eq. 4. From the fit we can extrapolate the optical properties to lower frequencies (insets of Fig. 4). The extrapolation shows that at 10 K, for , , with a gradual decay as a function of increasing frequency. Similarly, is approximately proportional to in the frequency range below 300 cm-1. Above , it has a weak frequency dependence.
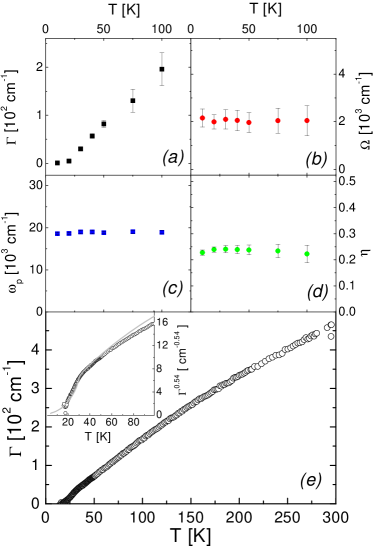
Now let us analyze the parameters of the non-Drude conductivity as provided by the fit to Eq. 4. These values are summarized in Fig. 5a-d where the error bars represent the interval of confidence calculated for a variation of 1% of . Within those error bars, the parameters , and are temperature independent, which contrasts with the strong temperature dependence of . This has another interesting consequence in connection with the DC resistivity. From Eq. 4 we can easily see that , but since , and are temperature independent, . For our sample, using the values of cm-1, cm-1 and (from Fig. 5), we obtain [.cm]. Recently, Dodge et al.dodge have emphasized a similar non-linear relationship between the DC resistivity and the parameter in the case of the weak itinerant ferromagnet SrRuO3. The conclusions for SrRuO3 have been questioned recently by Capogna et al.capogna , who argued that the true temperature dependence of the optical properties may have been masked by the large residual resistivity of the sample used in Ref. dodge, . In the present work this problem is absent due to the low residual resistivity of single crystalline MnSi. In fact, we can go a step further and try to give a detailed picture of the temperature dependence of . For that purpose we fit the low frequency (at all the measured temperatures) to Eq. 4 using the known values of , and . The values obtained for are displayed in Fig. 5e. The inset shows and . We can see that the model represented by Eq. 4 describes the measured data (reflectivity and resistivity) down to approximately 20 K. Below this temperature a fit only to reflectivity produces unphysical negative values for . However, introducing the measured produces a which is not more than twice that obtained when fitting only reflectivity. Apparently at low temperatures there are still details which Eq. 4 is not able to describe.
At low frequencies, deviations from the Drude formula of the optical conductivity have been seen accompanied by deviations from in . Well known examples are YBCO schlesinger and more recently CaRuO3 lee . Therefore, a departure from Drude behavior has been usually considered as evidence against Fermi-liquid behavior. Here, for MnSi, we are confronted with an atypical case. The resistivity has a quadratic temperature dependence, but the optical conductivity is better described by Eq. 4 with , a clear departure from the Drude formulation. Moreover, instead of an -type frequency dependent scattering rate, which is usually observed in strongly interacting Fermi-liquids eb ; degiorgi , here has a linear frequency dependence. Although Eq. 4 summarizes in a compact way the low frequency optical response, differing in a fundamental way from conventional Drude behavior, its microscopic origin is as yet not fully understood.
For frequencies below 300 cm-1 and for K the situation can be summarized as follows: (i) decreases from 17 to 1 as temperature and frequency are increased. (ii) Phenomenologically the DC conductivity and the optical conductivity follow . In this formulation below , whereas above Tc the temperature temperature dependence is approximately linear. (iii) For the scattering rate is proportional to and in contradiction with the theory of weak itinerant ferromagnetism.(iv) For the scattering rate is proportional to and . Given the frequency range for this type of measurements, we can not exclude the possibility, that for frequencies below 30cm-1 the scattering rate crosses over to the Fermi-liquid result .
This project is supported by the Netherlands Foundation for Fundamental Research on Matter with financial aid from the Nederlandse Organisatie voor Wetenschappelijk Onderzoek.
References
- (1) T. Moriya, Spin Fluctuations in Itinerant Electron Magnetism, Springer, Berlin (1985).
- (2) C. Pfleiderer et al., Phys. Rev. B 55, 8330 (1997).
- (3) C. Pfleiderer, S.R. Julian and G.G. Lonzarich, Nature 414, 427-430 (2001).
- (4) A. Damascelli, Ph.D. Thesis, University of Groningen, the Netherlands (1999).
- (5) M. Fäth, Ph.D. Thesis, University of Leiden, the Netherlands (1999).
- (6) M. Calandra and O. Gunnarsson, Phys. Rev. B 66, 205105 (2002).
- (7) J. W. van der Eb et al., Phys. Rev. Lett. 86, 3407 (2001).
- (8) L. Degiorgi, Rev. Mod. Phys. 71, 687 (1999).
- (9) J. W. Allen et al., Phys. Rev. B 15, 2952 (1977).
- (10) L. Taillefer et al., J. Mag. and Mag. Mat. 54-57, 957 (1986).
- (11) E. Fawcett et al., Intern. J. Magn. 1, 29 (1970).
- (12) T. Katsufuji and Y. Tokura, Phys. Rev. B 60, 7673 (1999).
- (13) D. Pines and P. Noziers, The Quantum Theory of Solids (Benjamin, New York, 1966).
- (14) A. J. Millis and P. A. Lee, Phys. Rev. B 35, 3394 (1987).
- (15) P. S. Riseborough, Phys. Rev. B 27, 5775 (1983).
- (16) D. van der Marel, Phys. Rev. B 60, R765 (1999).
- (17) L. B. Ioffe, and A. J. Millis, Phys. Rev. B 58, 11631 (1998).
- (18) P. W. Anderson, Phys. Rev. B 55, 11785 (1997).
- (19) J. S. Dodge et al., Phys. Rev. Lett. 85, 4932 (2000). The definition of the exponent in the present Letter is related to the exponent of Dodge et al. through
- (20) M. S. Laad and E. Müller-Hartmann, Phys. Rev. Lett. 87, 246402 (2001).
- (21) J. C. Phillips, Phil. Mag. B 81, 757 (2001).
- (22) L. Capogna et al., Phys. Rev. Lett. 88, 76602 (2002).
- (23) Z. Schlesinger et al., Phys. Rev. Lett. 65, 801 (1990).
- (24) Y. S. Lee et al., Phys. Rev. B 66, 041104(R) (2002).