Also at ]Lyman Lab. of Physics, Harvard University, Cambridge, MA 02138
Crossover behaviors in liquid region of vortex states
above a critical point caused by point defects
Abstract
Vortex states in high- superconductors with point defects are studied by large-scale Monte Carlo simulations of the three-dimensional frustrated XY model. A critical point is observed on the first-order phase boundary between the vortex slush and vortex liquid phases. A step-like anomaly of the specific heat is detected in simulations of finite systems, similar to an experimental observation [F. Bouquet et al., Nature (London) 411, 448 (2001)]. However, it diminishes with increasing system size, and the number and size distribution of thermally-excited vortex loops show continuous behaviors around this anomaly. Therefore, the present study suggests a crossover rather than a thermodynamic phase transition above the critical point.
pacs:
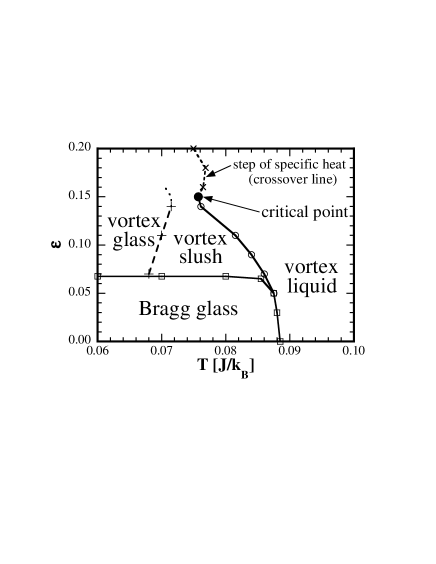
74.25.Qt, 74.62.Dh, 74.25.DwIntensive studies on vortex states of high- superconductors have revealed complex structures of the phase diagram in the magnetic field along the axis. Point defects such as oxygen deficiencies are essential for such complexity. The Bragg glass (BrG) Nattermann ; Giamarchi phase is stable at low temperatures and low magnetic fields. This phase melts into the vortex liquid (VL) or vortex glass (VG) Fisher phases as temperature or magnetic field increases, respectively. The BrG phase has a closed first-order boundary in the - phase diagram. Ertas ; Giamarchi2 The vortex slush (VS) Worthington phase locates between the VG and VL phases, and another first-order boundary between the VS and VL phases terminates at a critical point. Worthington ; Kierfeld
The BrG-VL, Safar92 ; Kwok94 ; Zeldov95 ; Welp96 ; Schilling96 BrG-VG Cubitt93 ; Safar95 ; Khaykovich97 ; Nishizaki98 and VS-VL Nishizaki00 ; Wen01 phase boundaries have been observed experimentally. Similar phase diagrams have been obtained by numerical simulations including point defects, Gingras ; Ryu ; Otterlo ; Sugano ; Nonomura though the stability of the VG phase is still controversial. Olsson ; Vestergren
Recently Bouquet et al. Bouquet observed a -function peak and a sharp step of the specific heat below and above a critical point, respectively. They argued that this step-like anomaly corresponds to a second-order phase transition related to a vortex-loop blowout. Tesanovic ; Nguyen
In the present article, we investigate the phase diagram in the vicinity of the critical point of the VS-VL phase boundary. As displayed in Fig. 1, we find that the critical point is located at , which is just above the maximum value of in our previous work. Nonomura A step-like anomaly of the specific heat is observed above the critical point in finite systems. However, the size dependence of this anomaly reveals that this step does not indicate a thermodynamic phase transition but a crossover.
In the present study we use the same model as investigated in our previous article on vortex states with point defects, Nonomura namely the three-dimensional anisotropic, frustrated XY model on a simple cubic lattice, Li ; Hu
| (1) | |||||
| (2) |
with the periodic boundary condition in all directions. A uniform magnetic field is applied along the axis, and the averaged number of flux lines per plaquette is . A point defect is introduced as the plaquette surrounded by four weaker couplings and distributed randomly in the plane with probability . Couplings are () on the point defects, and elsewhere. As in our previous article, we fix the parameters , and , and vary the strength of point defects and temperature . Configurations of defects are also the same as in our previous work. Monte Carlo simulations are started from a very high temperature, and systems are gradually cooled down. Typical Monte Carlo steps are for equilibration, and for measurement.
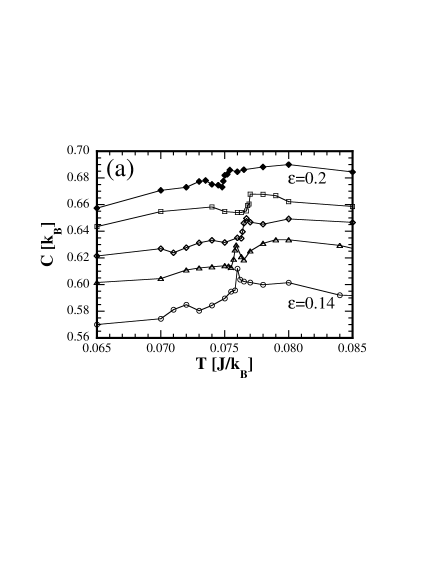
First, we concentrate on the system with and . Temperature dependence of the specific heat for is displayed in Fig. 2(a). At , has a -function peak at . This peak becomes very small at , and is replaced by a step for . This result suggests that the critical point locates at . The phase diagram obtained from this finite system is summarized in Fig. 1.
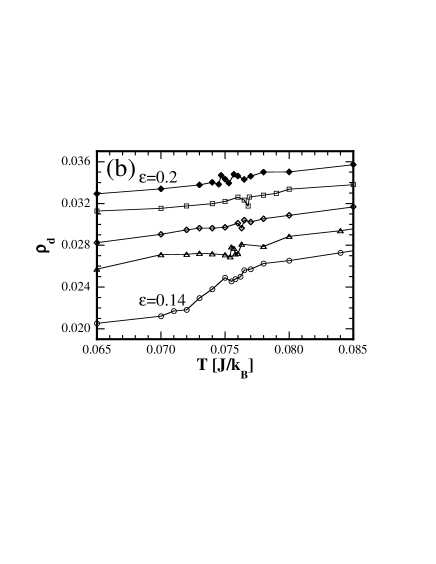
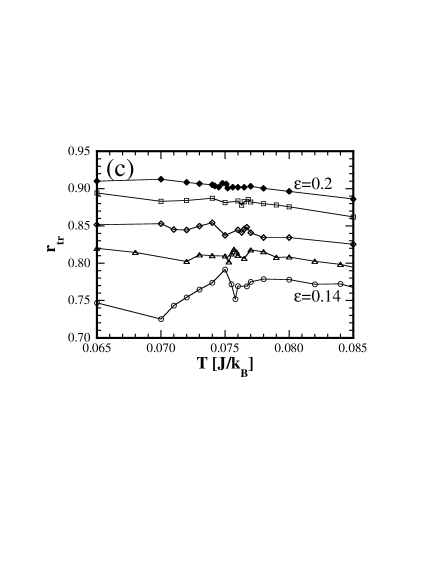
Consistent behaviors are seen in other quantities. Temperature dependence of the density of dislocations in the plane and the ratio of point defects which trap flux lines are given in Figs. 2(b) and 2(c), respectively. The quantity characterizes Kierfeld ; Nonomura the VS-VL phase transition. At , jumps between and , where sharply increases. This jump becomes much smaller at and invisible for . Keeping possible statistical errors in mind, a tiny hump and dip seem to exist at the temperature region where the specific heat has a step-like anomaly for , but the hump and dip are one order smaller than the jump of related to the VS-VL phase transition, and therefore considered to be finite-size effects.
At , the quantity gradually increases from as approaching the transition temperature , because the short-range order of flux lines in the VS phase becomes fragile as temperature increases. Then, it rapidly decreases just below , because the mobility of flux lines becomes larger in the coexisting region of the first-order phase transition. This anomaly becomes obscure at and disappears for . Although a tiny hump and dip also seem to exist at for , they have an opposite behavior to the cusp at ; increases at and drops just above , and therefore have a different origin from the cusp related to the VS-VL phase transition.
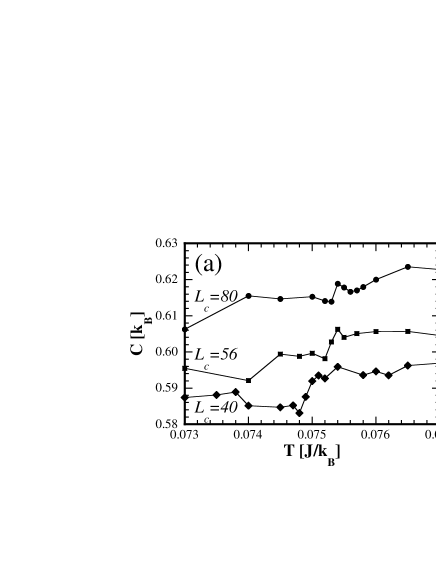
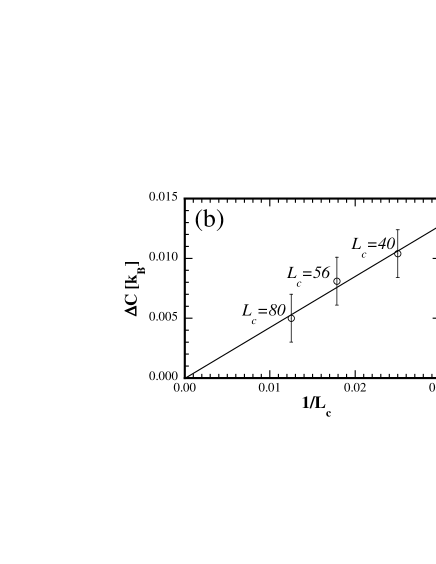
Next, in order to explore whether this step-like anomaly of the specific heat is a thermodynamic phase transition or not, its size dependence is investigated. Since flux lines in are one-dimensional objects along the axis, physical quantities mainly depend on . Nonomura2 Even in the vortex liquid region in pure systems, the displacement of flux lines along the plane is smaller than the random-walk value due to the blocking by other flux lines. In the present case, this displacement would be even smaller due to the pinning by defects. We thus fix and change . Temperature dependence of the specific heat for , and at is displayed in Fig. 3(a). As increases, the height of the step of the specific heat becomes smaller. Since it is clearly proportional to (Fig. 3(b)), this step is expected to vanish in the thermodynamic limit. The anomaly of the specific heat above the critical point of the VS-VL phase boundary is therefore a crossover rather than a thermodynamic phase transition.
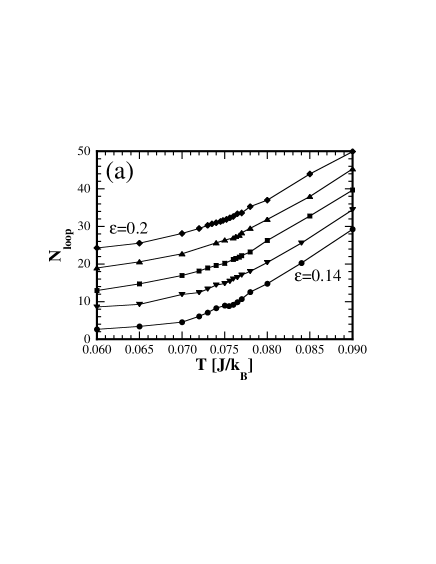

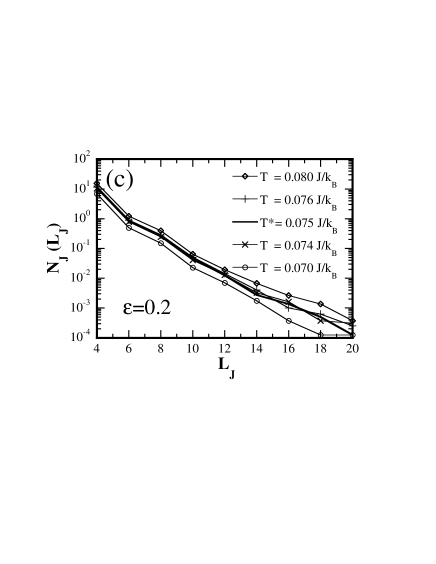
Finally, the number and size distribution of thermally-excited vortex loops are investigated in order to check whether this anomaly of the specific heat is related to the vortex-loop blowout Tesanovic ; Nguyen or not. Temperature dependence of the number of vortex loops for is displayed in Fig. 4(a). There exist no vortex loops including pancake vortices at these parameter regions. Size distributions of Josephson loops for and are shown in Figs. 4(b) and 4(c), respectively. Note
Although the number of vortex loops monotonically increases as temperature increases, no symptom of the vortex-loop blowout is seen around or for each . This is also the case for the size distribution of Josephson loops. In Figs. 4(b) and 4(c), the number of Josephson loops with a given perimeter is plotted versus in a semi-log scale, and the exponential size distribution of is clearly observed. There exists no qualitative difference in the behaviors below and above the critical point, and the size distribution changes continuously as temperature is varied around or .
The vortex-loop blowout is characterized by the abrupt increase of the number of vortex loops and the change of the size distribution from an exponential decay to a power-law one at the transition temperature, and the proliferation of vortex loops as large as the system size above the transition temperature. Tesanovic ; Nguyen None of these behaviors are observed around in the present simulations, which casts serious doubt on the argument that the step of the specific heat is related to the vortex-loop blowout. Bouquet In this argument, the vortex-loop blowout scenario was borrowed in order to explain the observation that the value of the specific heat above the step-like anomaly is larger than that below the anomaly . However, this property is quite general in vortex states, and actually occurs even at the melting transition in pure systems. Hu In vortex states, the density of vortices increases as temperature increases owing to excitation of vortex loops and wandering of flux lines, and consequently the relation holds. The vortex-loop blowout is merely a special case of this general property.
It remains unsolved why a step of the specific heat is clearly observed in experiments even though the sample size is much larger than the system size in our simulations. Several possibilities are: (a) The height of the step of might saturate at larger , and our maximum system size would be still small. (b) Our model (1) might be still too simple to describe the step of , e.g. the inhomogeneity of the strength of point defects is not taken into account. (c) The step of observed experimentally might be a non-equilibrium effect.
In summary, vortex states of high- superconductors with point defects in has been investigated by large-scale Monte Carlo simulations. The critical point of the first-order phase boundary between the vortex slush and vortex liquid phases is identified as the vanishing point of the -function peak of the specific heat. The shape of the step-like anomaly of the specific heat above the critical point is similar to that of the experiment by Bouquet et al. As the system size along the axis increases, the height of this step seems proportional to , which suggests that this anomaly is a crossover rather than a thermodynamic phase transition. Consistent behaviors are observed in the temperature dependence of the density of dislocations in the plane and the ratio of point defects which trap flux lines. There is no discontinuity in the number and size distribution of vortex loops around the step-like anomaly of the specific heat, which clearly indicates that this anomaly is not related to the vortex-loop blowout.
Numerical calculations were performed on Numerical Materials Simulator (NEC SX-5) at Computational Materials Science Center, National Institute for Materials Science, Japan. Y. N. was supported by the Atomic Energy Research Fund from Ministry of Education, Culture, Sports, Science and Technology, Japan. This study is partially supported by the Priority Grant No. 14038240 from the same Ministry.
References
- (1) T. Nattermann, Phys. Rev. Lett. 64, 2454 (1990).
- (2) T. Giamarchi and P. Le Doussal, Phys. Rev. Lett. 72, 1530 (1994); Phys. Rev. B 52, 1242 (1995).
- (3) M. P. A. Fisher, Phys. Rev. Lett. 62, 1415 (1989); D. S. Fisher, M. P. A. Fisher, and D. A. Huse, Phys. Rev. B 43, 130 (1991).
- (4) D. Ertaş and D. R. Nelson, Physica (Amsterdam) 272C, 79 (1996).
- (5) T. Giamarchi and P. Le Doussal, Phys. Rev. B 55, 6577 (1997).
- (6) T. K. Worthington et al., Phys. Rev. B 46, 11854 (1992).
- (7) J. Kierfeld and V. Vinokur, Phys. Rev. B 61, R14928 (2000).
- (8) H. Safar et al., Phys. Rev. Lett. 69, 824 (1992).
- (9) W. K. Kwok et al., Phys. Rev. Lett. 72, 1092 (1994).
- (10) E. Zeldov et al., Nature (London) 375, 373 (1995).
- (11) U. Welp et al., Phys. Rev. Lett. 76, 4809 (1996).
- (12) A. Schilling et al., Nature (London) 382, 791 (1996).
- (13) R. Cubitt et al., Nature (London) 365, 407 (1993).
- (14) H. Safar et al., Phys. Rev. B 52, 6211 (1995).
- (15) B. Khaykovich et al., Phys. Rev. B 56, R517 (1997).
- (16) T. Nishizaki et al., Phys. Rev. B 58, 11 169 (1998).
- (17) T. Nishizaki, K. Shibata, and N. Kobayashi, Physica (Amsterdam) 341C-348C, 957 (2000); K. Shibata et al., Phys. Rev. B 66, 214518 (2002).
- (18) H. H. Wen et al., Phys. Rev. B 64, 054507 (2001).
- (19) M. J. P. Gingras and D. A. Huse, Phys. Rev. B 53, 15193 (1996).
- (20) S. Ryu et al., Phys. Rev. Lett. 77, 2300 (1996).
- (21) A. van Otterlo, R. T. Scalettar, and G. T. Zimányi, Phys. Rev. Lett. 81, 1497 (1998).
- (22) R. Sugano et al., Physica (Amsterdam) 284B-288B, 803 (2000), 341C-348C, 1113 (2000).
- (23) Y. Nonomura and X. Hu, Phys. Rev. Lett. 86, 5140 (2001).
- (24) P. Olsson and S. Teitel, Phys. Rev. Lett. 87, 137001 (2001).
- (25) A. Vestergren, J. Lidmar, and M. Wallin, Phys. Rev. Lett. 88, 117004 (2002).
- (26) F. Bouquet et al., Nature (London) 411, 448 (2001).
- (27) Z. Tešanović, Phys. Rev. B 51, 16204 (1995), 59, 6449 (1999).
- (28) A. K. Nguyen and A. Sudbø, Europhys. Lett. 46, 780 (1999); Phys. Rev. B 60, 15307 (1999).
- (29) Y.-H. Li and S. Teitel, Phys. Rev. Lett. 66, 3301 (1991); Phys. Rev. B 47, 359 (1993).
- (30) X. Hu, S. Miyashita, and M. Tachiki, Phys. Rev. Lett. 79, 3498 (1997); Phys. Rev. B 58, 3438 (1998).
- (31) Y. Nonomura, X. Hu, and M. Tachiki, Phys. Rev. B 59, R11657 (1999).
- (32) The effect of intersections of vortex loops is negligible in the present parameter regions, because the averaged number of vortex loops in each plane is less than unity, in contrast to the case of Ref. Olsson2 .
- (33) P. Olsson, Europhys. Lett. 58, 705 (2002).