Mixing and condensation in a wet granular medium
Abstract
We have studied the effect of small amounts of added liquid on the dynamic behavior of a granular system consisting of a mixture of glass beads of two different sizes. Segregation of the large beads to the top of the sample is found to depend in a nontrivial way on the liquid content. A transition to viscoplastic behavior occurs at a critical liquid content, which depends upon the bead size. We show that this transition can be interpreted as a condensation due to the hysteretic liquid bridge forces connecting the beads, and provide the corresponding phase diagram.
pacs:
05.65.+b,45.70.-n,45.70.MgAs is generally known from everyday experience, the mechanical properties of a granular material change dramatically if some liquid is added. The main reason is the internal cohesion due to capillary forces arising from liquid bridges between the grains Mikami et al. (1998); Israelachvili (1991); Hornbaker et al. (1997); Halsey and Levine (1998); Bocquet et al. (1998); Fraysse et al. (1999). While recent years have seen considerable progress in understanding the dynamics of dry granular materials Ristow (2000); Jaeger et al. (1996); Kadanoff (1999), the physical mechanisms underlying the properties of wet systems remain largely obscure. This is in part due to the inherent complexity of these highly nonlinear systems, but also to the fact that only few experiments have yet been conducted on this topic.
Some experiments have been recently done on the influence of liquid on the mixing behavior of systems consisting of large and small spheres Samadani and Kudrolli (2000, 2001). It was observed that as liquid was added, the tendency to segregate, which is well known for dry granulates Ottino and Khakhar (2000); Trujillo and Herrmann (February 26, 2002), was diminished. At a certain wetness, complete mixing occurred. In these experiments the morphology of heaps formed by pouring mixtures of particles with two different sizes through an orifice was investigated. In order to have a closer look at the observed effects, we have carried out experiments in which the agitation of the material is provided in a more homogeneous way, thus ensuring a more or less well defined granular temperature. Furthermore, the propensity of the system to segregate into large and small beads can be determined quantitatively in our setup. We observe a strong dependence of mixing on the liquid content, and the transition to a viscoplastic regime due to condensation of the grains into clusters, which was reported in ref.Samadani and Kudrolli (2001), was clearly observed. However, the overall behavior was found to be more complicated than previously reported, and we are able to explain all of the observed features within a rather simple theoretical model.
A typical sample consisted of of glass beads with radius, sealed in a cylindrical jar (diameter: mm, cf. fig. 1) together with the same volume of smaller glass beads with radius , which was varied from to , and a well defined amount of liquid. In order to prevent crystallization, the small beads were chosen to be slightly polydisperse: the spread in bead size ranged from 10 to 20 . The jars were mounted on a shaker, with the cylinder axis upright. The shaking motion consisted of small horizontal circles with a diameter of mm and a frequency of revolutions per second, which corresponds to a velocity of the container walls of 0.38 m/s. When the segregation pattern did not change any more (typically after one half hour), photographs of the jars were taken and analyzed. Two examples are shown in Figure 1.
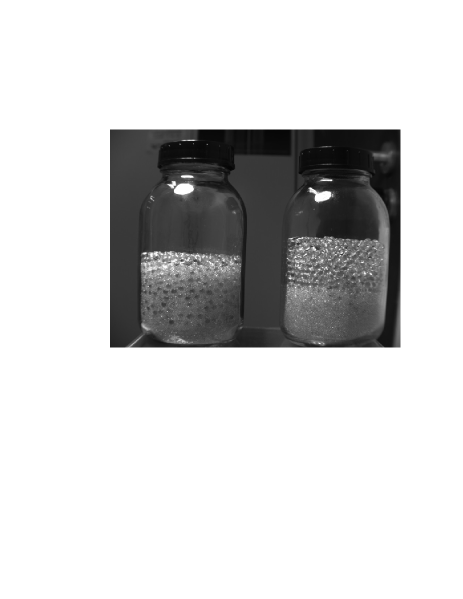
We defined the mixture zone as the zone in which both the smaller and the bigger particles were visibly present. This zone was observed to be rather homogeneous concerning the mixing ratio. Occasional analysis of horizontal slices of the samples revealed a small radial variation of the mixing ratio, which is not captured by the photographs, but the results given below are qualitatively valid for the whole volume. For the results presented here we used water as the liquid, but similar results were obtained using ethanol. We can therefore exclude that leaching of ions from the glass, and other side effects due to the specific properties of water, play a significant role Olivi-Tran et al. (2002). The quantity we will discuss is the height of the mixture zone, divided by the total height of the sample, and is denoted by . For perfect segregation, , while for perfect mixing. The amount of liquid added to the samples is denoted by the dimensionless quantity , which is defined as the volume of the liquid divided by the total volume of the small beads (including the space between the beads).
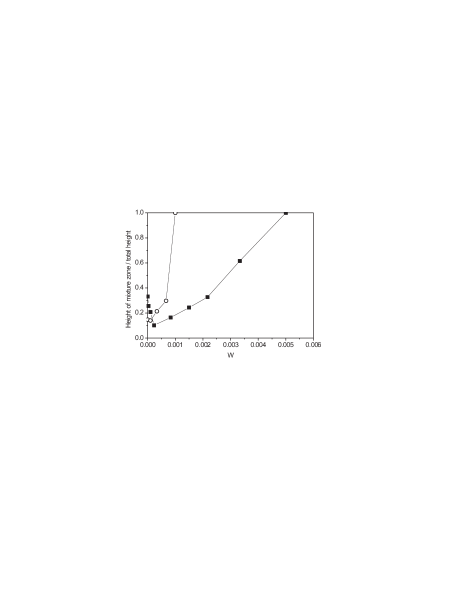
In contrast to what one might anticipate on the basis of earlier work Samadani and Kudrolli (2000, 2001), the propensity of mixing of the particles did not improve monotonically with the amount of liquid added. Instead, we found in most cases that the height of the mixture zone, , was first reduced upon addition of water. Only after a certain amount of liquid had been added did the mixing improve. In Fig. 2, is plotted as a function of for two different . The size of the large beads was kept constant. Clearly, there is a rather well defined liquid content above which the height of the mixing zone increases when more liquid is added.
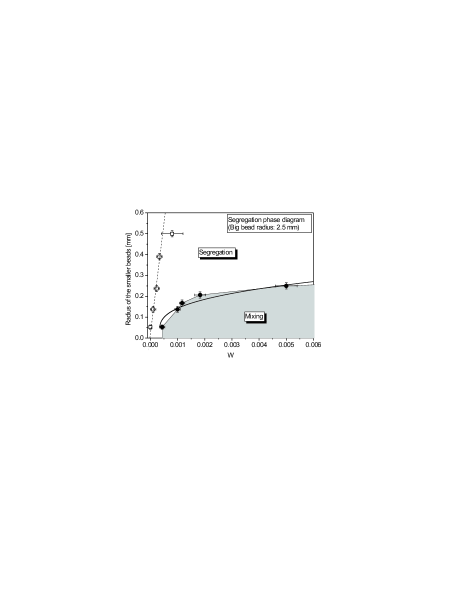
The boundary between these two regimes (i.e., the minima of the curves as in fig. 2) is indicated by the open squares in Figure 3, which represents a phase diagram of the system in the plane spanned by the radius of the small beads, , and the liquid content, . The dotted line serves as a guide to the eye. The full circles correspond to the occurrence of complete mixing (i.e., ). We can thus clearly distinguish three regimes, which we denote as gaseous, intermediate, and viscoplastic Tegzes et al. (1999, 2002), respectively. In what follows, we will discuss these regimes in some detail.
Let us start with the transition to the viscoplastic regime, in which perfect mixing is observed. This transition, which occurs as , appears quite abrupt when inspecting the experiment by eye. While the general motion of the whole sample was a kind of circular convection around the axis of the jar in the gaseous and intermediate regimes, the motion in the case of perfect mixing was reminiscent of kneading raisin dough. We identify this transition with the one reported recently by other authors Samadani and Kudrolli (2000, 2001). We assume that this transition into the viscoplastic regime occurs when the granular temperature of the system, i.e., the average kinetic energy per bead, is not anymore sufficient to break the liquid bridges between the beads, and is thus a kind of condensation within the granular gas, mediated by the liquid bridges.
In order to support this view, we have to discuss the involved forces in some detail. The force exerted upon two adjacent beads by the liquid bridge can be written as , where is the surface tension of the liquid, is the radius of the spheres, is the liquid volume of the bridge, and is some function depending on the roughness of the sphere surfaces Halsey and Levine (1998); Willett et al. (2000). describes the dependence of the force on the mutual distance, , of two ideally spherical beads. The energy required to destroy the bridge is given by
| (1) |
where is the distance at which the bridge pinches off. The integral can be well approximated as Willett et al. (2000).
For perfect spheres and complete wetting, , but for a rough surface, it tends to zero as . The shape of has been discussed in detail before Halsey and Levine (1998). Based on these considerations, it can be well approximated by
| (2) |
with characterizing the roughness amplitude, . For the exponent, we have , where is the roughness exponent of the bead surface. For (typical) scratch and dig roughness, is close to zero, and . This corresponds to the regime found by Hornbaker et al. Hornbaker et al. (1997). In the opposite case, when , we have . We see that is confined to a narrow interval, and is very probably close to one in our system.
We now must calculate the average bridge volume, , from the dimensionless liquid volume, . At equilibrium, assuming that all of the liquid is in the bridges, , where is the coordination number of the network of bridges () and is the packing density of the spheres (). Under dynamic conditions the typical bridge volume would be expected to be somewhat smaller than the equilibrium value. Our measurements 111M. M. Kohonen, D. Geromichalos, and S. Herminghaus; manuscript in preparation suggest that , where . If we now equate the bridge energy, , to the average kinetic energy of the small beads, , we obtain the implicit equation
| (3) |
where we have introduced the characteristic length scale ( is the mass density of the bead material. In our case, ). Eq. (3) can be easily solved analytically for and . For the most relevant case of , we obtain
| (4) |
which intersects the W-axis at the critical moisture content , which only depends on the roughness amplitude, , but not on . This function represents the phase boundary at which condensation sets in, and is indicated as the full curve in Figure 3. From this best-fit curve we obtain , which is similar to the peak-to-peak roughness obtained from the inspection of the beads by atomic force microscopy. From the fitted value of the intrinsic length scale , and from the known density of the glass and the surface tension of the water, we get the average granular velocity, . This compares favorably with the velocity of the shaking motion, which is expected to be of the same order of magnitude.
Let us now turn to the gaseous regime. If there is no liquid in the sample at all, segregation is observed as usual, which has become known as the ’brazil nut effect’ (BNE) Williams (1976); Rosato et al. (1987); Knight et al. (1993); Mbius et al. (2001). As it has been shown recently Trujillo and Herrmann (February 26, 2002), this may be understood in a continuum picture, as follows. A granular medium is strongly dissipative due to the inelastic character of the impact kinetics of the grains, which is characterized by the restitution coefficient, . The latter is defined as the ratio of the particle velocities after and before impact, . Thereby the granular temperature bath, which typically corresponds to thermal temperatures in the Terakelvin range, is internally coupled to the room-temperature bath provided by the atoms constituting the grains. This inherent state of non-equilibrium is the basic reason for the peculiar features of granular matter dynamics in general.
Now consider a spherical region with radius within the granular gas. When a grain, or small bead, enters this region, it will have many impacts, and thereby lose a lot of energy, before it can leave this region again. When the latter is replaced by a solid sphere (i.e., a large bead of radius ), the grain will experience only one such impact. Consequently, the granular gas is hotter close to an intruder than far away in the bulk, because the intruder is a less effective heat sink. The granular gas is therefore also less dense around the intruder, and the latter rises due to the buoyancy of the ’bubble’ of reduced density it carries around itself Trujillo and Herrmann (February 26, 2002).
The height of the mixing zone is then a direct consequence of the balance between the hydrostatic pressure exerted by the large-beads fraction upon its lower interface, and the buoyancy pressure exerted upon the same interface from below by the mixed phase. This picture is supported by the observation that the large beads acquire a rather uniform spacing within the mixed phase, which might then correspond to (twice) the thickness of the reduced density layer around each large bead Trujillo and Herrmann (February 26, 2002).
The BNE increases as the energy loss upon impact is increased. This, however, is just what is achieved when liquid is added. The interparticle force exerted by the liquid has a hysteretic character Willett et al. (2000); Crassous et al. (1994); Zitzler et al. (2002), 222M. Schulz, B. M. Schulz, S. Herminghaus, Shear-induced solid-fluid transition in a wet granular medium, submitted to Phys. Rev. E and is thus intrinsically dissipative. We thus expect the restitution coefficient to be reduced, and the BNE to become more prominent, when liquid is added. More precisely, the buoyancy of the reduced density bubbles around the large beads increases, and a shallower mixing zone is needed to balance the hydrostatic pressure of the large-beads column above it. Thus the height of the mixing zone is expected to decrease when liquid is added, which is what we observe. We thus assume that throughout this regime, which is defined by a monotonically decreasing height of the mixing zone, the physics of two-particle impact is affected by the liquid merely in the sense of a decrease in the restitution coefficient, .
Although a quantitative prediction of the BNE is yet difficult, we can give a rough estimate of the expected size of the effect. The inelastic character of the impact of the dry particles reflects itself in the BNE (and thus the tendency of demixing) of the dry material. Consequently, we expect the contribution due to the liquid to be of the same order of magnitude when the energy stored in the liquid bridges is similar to the energy lost upon impact, i.e., when . Since , the corresponding moisture content, , is related to via . Exploiting that roughly corresponds to the open symbols in Fig. 3, we can estimate the restitution coefficient of our system. We obtain , which compares favorably with values known from the literature Ristow (2000).
Intermediate regime: As more liquid is added, the width of the hysteresis loop becomes larger, such that the kinetic energy of the impact may sometimes not be sufficient to break a bridge. It thus appears likely that small clusters will form which have a certain lifetime. Since these are heavier than the single beads, their velocity after an impact is less affected by the liquid bridges. Furthermore, the interior of a (larger) cluster may act as a sink for the liquid due to capillarity, resulting in a somewhat reduced wetness of the beads outside the cluster. Hence the ’effective’ restitution coefficient, averaged over all entities in the system, increases again. As a consequence, the BNE is now reduced, and the phases become better miscible, as we observe.
This model is in accordance with the observation that the overall appearance of the material is not expected to change noticeably in this regime: as more liquid is added, the average cluster size is just increased. The clusters take up the excess liquid, due to the increased average coordination number of the bridge network within a cluster. In other words, excess liquid is stored in liquid bridges within clusters, which are not active in the dissipation process.
We thus have elucidated the interplay between segregation (BNE) and a phase transition to viscoplasticity, and have given a robust criterion for the latter. The phase boundary can be understood from simple energy considerations.
Inspiring discussions with H. Herrmann, S. Luding, and S. Linz are gratefully acknowledged. The authors thank the German Science Foundation for financial support within the Priority Program ‘Wetting and Structure Formation at Interfaces’. MMK acknowledges the Alexander von Humboldt Foundation for generous funding.
References
- Mikami et al. (1998) T. Mikami, H. Kamiya, and M. Horio, Chem. Eng. Sci. 53, 1927 (1998).
- Israelachvili (1991) J. N. Israelachvili, Intermolecular and Surface Forces (Academic, London, GB, 1991), 2nd ed.
- Hornbaker et al. (1997) D. J. Hornbaker, R. Albert, I. Albert, A.-L. Barabasi, and P. Schiffer, Nature 387, 765 (1997).
- Halsey and Levine (1998) T. C. Halsey and A. J. Levine, Phys. Rev. Lett. 80, 3141 (1998).
- Bocquet et al. (1998) L. Bocquet, E. Charlaix, S. Ciliberto, and J. Crassous, Nature 396, 735 (1998).
- Fraysse et al. (1999) N. Fraysse, H. Thom, and L. Petit, Eur. Phys. J. B 11, 615 (1999).
- Ristow (2000) G. H. Ristow, Pattern Formation in Granular Materials (Springer, Berlin, Germany, 2000).
- Jaeger et al. (1996) H. M. Jaeger, S. R. Nagel, and R. P. Behringer, Rev. Mod. Phys. 68, 1259 (1996).
- Kadanoff (1999) L. P. Kadanoff, Rev. Mod. Phys. 71, 435 (1999).
- Samadani and Kudrolli (2000) A. Samadani and A. Kudrolli, Phys. Rev. Lett. 85, 5102 (2000).
- Samadani and Kudrolli (2001) A. Samadani and A. Kudrolli, Phys. Rev. E 64, 051301 (2001).
- Ottino and Khakhar (2000) J. M. Ottino and D. V. Khakhar, Annu. Rev. Fluid Mech. 32, 55 (2000).
- Trujillo and Herrmann (February 26, 2002) L. Trujillo and H. J. Herrmann, arXiv:cond-mat/0202484 (February 26, 2002).
- Olivi-Tran et al. (2002) N. Olivi-Tran, N. Fraysse, P. Girard, M. Ramonda, and D. Chatain, Eur. Phys. J. B 23, 217 (2002).
- Tegzes et al. (1999) P. Tegzes, R. Albert, M. Paskvan, A.-L. Barabasi, T. Vicsek, and P. Schiffer, Phys. Rev. E 60, 5823 (1999).
- Tegzes et al. (2002) P. Tegzes, T. Vicsek, and P. Schiffer, Phys. Rev. E 89, 094301 (2002).
- Willett et al. (2000) C. D. Willett, M. J. Adams, S. A. Johnson, and J. P. K. Seville, Langmuir 16, 9396 (2000).
- Williams (1976) J. C. Williams, Powder Technol. 15, 245 (1976).
- Rosato et al. (1987) A. Rosato, K. J. Strandburg, F. Prinz, and R. H. Swendsen, Phys. Rev. Lett. 58, 1038 (1987).
- Knight et al. (1993) J. B. Knight, H. M. Jaeger, and S. R. Nagel, Phys. Rev. Lett. 70, 3728 (1993).
- Mbius et al. (2001) M. E. Mbius, B. E. Lauderdale, S. R. Nagel, and H. M. Jaeger, Nature 414, 270 (2001).
- Crassous et al. (1994) J. Crassous, E. Charlaix, and J.-L. Loubet, Europhys. Lett. 28, 37 (1994).
- Zitzler et al. (2002) L. Zitzler, S. Herminghaus, and F. Mugele, Phys. Rev. B 66, 155436 (2002).