Slow dynamics and aging of a confined granular flow
Abstract
We present experimental results on slow flow properties of a granular assembly confined in a vertical column and driven upwards at a constant velocity V. For monodisperse assemblies this study evidences at low velocities () a stiffening behaviour i.e. the stress necessary to obtain a steady sate velocity increases roughly logarithmically with velocity. On the other hand, at very low driving velocity (), we evidence a discontinuous and hysteretic transition to a stick-slip regime characterized by a strong divergence of the maximal blockage force when the velocity goes to zero. We show that all this phenomenology is strongly influenced by surrounding humidity. We also present a tentative to establish a link between the granular rheology and the solid friction forces between the wall and the grains. We base our discussions on a simple theoretical model and independent grain/wall tribology measurements. We also use finite elements numerical simulations to confront experimental results to isotropic elasticity. A second system made of polydisperse assemblies of glass beads is investigated. We emphasize the onset of a new dynamical behavior, i.e. the large distribution of blockage forces evidenced in the stick-slip regime.
pacs:
45.70.-n,46.55.+d,81.05.-RmI Introduction
Granular flows are presently at the focus of many attentions PDM . The classical model for granular media stability was proposed at the end of the XVIIIth century by Ch. A. de Coulomb who revealed a strong analogy between the failure properties of a granular assembly and the phenomenology of solid on solid friction. Modern developments have elaborated sophisticated empirical approaches around this fundamental idea Wood but so far there is no deep physical understanding nor rigorous derivation describing the passage from the granular level description to a set of evolution equations involving macroscopic quantities such as stress, strain or packing fraction. Furthermore, there is an additional difficulty to apprehend complex behaviors such as aging under stress or to account for the influence of external parameters such as surrounding humidity which effects are often noticed in practice. Note that similar questions are still under active consideration in the field of tribology Berthoud99 ; Crassous99 ; Riedo02 , but in the case of granular assemblies, a supplementary difficulty lies in the fragile character of granular structures which can be easily modified under the action of external constraints.
Dynamical behavior of slowly driven granular materials was investigated by different groups both in compression and/or in shearing experiments Gollub97 ; Horwarth96 ; Albert99 ; Lubert . Here we present an experimental situation of the same type, but in a quite different geometry. We investigate the rheology of a granular assembly confined in a cylindrical column and pushed vertically from the bottom. The resistance to vertical motion as well as the blocking/unblocking transitions reveals a phenomenology possibly shared by many confined granular assemblies. Note that this column configuration may help to understand several practical situations like pipe flows Hulin , compaction under stress or dense granular paste extrusion. A previous investigation of the same display was made in 2D LaKolb99 and also in 3D Ovarlez01 as a preliminary report, and more recently see refs Bertho03 ; Landry . Those contributions have shown a rich phenomenology partly sorted by the solid friction properties of the grains and the boundaries. The importance of surrounding humidity was also evidenced Ovarlez01 as it would strongly influence the rheology of the granular column. In this report, we push further the investigation as we change the column material, the beads characteristics and size dispersity, under various humidity conditions. We also propose to compare our data with the outcome of a simple numerical model of isotropic elasticity.
In the classical situation of newtonian fluid pushed by a piston (typically in a syringe), one would obtain a relation between pressure and flow rate, which is characterized by a fluid constitutive parameter: the viscosity. For an isotropic elastic medium the resistance to pushing would depend on the material Poisson’s ratio and wall frictional properties Ovarlez03 ; OvarlezSimuls (we will detail this question further in the text). For a granular material, the situation is a priori more complex since the piling structure can be modified so as to adapt to the external constraints. Friction at the walls may also create internal granular recirculation flows LaKolb99 . Therefore it is an important but difficult matter to clarify the rheology of this system by sorting the respective influence of grain-boundary friction versus bulk structural changes. Along this line we started with a simple situation of weakly frictional steel beads with frictional boundaries. A second situation is studied where the granular material is made of rugous polydisperse glass beads.
II Display
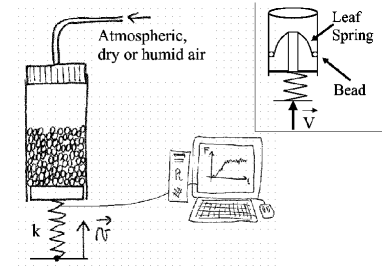
Most experiments are performed on dry, non cohesive and monodisperse steel beads of diameter mm piled into a vertical duralumin or brass cylinder of diameter mm. We also perform a series of experiments on a miscellany of glass beads of three diameters (1.5 mm, 2 mm and 3 mm) with equal volume of each kind, in a PMMA cylinder. The column is closed at the bottom by a movable brass piston avoiding contact with the column (diameter mismatch is mm). A force probe of stiffness is located under the piston and is pushed at a constant driving velocity (between and ) via a stepping motor (see Fig. 1). The resistance force encountered by the piston is measured as a function of time. We also monitor the relative humidity () and the surrounding temperature. We work in the range , as well as in dry air () and humid air (). Actually, except for the dry and humid situation, we do not regulate this last parameter () but we record its values close to the experimental set-up. We obtain dry air by having a weak air flux () flow into a cylinder filled with silica. We obtain humid air by making a weak air flux () bubble through water. Then, for the duration of an experiment, weak fluxes of humid or dry air are set to flow through the column from top to bottom, maintaining a constant and homogeneous level of humidity. Note that a stationary relative humidity is reached in a few minutes. We start our experiments when this stationary level is attained. We verified that the weak air flux does not perturb the system: we notice no evolution of the force when the flux is stopped as long as relative humidity remains unchanged. Temperature is kept at ˚C. We actually find no correlation between the force fluctuations and the temperature variations in this range.
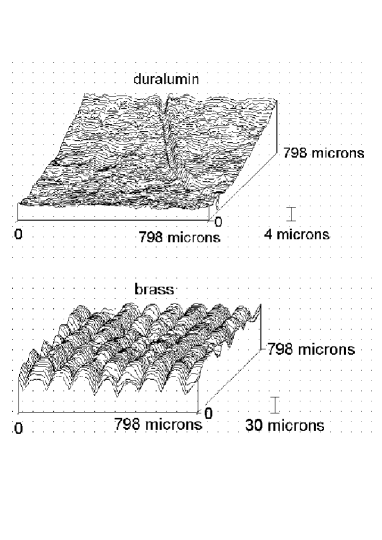
Note that the brass and duralumin cylinders have very different surface properties (Fig. 2). The duralumin cylinder is rough cast, and its roughness is nm. The brass cylinder was machine-turned, and has mean roughness m with undulations of wavelength m and depth m.
In order to compare precisely rheological properties of granular assemblies to solid friction properties, we built a special device (called ”the slider”, see Fig. 1 inset) designed to study the tribology of bead/wall contact. This device is set to apply a constant normal load ( ) on three steel beads sliding vertically on the cylinder’s wall. Then, the dynamical evolution of the resistance force encountered by the piston pushing a granular material can be compared to the slider’s friction resistance driven in the same conditions.
Two granular systems will be studied. First a model assembly of monodisperse steel spheres and second a polydisperse assembly of rough glass beads. The largest part of this report is devoted to the monodisperse assembly.
III Monodisperse steel beads
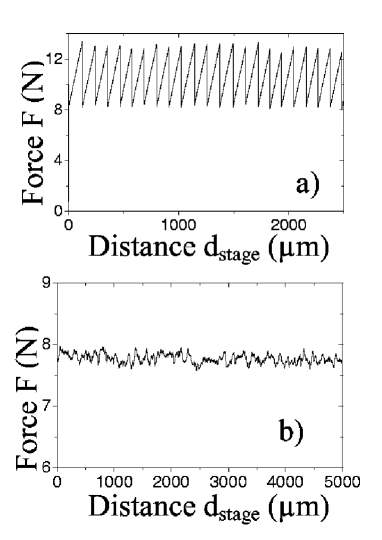
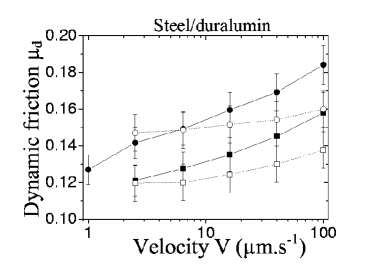
We now report on the simplest situation i.e. monodisperse low frictional steel beads in a duralumin or brass cylinder. We observe two distinct dynamical stationary regimes (Fig. 3): for high driving velocities, the motion is characterized by a steady-sliding and a constant pushing force; for low velocities, the system undergoes a dynamic instability characterized by a stick-slip motion.
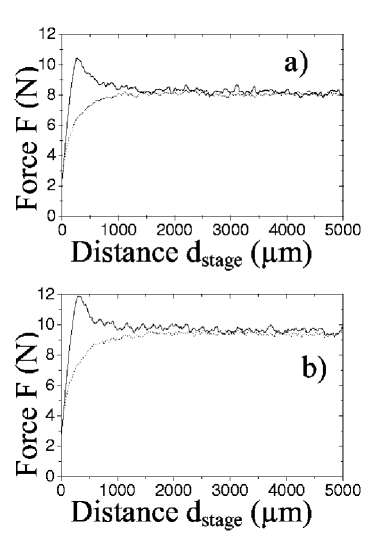
We first notice that as far as averaged packing fraction and pushing force are concerned, whatever the initial state of preparation is, the same stationary regime is reached (Fig. 4). When a dense packing () is prepared by rain-filling, the force in the steady sliding regime increases up to a maximum, then decreases slowly for a piston displacement of about 3 mm. At this point where a stationary value of the force is attained, the average packing fraction is . In the case of an initially loose packing () prepared by using an inner cylinder slowly removed after filling, the force in the steady sliding regime increases monotonically for a 3 mm displacement before the same stationary value of force is reached. This state is also characterized by a packing fraction. For all preparations, we always get a stationary regime characterized by the same pushing force , which depends on driving velocity , relative humidity and packing’s height , as well as the same packing fraction (), independent of , and . The stick-slip regime displays a similar phenomenology: the piling reaches a stationary packing fraction of ; in the transitory regime, the pushing force for dense packing displays a maximum and for a loose packing shows a monotonous increase. In section III.1.1 we propose an explanation for the phenomenology of the transitory regimes.
In the following, we present the phenomenology observed in the steady-sliding and the stick-slip regime, when the stationary state is attained. For each regime, we first focus on the mechanical properties and propose a model accounting for friction at the walls and bulk properties; we then study and analyse the rheological properties. In a third section, we point out ambiguity of dependence on relative humidity. We then analyse our results in a standard solid on solid friction framework (the Dieterich-Ruina model). Finally, we study the transition from steady-sliding to stick-slip.
III.1 Steady-sliding
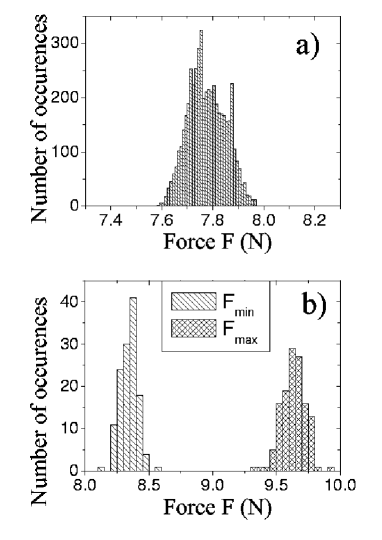
For a given height of beads in the column, at given driving velocity and relative humidity , the force in the steady sliding regime is constant at about (Fig. 5a), and its distribution around mean value is nearly gaussian.
Next, we study the mean pushing force behavior as a function of the packing height, the driving velocity and the relative humidity.
III.1.1 Mechanical properties
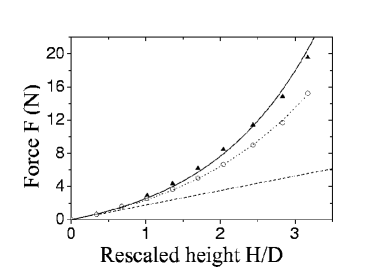
For a vertically pushed granular assembly, the driving force exerted by the piston is screened due to friction with the walls. To evaluate this effect, the mean resistance force in the steady-sliding regime is measured as a function of the packing height (see Fig. 6).
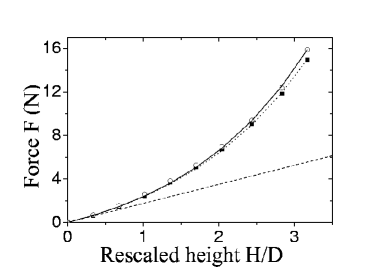
The resistance force increases very rapidly with the packing’s height . Following the standard Janssen screening picture, this strong resistance to motion is due to the leaning of the granular material on the walls created by the horizontal redirection of vertical stress in association with solid friction at the sidewalls. It means that we may relate horizontal and vertical stresses averaged on a slice at height by an effective relation:
| (1) |
where is called Janssen’s redirection constant. At the walls, we suppose a sliding of the granular material at a velocity (the driving velocity); the shearing stress is then
| (2) |
where is the dynamic coefficient of friction between the beads and the cylinder’s wall at a velocity . The constant is introduced in order to differentiate between pushing and pulling experiments. When the granular material is moving upwards and friction is fully mobilized downwards (our pushing experiment) and when the granular is moving downwards and friction is fully mobilized upwards.
The force exerted by the grains on the piston can be derived from equilibrium equations for all slices, thus we obtain:
| (3) |
where is the mass density of the granular material, is the cylinder radius and the acceleration of gravity. The length is the effective screening length.
It is easily seen from (3) that when , any slight change in or is exponentially amplified with a drastic influence on the pushing force . In the steady state regime, the experimental data obtained for a given pushing velocity can be fitted by relation (3) by adjusting only one parameter i.e.
| (4) |
where
is the dynamic coefficient of friction at
velocity .
We see on Fig. 6 that the data
are well fitted by eq. (3), and, for a relative humidity
, for steel beads in the duralumin cylinder, we obtain
at and
at .
We are now able to propose an interpretation of the features
observed for different initial packing fractions within Janssen’s
framework. Since Janssen’s coefficient is an increasing
function of the packing fraction, as it was shown previously
Vanel99 ; Ovarlez03 , the resistance force of an initially
dense packing displays a maximum, as a dense packing leans more
efficiently on walls than a loose one; the pushing force then
decreases while the packing loosens (i.e. while decreases). On
the other hand, for an initially loose packing the resisting force
in the transitory regime will increase while the packing densifies
(i.e. while increases).
For an initially dense
packing, we extract a parameter from a fit of the
pushing force maximum value in the transitory regime with formula
(3): we obtain at and at ; as this experiment was not repeated
sufficiently, we do not have uncertainties on these values.
Nevertheless, we notice that the value is roughly
25% higher than the stationary value, whatever the
velocity is. These results are consistent with a dependence on
compacity derived in Ovarlez03 for an
assembly of monodisperse glass beads, i.e. ; for
initial compacity and steady-state compacity , this
empirical formula actually leads to .
Therefore, in the Janssen framework, we are led to attribute the
difference between maximum force and stationary force to a
difference in stress redirection (i.e. in ) due to a difference
in compacity. The force history in the transitory regime would
then just reflect the compacity history.
As a check of consistency, we perform the following dynamical experiment. First, the granular column is pushed upwards in order to mobilize the friction forces downwards and far enough to reach the steady state compacity. Starting from this situation, the friction forces at the walls are reversed by moving the piston downwards at a constant velocity , until a stationary regime is attained. Note that this stationary regime is characterized by the same compacity as in the pushing situation. Following relation (3), this procedure would imply a change of from to , and consequently, the dynamical force on the piston should decrease from to . In Fig. 7 the pushing force is measured for different packing heights . The fit of experimental results with eq. (3) gives which is larger than . This difference, though small, can be observed out of uncertainties, and is systematic. It cannot be due to a slight change in compacity as from relation , we would expect a 2% variation in compacity between the pushing and the pulling experiment, which would be observed; we actually measured . According to Janssen’s picture, this would imply that vertical stress redirection is more efficient in the downward pulling situation. We believe this is a clear evidence of a granular structuration effects but its also shows that this effect is not dominant: it affects only of the average mechanical parameter .
We have shown in another report that in a Janssen experiment, an isotropic homogeneous elastic material can also be characterized by stress redirection properties Ovarlez03 . For a granular column at high depth an effective relation:
| (5) |
is obtained with
| (6) |
where is the material’s
Poisson coefficient. This actually leads to a curve similar to
Janssen’s saturation curve as long as friction at the walls is
small (typically less than ).
In order to get the isotropic homogeneous elasticity prediction
for the pushing experiment, we perform a series of numerical
simulations using Finite Element Method Castem . The column
is modelled as an isotropic elastic medium. We vary the friction
at the walls , the Young modulus and the Poisson
coefficient . We impose a rigid, either perfectly stick
or perfectly slip bottom. We find no appreciable difference
between these two previous cases. The condition
is imposed everywhere at the
walls (for the pulling situation, we impose ). The cylinder is modelled as a duralumin elastic
medium. As long as the Young modulus of the elastic medium is
less than MPa, which is usually the case for granular media,
we find no dependence of the results on . We verified that in
all the simulations we performed, there is no traction in the
elastic medium, so that this could be a fair modelling for a
granular material.
We find no appreciable difference between the elastic prediction (Fig. 8) and the curve given by eq. (3) with . Therefore, regarding the dependence of the stationary state force on the height of beads, our system cannot be distinguished from an elastic medium.
Note that finite element simulations show that the presence of a rigid bottom implies that the effective Janssen’s parameter extracted from Janssen’s scaling for the pulling situation is higher than Ovarlez03 , whereas for the pushing (as can be seen on Fig. 8: the fit of the elastic curve with is good). Details on this numerical work will be given elsewhere OvarlezSimuls . Actually, if we adjust the elastic predictions for pushing and pulling experiments with an elastic material of Poisson coefficient , eq. (3) yields a Janssen’s constant for the pushing which is about lower than for the pulling. This is qualitatively (though not quantitatively) in agreement with the experimental results. Then isotropic elasticity can be a good framework only if we neglect the existence of bulk structuration effects inducing differences in the effective Poisson coefficient of the material between the pulling and the pushing. Note that in this case, an isotropic modelling of the granular material is somehow questionable.
In a previous study Vanel99 , it was found that the Janssen picture has a general tendency to slightly underestimate the stress below a granular column for a homogeneous packing of glass beads. We have showed in another report that it is no more true as the friction at walls is very well controlled. Therefore, this model, though elementary, seems a fair base for analysis and provides an analytical expression from which constitutive rheological parameters can be extracted. A central question is still that the fitting parameters extracted from the model does not allow to distinguish between and separately.
In the following, we will show experiments which aim at sorting out the relative contributions of wall-bead interactions (i.e. ) and bulk properties (i.e. ) which have an influence on the rheological properties when velocity and relative humidity are changed.
III.1.2 Rheological properties
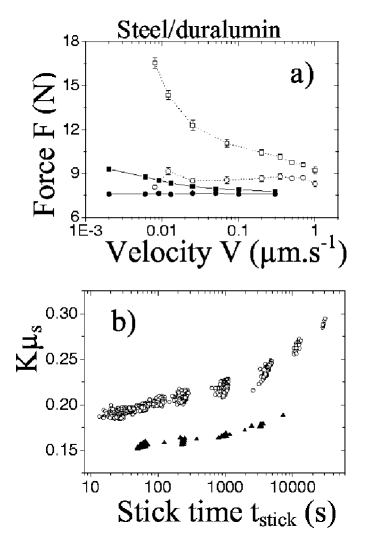
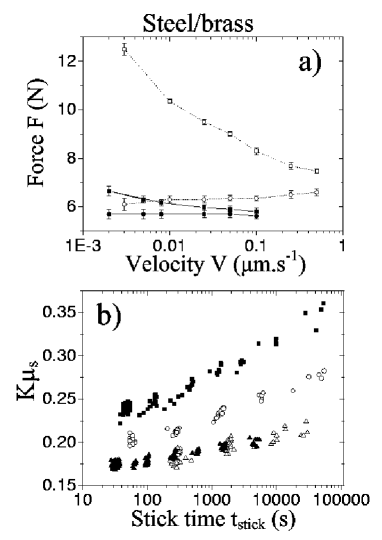
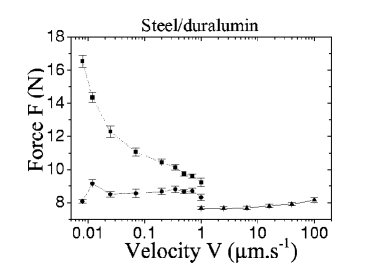
The mean resistance force in the steady-sliding regime increases strongly when the velocity and the relative humidity are increased. In the duralumin column (Fig. 9), the resistance force at velocity is higher for relative humidity than for ; near the transition to the stick-slip regime (), dependence of on is much less important, and there is actually no difference in values for varying between and . Another important feature is that the increase of with velocity is sharper when is higher. In the brass column (Fig. 10), the mean resistance force also increases with relative humidity , but now the variation coefficient with velocity (the slope on Fig. 10) does not seem to depend on . Moreover, for a velocity , the increase is only from dry to humid () atmosphere.
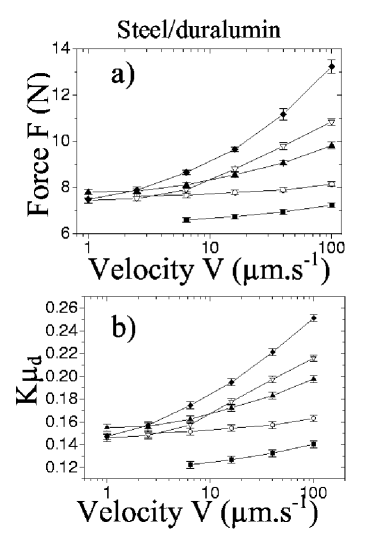
The fit of with Janssen’s formula adapted to the pushing case of eq. (3) gives parameter for different relative humidities . The fundamental differences of behavior in the steady sliding regime between the duralumin column and the brass column for a same granular material, at same density, suggest that the variations in and velocity have an influence mainly on the coefficient of friction at the walls, and little on mechanical properties of the granular material (i.e. ). Therefore, in the following analysis, we will consider as a constant at first order of approximation.
Steel/duralumin
Fig. 9 shows that dynamical parameter is globally less important in a dry atmosphere than in the ambient atmosphere. In ambient atmosphere (), a change in seems to change only the variation coefficient of with velocity: i.e. the increase of with velocity is sharper when is higher. This phenomenon could be interpreted as a viscous contribution of the water condensed at the contacts. Note that this phenomenology contrasts with the observations of Riedo et al. Riedo02 who find, for solid on solid nanoscopic sliding friction measurements, that in all the systems they study, of various wettability, the effect of a humidity increase is to add a negative value to the coefficient of friction force dependence on logarithm of velocity. Table 1 shows the results of a rough logarithmic fit of data with . We use the parameter as a standard reference to the Dieterich-Ruina model Dieterich79 ; Ruina .
| relative humidity | |
|---|---|
We observe that the increase rate of with the logarithm of velocity is multiplied by when increases from to .
In order to compare these results with those obtained in a solid
on solid friction experiment, we need to evaluate Janssen’s
parameter . We extract from a classical Janssen experiment
Ovarlez03 and we obtain: for a
mean aging time of seconds. From the measurement of static
friction, using the sliding angle of a three bead tripod, we
extract .
We suppose is constant and is
not affected by any variation in relative humidity nor velocity.
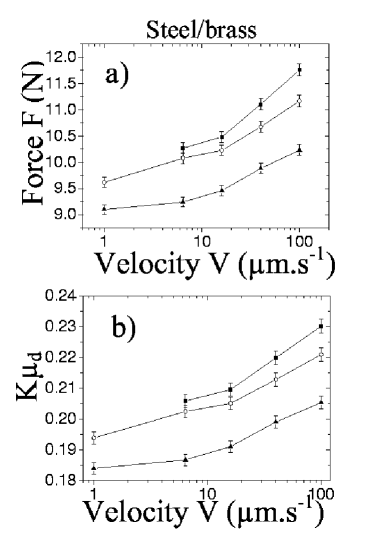
The dynamical coefficient of friction obtained in a solid on solid
friction experiment with the slider (Fig. 1 inset) is
then compared on Fig. 11 with the one extracted from a
fit of the resistance force with formula (3). Note that the
uncertainty on extracted from formula (3) is
mainly systematic (coming from uncertainties on , which come
themselves from uncertainty on static friction measurements). We
observe that the dynamical coefficients of friction measured in a
solid on solid experiment increase slightly more strongly with
velocity than the one extracted from the resistance force of the
granular material. But importantly, the increase of with
relative humidity is the same in both cases.
In this
analysis we assumed a constant value for Janssen’s coefficient
. We can also imagine a slight decrease of with increasing
velocity so that the solid on solid would match the one
extracted from the pushing experiment. However, we will remain
prudent as the mean pressure contact on beads in the solid on
solid experiment is much higher than in the granular column, which
may cause quantitative differences between friction properties.
More precisely, at the bottom of the column, for a pushing force
N, the mean contact force per bead is about mN; a Hertz contact would give mean contact pressure MPa. For a contact force per bead of N (the
slider case), a Hertz contact would give MPa.
Steel/brass
In the brass column, we observe the same phenomenology as in the duralumin one, i.e. an increase of with velocity and relative humidity . The effect of a change in is yet less important than in the duralumin column, as the coefficient increases only by at velocity when increases from to . A major difference with the duralumin column is that in the brass column, a variation in seems to induce a variation of friction but hardly affects the coefficient of variation with velocity (the slope). Table 2 shows the results of a logarithmic fit of the data with the function: . We observe indeed that the slope of with the logarithm of velocity does not practically vary with relative humidity , and is much weaker than in the duralumin column.
| relative humidity | |
|---|---|
The comparison with the slider, and the differences between the duralumin and bras columns, suggest that the rheological properties in the steady-sliding regime are dominated by the friction properties at the walls. We now investigate the stick-slip regime.
III.2 Stick-slip regime
In the stick-slip regime, for a given height of beads in the
column and at given driving velocity and relative humidity
, the maximum force before a slip and the minimum force at
the end of a slip are constant within (Fig. 5b).
Their distribution around mean values and is
nearly gaussian.
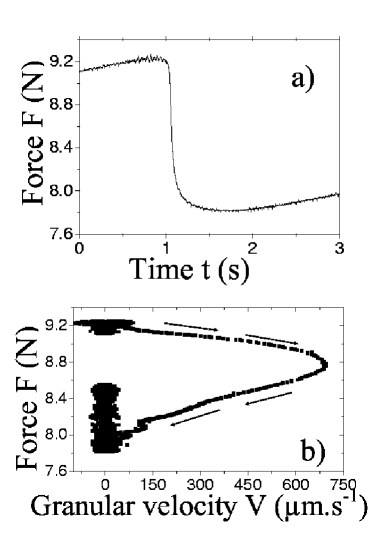
The dynamical evolution of the pushing force during the
slip phase can be translated into a function of the granular
material instantaneous velocity. Motion of the granular material
at velocity induces a variation
of resistance force during time
, where is the force probe stiffness and
the driving velocity; we thus obtain
. We see (Fig. 12) that
the acceleration and deceleration phases are nearly symmetric.
This phenomenology is currently observed in solid friction
experiments. This is in contrast with previous plane shearing
experiments of granular materials Gollub97 in which the
deceleration phase would occur in two steps, first fast and then
slow. However, a major difference is that in the latter case, the
displacements during slippage are millimetric (a grain size)
whereas in our experiment, they are micrometric (m on
Fig. 12). As a consequence, the evolution of forces
observed during a slip seems to reflect the slippage of grain
contacts at the walls. The maximum velocities obtained during the
slip phase are of a few hundred . We did not
study systematically the variation of instantaneous velocity with
bead height nor with driving velocity.
In the following, we report on the and properties as a function of the packing height, the driving velocity and the relative humidity.
III.2.1 Mechanical properties
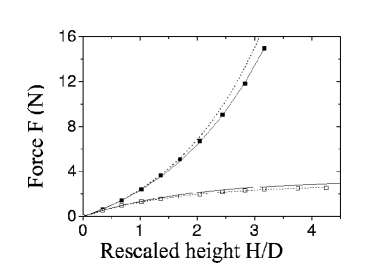
In the stick-slip domain, the mean maximum and minimum resistance forces and are measured as functions of the packing height (see Fig. 13), but now we choose to perform our experiments not at a constant velocity , but at constant stick time and we explain why in the following.
Experimentally we find that the resistance forces and increase exponentially with the packing’s height . The data can actually be fitted by a formula of type eq. (3), but the parameter extracted may be different and should not depend on as the granular material is not sliding during stick, and does not slide at driving velocity during slip.
The model can actually be simply modified for this situation. In the stick-slip regime, when the resistance force is equal to , the material just starts slipping, which means that static friction is fully mobilized at this instant for each contact. So we can write everywhere at the walls, where is static friction between beads and the cylinder’s walls. Static friction coefficients are known to evolve in time Baumberger97 , we then have to include aging effects. As the granular material was at rest in the column since the previous slip, aging time in this situation is the time of stick:
| (7) |
So the final formula for in the Janssen framework is:
| (8) |
where the screening length is now . Here again, for a pushing experiment (i.e. ), for a Janssen experiment. The choice of imposing a constant stick-time instead of constant driving velocity for the experiments in the stick-slip regime is now justified by the dependence of on , whereas depends on .
In the steady state regime, the experimental data obtained for a given stick-time can be fitted by relation (8) by adjusting only one parameter i.e. where is the static coefficient of friction for an aging time . For the data of Fig. 13 obtained for a relative humidity with a mean stick time of s, we find from ( in eq. (8). Note that, though friction is not fully mobilized when , the fit of with eq. (8) is good (Fig. 13); we obtain a parameter which should not be related to in that case.
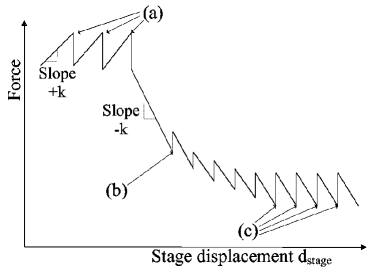
As a check of consistency, we perform the following dynamical experiment in the stick-slip regime. First, the granular column is pushed upwards in order to mobilize the friction forces downwards and to reach the steady state compacity; (referred to as (a) on Fig. 14) is then measured for constant stick time . Starting from this situation, the friction forces are reversed at the walls by moving the piston downwards. We then measure the force of the first slip (referred to as (b) on Fig. 14) after the same time . Note that the roles of and are inverted in the pulling experiment: is the minimum force before a slip, and is the maximum force at the end of a slip. We also measure mean minimum force (referred to as (c) on Fig. 14) when a steady stick-slip regime is reached in the pulling experiment. Note that this stationary regime is characterized by the same compacity as in the pushing situation.
Following relation (8), this procedure should imply a change
of from to , and consequently, the force at the
onset of slipping on the piston should decrease from to
. As we observed no noticeable variation of compacity
between the pushing and the pulling, we expect Janssen’s parameter
value to be unchanged. In Fig. 15 the pulling force
is measured for different packing heights , for the
first slipping event and in the steady stick-slip regime. The fit
of experimental results with eq. (8) gives for stationary stick-slip which is
larger than . It cannot be due to a slight
change in average compacity as from relation
, we
would expect a variation in compacity, which would have been
observed; let us recall that we actually measured a compacity
variation between the pushing and the pulling experiment .
As in the steady-sliding experiment, according to Janssen’s
picture, this would then imply that vertical stress redirection is
more efficient in the pulling situation; furthermore, this effect
is enhanced in the stick-slip regime. For the first slip event in
the pulling experiment, we find which is now lower than . We believe this is a clear evidence of a granular
structuration effects. We interpret the differences in
values by saying that the packing has first been structured to
resist the pushing; when we start pulling, structure is not
efficient to resist the pulling, and it results in a lower
Janssen’s constant (therefore lower ) for the first slip
event; when we continue pulling, the packing gets structured to
resist pulling and leans more efficiently on the walls, i.e.
Janssen’s constant (and ) increases. Moreover,
steady-state structuration is more efficient for the pulling than
for the pushing, which means that both structurations may be
different and could reflect the symmetry breaking due to gravity.
The results of the simulations of an elastic medium in a column presented in the precedent section for a steady-sliding also carry on to the stick-slip situation. If we impose numerically everywhere at the walls, the relations or , it would merely correspond to a change in the name of the friction coefficient. The equilibrium equations are the same for the static and steady dynamic cases. The important common point is that friction forces are fully mobilized everywhere at the walls. Therefore, as for the steady-sliding, the data can be fitted by the elastic predictions, and the difference in Janssen’s parameter between the pulling and the pushing of an elastic medium of constant Poisson ratio is again qualitatively (though not quantitatively) in agreement with the experimental results.
In the following, as we study the steady-state regime, we will try to distinguish between wall-bead interactions (i.e. ) and the bulk properties (i.e. ) as they influence the rheological properties when velocity and relative humidity are changed.
III.2.2 Rheological properties
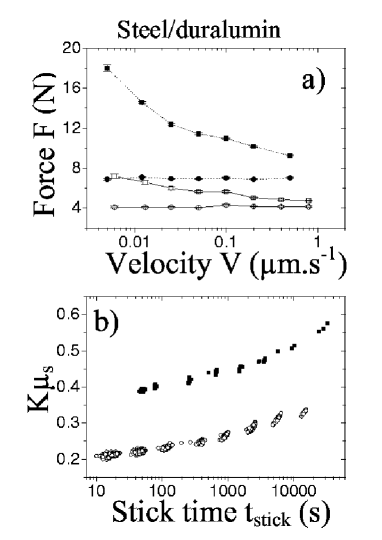
The mean maximum force increases strongly when the driving velocity is decreased and the relative humidity is increased (Fig. 16a, 17a, 18a). Furthermore, apparent divergence when decreases is enhanced when increases. The mean minimum force is almost independent of the driving velocity, and increases when the relative humidity is increased (Fig. 16a, 17a, 18a). For each stick-slip event, an aging time (the stick time) is measured: . This time is associated to a parameter extracted from the fit of the maximum force of this stick-slip event with equation (8). In the following, the results of this analysis for duralumin and brass columns are compared and discussed.
Steel/duralumin
For steel beads in the duralumin column, the parameter
(Fig. 16b, 17b) increases roughly
logarithmically with aging time, and increases strongly with
relative humidity . Its value increases by 50% when
increases from to , and doubles when increases
from to . The parameter does not depend
only globally on , but its logarithmic aging rate with
stick time depends strongly on . The parameters
extracted from a logarithmic fit of with
are given in table
3 for different relative humidities.
Note that magnitude of , as is of
the order 1, is consistent with many previous reports on solid
friction Berthoud99 ; Crassous99 . An important feature is
that the logarithmic aging rate appears to be 4 times higher in
humid atmosphere than in dry atmosphere.
| relative humidity | |
|---|---|
The logarithmic evolution is not perfect: for aging time larger
than s, we observe that increases more sharply
with time; for of steel beads and ,
varies from for times s to about
in the last time decade (Fig. 17b). This phenomenon was
observed for all relative humidities . It is similar to what
was reported previously by Losert et al. Gollub97 for plane
shearing of glass beads.
It is tempting to link this enhanced
aging behavior to the granular material slow restructuring effects
since one may think of an aging of the granular structure leading
to a better stress redirection at the walls.
However, at this point, it is not possible to differentiate between wall and structure properties. We tried to measure independently aging properties in a solid on solid experiment, but we did not obtain satisfactory statistics to conclude. Therefore, we need to compare the results obtained in the duralumin column to the one obtained in the brass column.
Steel/brass
For steel beads in the brass column, the parameter extracted from the experimental measurements (Fig. 18b) also increases logarithmically with aging time. However, the increase with relative humidity is much less important than in the duralumin column since increase is only when increasing from dry atmosphere to humidity, whereas the increase is more than in the duralumin column for the same variation of . Moreover, the increase with stick time seems now perfectly logarithmic over 4 decades of time variation.
As in the duralumin column, increase rate with stick time depends on . The parameters extracted from a logarithmic fit of with are given in table 4. Logarithmic aging rate is now 2.5 times greater in humid atmosphere than in dry atmosphere (it was 4 times higher in the duralumin column).
| relative humidity | |
|---|---|
Comments
The only differences between both systems (duralumin and brass column) being the contacts at the walls, as for the steady-sliding regime, the differences observed in the rheological behavior suggest that the aging of is mainly an aging of friction coefficient at the walls and that humidity affects principally the contacts at the walls.
Relative humidity seems to have two effects in the
duralumin column: first, the aging rate is higher when is
higher, second, the friction level for short times is higher when
is higher.
In the brass column there seems to be an
effect of only on the aging rate: the
curves for different cross for ms. The logarithmic
aging rate coefficient gets comparable values in both columns, but
it is higher in the duralumin column () in humid
atmosphere than in the brass column ().
Our observations are consistent with recent aging experiments in granular media Boquet98 ; Restagno02 and solid on solid aging experiments Crassous99 , who found logarithmic aging of static friction enhanced by an increase in relative humidity . These results have been interpreted by the dynamics of capillary condensation at the contacts Boquet98 ; Restagno00 , which is a thermally activated process: as time goes on, there are more and more capillary bridges at the contacts, which are responsible for an adhesion force increasing with aging time; moreover, condensation goes faster when is higher. In these models, there is no aging in dry atmosphere, as no condensation can occur; this prediction agrees with most observations Crassous99 . As in our experiment the logarithmic aging rate coefficient is not zero in dry atmosphere (even though the air flux we impose is probably not perfectly dry), we can conclude that capillary condensation is not the only source of aging. Another source of aging can be creep of contacts Berthoud99 .
We observed that aging is perfectly logarithmic in the brass column. Therefore, we are led to analyze again the aging in the duralumin column since the interpretation based on aging of internal friction we proposed for the duralumin column, should also apply to the brass column, which is in contradiction with the observed behavior.
If we suppose that properties depend only on the granular
material properties, the acceleration of logarithmic aging in the
duralumin column may be not linked to aging of bead/bead contacts
nor granular slow restructurations. We may then start from the
following experimental observations: in solid on solid friction
experiments, static friction coefficients are found to
depend on the applied shear exerted for a given waiting time
Berthoud99 ; OvarlezGauthier . For a higher shear during a
given waiting time, coefficient is higher, and the
logarithmic aging rate is higher too Berthoud99 . In our
experiments, during a “stick” event, the pushing force increases
linearly with time, i.e. shear at the walls (and contact pressure)
increases. As a consequence, aging occurs with a non-constant
applied shear and the mean shear is more important when the aging
time is higher. Consequently for high waiting time or stick time,
i.e. for high mean shear at the walls, the aging of the static
friction coefficient may be accelerated.
This
phenomenology may be a priori different for different surfaces,
which would explain why aging seems perfectly logarithmic in the
brass column, and not in the duralumin column.
III.2.3 Analysis of evolution
Now, the high enhancement of the blocking resistance force with decreasing driving velocity can be simply understood within the Janssen framework . We start from the experimental observation that the minimum force after a slip does not depend on velocity (at constant relative humidity ): . Therefore, the aging time before a slip reads:
| (9) |
We suppose, as well verified experimentally, that the coefficient of friction at the walls follows a logarithmic aging law:
| (10) |
This value of for aging time can be injected in formula (8). We then obtain:
| (11) |
with .
The apparent divergence of
with decreasing velocity, as observed experimentally, is
thus more important when the height of beads and the logarithmic
aging rate of friction at the walls (i.e. relative humidity as
increases with ) are higher. The observed strong
dependence of with then corresponds to an
exponential amplification of friction aging at the walls. Elements
of interpretation along these lines were already given in ref
Ovarlez01 .
III.3 Influence of relative humidity: an open problem
Nevertheless from the whole series of experiments we performed on this system we are led to conclude that the dependence of the phenomenology with the relative humidity remains sometimes unclear.
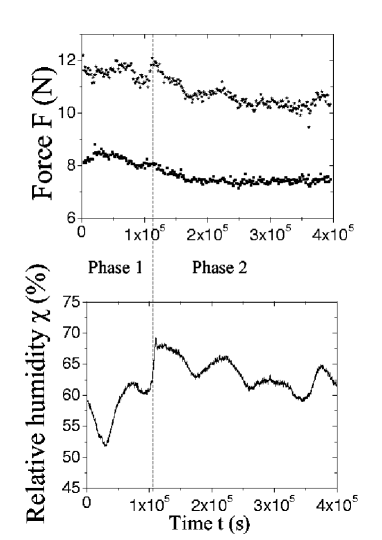
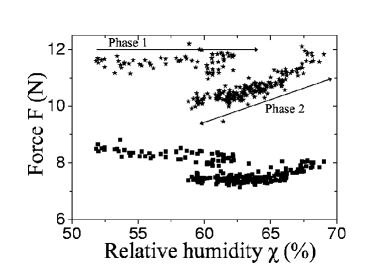
As an illustration of this statement, we report the following result (Fig. 19, 20). In an experiment performed in the stick-slip regime and in the ambient atmosphere, for a driving velocity , the forces and were found to be independent of , which was varying between and , during the first 30 hours of the experiment. We then observed that the and variations became suddenly correlated to the variations and would stay correlated for the next 80 hours. For the first 30 hours, increased from to , while and were nearly constant: N, N. Then varied from to in one hour: and started to be correlated to from this “ triggering event” and for the next 80 hours as if the system had suddenly reached some “reversible branch”.
Such a phenomenology was never obtained when humidities and were imposed. When we imposed dry atmosphere, the force would reach its stationary value in a few minutes, and we never noticed any variation in this value for 5 days; when we imposed humid atmosphere, the force would reach its stationary value in a maximum of 3 hours and we noticed no variation in this value for 5 days.
This may however incite to prudence for results obtained in ambient atmosphere, for experiments performed on the granular column as much as for solid on solid friction experiments. As an example, we see on Fig. 20 that for , N when forces and are not correlated, whereas N when they are correlated.
Furthermore, this opens the question of the metastability of capillary condensation. If variation of with is interpreted as variation of due to thermally activated capillary condensation at the contacts Boquet98 ; Restagno00 , it seems possible that capillary condensation did not occur for hours. If we notice that starts to be correlated with when constant value is equal to on the dependent part of the curve (i.e. N and ), another possibility is that there were as much capillary bridges condensed at the contacts as for in the first part of the experiment, i.e. that evaporation does not always happen.
III.4 Dieterich-Ruina analysis
A standard phenomenological model accounting for static and dynamic properties of solid friction is the so-called Dieterich-Ruina model Dieterich79 ; Ruina . In this picture, the coefficient of friction is
| (12) |
where obeys othermodels
| (13) |
, , , and are constants dependent of the materials in contact. Parameter is usually interpreted as a characteristic length for renewal of contacts and is of order of the creep length before sliding Heslot94 . In a stationary steady-sliding regime is interpreted as a characteristic time for renewal of contacts.
This model accounts for the logarithmic aging of static friction, and the logarithmic velocity strengthening or weakening in the steady-sliding regime with:
| (14) | ||||
| (15) |
It also accounts for a third usual phenomenon observed in the transitory regime when the velocity is changed suddenly. In this case there is an abrupt change in friction coefficient followed by exponential relaxation to a new stationary value. If we change velocity to velocity , the instantaneous change in friction coefficient from stationary value is ; friction change from this value to new stationary value is then during typical time , i.e. we get .
Now we test the Dieterich-Ruina model with the steel/duralumin and steel/brass friction coefficient extracted from our data. As we observed logarithmic aging and rough logarithmic velocity strengthening, we get parameters and . We are therefore able to test this model predictions with the observation of response to an abrupt variation of velocity.
Experimentally, we never observed any transitory state: the force in the steady sliding regime was always changed from stationary value to stationary value when changing velocity from to . From the measured value of for steel/duralumin friction and for steel/brass in ambient atmosphere, we would however expect the force at the beginning of the transitory regime to be N larger (steel beads height ) than the stationary force at the new velocity. As the natural fluctuations of force are around N, we would therefore expect to observe this transitory regime in due to change in friction at the walls. Now we give an interpretation for why, within the Dietrich-Ruina picture, this transitory regime was not observed, which yields an upper bound for the material contact renewal length .
When velocity is changed from to for (380 g) of steel beads in a duralumin cylinder, the change in stationary value is of 1 N. But, due to the finite stiffness of our set-up, this change cannot be instantaneous: an increase of force at constant velocity takes minimal time . So an increase of 1 N of force at takes time s. This time must be compared to time length of transitory regime: . Therefore, in the framework of the Dieterich-Ruina model, we need to be less than the time of force variation, which means m .
Let us now consider a sudden decrease in velocity from to . Now the decrease of force is governed by inertial time: which can be evaluated around ms. This leads to nm (so that ) consistently with the Dieterich-Ruina model if no transitory state is observed.
We have no precise measure for but this upper limit on the value is coherent with the usual interpretation in terms of length for contact renewal, as the duralumin column mean roughness is 400 nm. Thus, we can neither validate nor rule out the Dieterich-Ruina model for our system.
III.5 Transition mechanism
For experiments performed at given height of beads and relative humidity , we observe that the transition from stick-slip to steady-sliding occurs for a finite stick-slip amplitude (Fig. 21). This suggests a subcritical transition but such a transition would be hysteretic. In order to verify this feature, we make the following experiment: we drive the system at constant velocity in the steady-sliding regime near the transition until it reaches a stationary state, we then decrease continuously the velocity, without ever stopping the movement, to a velocity for which stick-slip used to occur. Note that the results reported in the previous sections and on Fig. 21 were obtained for independent experiments on systems driven at a unique velocity. We observe that if we impose directly, we obtain a stick-slip motion, whereas when we decrease velocity from (in the steady-sliding regime) to the motion is steady-sliding. This proves the hysteretic character of the transition, which was actually hard to observe as the system seems very sensitive to noise.
This transition is similar to the one observed by Heslot et al. Heslot94 in solid on solid experiments; it correspond to what they call the ”inertial regime”. It is a characteristic of systems for which the dynamical coefficient of friction increases with velocity. This transition scenario was explained by Brockley et al. Brockley . However they find that the force in the steady-sliding regime at the transition is of order of . We actually find (see Fig. 21) that is less than for steel beads in the duralumin cylinder, a feature we do not understand, whereas for in the brass cylinder.
Again, the transition we observed is consistent with a picture of solid friction sliding instability at the wall. This is also consistent with the model we have developed in the previous section.
IV Polydisperse glass beads
After the study of the simplest case, with monodisperse low friction beads, we now want to study the effect of disorder (friction, polydispersity) on rheology. Therefore, we choose to study a miscellany of glass beads using a three diameters mixture (1.5 mm, 2 mm and 3 mm) with equal volume of each kind in an abraded PMMA cylinder. In the following, we present the features obtained in the stick-slip regime for this system.
IV.1 Stick-slip characterization
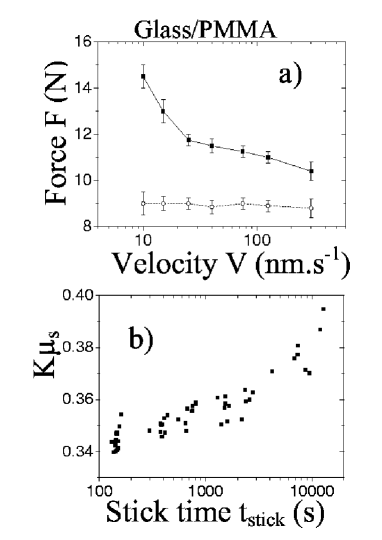
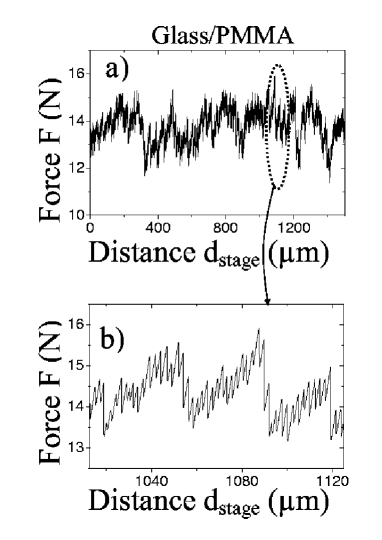
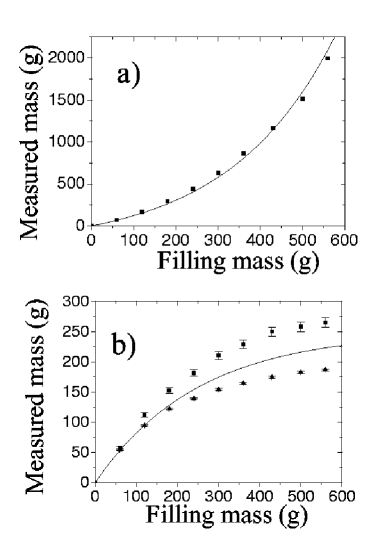
For low velocities (), a stick-slip motion is obtained with the same properties as observed with monodisperse steel beads in a duralumin or brass cylinder. It is a regular stick-slip motion characterized by a maximum force before slipping that increases strongly when velocity is decreased, and a minimum force after slipping which does not depend on velocity (Fig. 22a). A coefficient can be extracted from with equation (8) for low velocities (). Again, it shows a logarithmic aging of friction at the walls (Fig. 22b). However, the behavior changes for higher velocities just before the transition to steady-sliding. The stick-slip motion is then less and less regular as the velocity is increased. Furthermore we observe structures in the force signal. Figure 23 evidences cycles of force increase during which the maximum and minimum forces increase for several stick-slip events, as the force amplitude during a stick is higher than the force amplitude during a slip. Then, at the end of a cycle, there is a big slip event and a new cycle starts. This phenomenon is similar to the one observed by Albert et al. Albert99 for the pushing of a stick in a granular material, and to the one observed for aluminium beads by Kolb et al. LaKolb99 in the same display as ours but in 2D . It was however much more important in that last study in 2D: the force would then increase from after a big slip event to before the next big slip event.
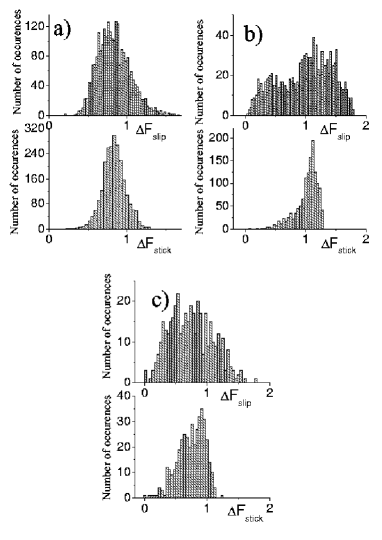
We analyse this phenomenon by studying the distribution of force amplitudes defined as for the stick event, and for the following slip event (Fig. 24). We observe the evolution of these distributions with increasing velocity. distribution remains centered around a mean value; however, this distribution gets larger when the velocity is increased. For lower velocities ( on Fig. 24a), stick-slip is regular, and distribution is regular around same mean value as (with nevertheless a larger distribution). When velocity is increased, the distribution is still predominant around same mean value as but many smaller values start to merge in the distribution ( on Fig. 24b); these small values become as frequent as the larger ones for higher velocities ( on Fig. 24c). The distribution also enlarges to the higher values which corresponds to occurrence of the big slip events. Note that in these experiments, the transition to steady-sliding regime occurs for velocity a velocity around .
IV.2 Analysis
Several explanations can be proposed to account for this complex dynamics exhibiting a large distribution of energy release. In our point of view, the principal ingredient for an explanation seems to be the progressive structuration of the packing between two big slip events. In the Janssen model picture, the progressive increase of in a cycle corresponds to progressive increase of Janssen’s constant . The value increases from an initial value at the beginning of a cycle up to a maximum value at the end of the cycle, and is reinitialised by a big slip event to value . Let us recall that was found to increase with density in another report Ovarlez03 . A consequence of this dependence was shown in section III.1.1. Therefore, a way to obtain the phenomenology is to start from a loose packing at the beginning of a cycle; if each small slip event densifies the packing (as can be expected from compaction under vibration), it leads to a small increase in , so that the minimum force at the end of the slip is higher than the force at the end of the preceding slip; the maximum force at the end of the stick is also higher than the force at the end of the preceding stick. Sometimes, big events occur; they probably correspond to convective motion at the walls, as observed by Kolb et al. in 2D LaKolb99 , which loosens the packing, which then gets the initial density of the cycle.
For the interpretation we give, the stick events last a constant time as the aging time of contacts at the walls is still controlled by the velocity. This explains why the distribution of is still centered on mean value contrary to .
But still a criterion for big slip events has yet to be found; it may be the level of stresses, or a dilatance effect at high density causing shear band and convection rolls. The regularity of stick-slip motion at low velocities can be understood if the criterion for big slip events is at an upper stress level. A slow driving velocity leads to long aging of contacts at the walls so that the maximum force is always greater than the threshold to obtain a big slip. All slip events are then big slip events in this case.
This transition from a simple steady stick-slip to a complex dynamical regime with a large distribution of elastic energy release is an interesting issue and we plan to pursue further the investigation trying to clarify in particular the role of disorder and polydispersity in the phenomenology.
V Conclusion
We presented an experimental report on the dynamical behavior of a granular column pushed vertically. We first investigated the case of a monodisperse assembly of steel beads and we observed at low driving velocities () a steady behavior such that the pushing forces increase roughly logarithmically with velocity. On the other hand, at very low driving velocity (), we evidenced a discontinuous and hysteretic transition to a stick-slip regime characterized by a strong divergence of the maximal blockage force when the velocity goes to zero. All this phenomenology is strongly influenced by surrounding humidity: generally, higher humidity level increases strongly the resistance to pushing. Finite elements numerical simulations were used to confront experimental results to a modelling of the granular packing as an isotropic elastic medium. Then, we showed that a simple Janssen’s model is a fair base for analysis as it provides the correct physical interpretation for the pushing resistance. This Janssen’s model was used to extract an important mechanical parameter combining the effects of stress redirection and wall friction but there is an inherent difficulty to isolate clearly the various contributions either coming from bulk reorganization or from the surface friction properties.
Using different column materials and measuring directly the friction of a grain with the wall, we accumulated several evidences leading us to conclude that the force dependence with driving velocity and humidity is strongly related to the bead-wall friction properties: (i) in the steady limit grain/wall tribology measurements show a friction force increasing with humidity and velocity, (ii) in the stick-slip regime, the blockage enhancement can be related to humidity induced aging of the bead-wall friction, (iii) the hysteretic transition mechanism from stick-slip to steady-sliding is similar to the one observed in solid-on-solid experiments Brockley ; Heslot94 .
In spite of a dominant surface effect, we could also identify contributions of bulk structurations. For example, we related the transitory part of the response to pushing to a dependance of the coefficient of redirection between horizontal and vertical stress with packing fraction. Also a clear difference of the mechanical parameters extracted from pushing and pulling experiments shows a contribution from restructuration of about 20%.
A second system, made of polydisperse assemblies of glass beads, was investigated. We emphasize the onset of a new complex dynamical behavior, i.e. the large distribution of blockage forces evidenced in the stick-slip regime close to the transition.
VI Acknowledgments
We acknowledge collaboration with C. Fond, C. Gauthier and E. Kolb. We thank J. Lanuza and P. Lepert for technical support. We are grateful to Professor T. Baumberger, Professor R.P. Behringer, and Professor C. Caroli for many interesting discussions.
References
- (1) Physics of Dry Granular Media, ed. by H.J. Herrmann, J.-P. Hovi and S. Luding, Kluwer Acad. Publisher (1998); E. Clément, Current Opinion in Rheology and Interface Science 4, 294 (1999)
- (2) D.M. Wood, Soil Behaviour and Critical State Soil Mechanics (Cambridge University, Cambridge, England, 1990).
- (3) P. Berthoud et al., Phys. Rev. B 59, 14313 (1999).
- (4) J. Crassous et al., Europhys. Lett. 47, 562 (1999).
- (5) E. Riedo, F. Lévy and H. Brune, Phys. Rev. Lett. 88, 185505 (2002).
- (6) S. Nasuno, A. Kudrolli and J.P. Gollub, Phys. Rev. Lett. 79, 949 (1997); J.C. Géminard, W. Losert and J.P. Gollub, Phys. Rev. E 59,5881 (1999); W. Losert et al., Phys. Rev. E 61, 4060(2000).
- (7) V.K. Horvath, I.M. Janosi and P.J. Vella, Phys. Rev. E 54, 2005 (1996).
- (8) R. Albert et al., Phys. Rev. Lett. 82, 205 (1999); G. D’Anna, Europhys. Lett. 51, 293 (2000).
- (9) M. Lubert and A. de Ryck, Phys. Rev. E 63, 021502 (2001).
- (10) J.-L. Aider et al., Phys. Rev. E 59, 778(1999).
- (11) E. Kolb et al., Eur.Phys.J B 8, 483 (1999).
- (12) G. Ovarlez, E. Kolb and E. Clément, Phys. Rev. E 64, 060302.
- (13) Y. Bertho, F. Giorgiutti-Dauphine and J.-P. Hulin, preprint cond-mat/0211510.
- (14) J. W. Landry et al., to appear in Phys. Rev. E.
- (15) G. Ovarlez, C. Fond and E. Clément, submitted; preprint cond-mat/0212228.
- (16) G. Ovarlez, C. Fond and E. Clément, in preparation.
- (17) L. Vanel, E. Clément, Eur. Phys. J. B 11, 525 (1999).
- (18) with CAST3M, http://www.castem.org:8001
- (19) J.H. Dieterich, J. Geophys. Res. 84, 2161 (1979).
- (20) A. Ruina, J. Geophys. Res. 88, 10359 (1983).
- (21) T.Baumberger, Solid State Commun. 102, 175 (1997).
- (22) L. Bocquet et al., Nature 396, 735 (1998).
- (23) F. Restagno, H. Gayvallet and E. Charlaix, Phys. Rev. E, 66, 021304 (2002).
- (24) F. Restagno et al., J. Phys.: Condens. Matter 12, A419 (2000).
- (25) G. Ovarlez, C.. Gauthier and E. Clément, private communication.
- (26) There are other models for , some of them are recessed by Ruina Ruina .
- (27) F. Heslot et al., Phys. Rev. E 49, 4973 (1994).
- (28) C.A. Brockley, R. Cameron and A.F. Potter, J. Lubrication Technology 89, 101 (1967).