[
Anisotropy of the Mobility of Pentacene from Frustration
Abstract
The bandstructure of pentacene is calculated using first-principles density functional theory. A large anisotropy of the hole and electron effective masses within the molecular planes is found. The band dispersion of the HOMO and the LUMO is analyzed with the help of a tight-binding fit. The anisotropy is shown to be intimately related to the herringbone structure.
pacs:
Keywords: pentacene, bandstructure, effective mass, anisotropy, mobility]
I Introduction
Charge transport in organic molecular conductors has gained prominent interest as it is expected that in ultra-clean materials band transport with high electronic mobilities can be obtained. Recent progress in synthetic procedures have minimized mobility reducing factors, such as disorder, Frenkel defects, and Schottky defects. Thus, mobilities up to 1 cm2/Vs have been obtained in thin film devices and in single crystals at room temperature.[1, 2, 3, 4]
Pentacene has gained prominent interest because of a number of favorable materials properties. Large single crystals can be easily grown by vapor transport,[5] and the material can be handled in air. The reactivity of pentacene to impurity levels of oxygen and hydrogen is often underestimated, but can be minimized using appropriate synthetic conditions.[6] Despite the presence of at least four different polymorphs,[7] there are no structural phase transitions observed for the most stable polymorph, the single crystal polymorph.[8, 9, 10] The layered crystal structure indicates a highly two-dimensional charge transport.
In this paper we use first-principles density functional theory (DFT) to calculate the bandstructure of pentacene. We find a very large anisotropy of the effective mass within the layers, resulting from a frustration of the electron transfer along the crystallographic b-axis. This frustration is rationalized using a tight-binding fit of the band structure, and is intimately related to the herringbone geometry of the crystal structure of pentacene. Our results imply that the mobility is strongly directionally dependent within the layers.
II Structure
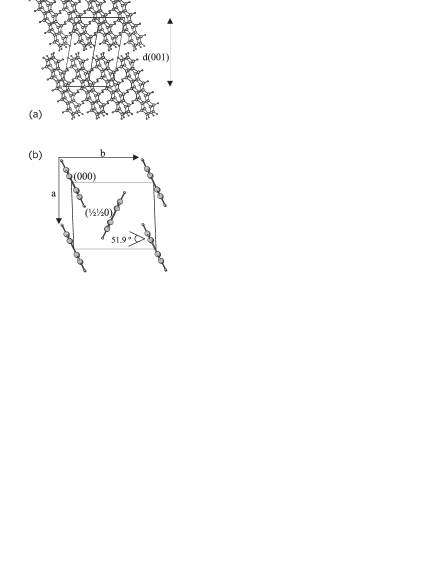
The crystal structure of bulk pentacene, depicted in Fig. 1, has been reported by several groups.[8, 9, 10] It is a layered structure, triclinic, with spacegroup . The molecular layers consist of pentacene molecules arranged in a herringbone pattern. We chose the unit vectors following Ref. [9], with a and b in the molecular plane and c inter-relating the molecular planes. The unit cell contains two inequivalent molecules. The molecules are not perpendicular to the molecular planes, but are at finite angles. This slant can be understood as a relative shift of the molecules. Starting from one molecule, moving along one arrives at an another (inequivalent) molecule, that is shifted along its longest molecular axis (LMA) by 2.13 Å, i.e. approximately the length of one ring in the pentacene molecule. Going along the shift is a mere 0.12 Å, i.e. it is negligible. This “staircase” pattern is indicated in Fig 1(b), which shows a projection of a molecular layer along the LMA.
III Technical details
The bandstructure has been calculated using density functional theory in the generalized gradient approximation (GGA).[11] The ab initio total-energy and molecular-dynamics program VASP (Vienna Ab initio Simulation Program) was used.[12, 13, 14, 15] Electron-ion interactions were described using the projector augmented wave method.[16, 17] The kinetic energy cutoff on the wave function expansion was 500 eV.
The self-consistent calculations were carried out using the experimental positions and cell (determination at 90 K from Ref. [9]) with a 442 k-point mesh.[18] Convergence was tested with a 664 mesh and found to be sufficient.
The bandstructure of the single molecular layer was calculated also from a 3D crystal, but with an extra vacuum region of 6 Å thickness inserted between the layers. Thus interactions between the layers were avoided. Moreover, the -axis was chosen perpendicular to the plane, i.e. the lattice was transformed to that of a monoclinic crystal.
IV Results
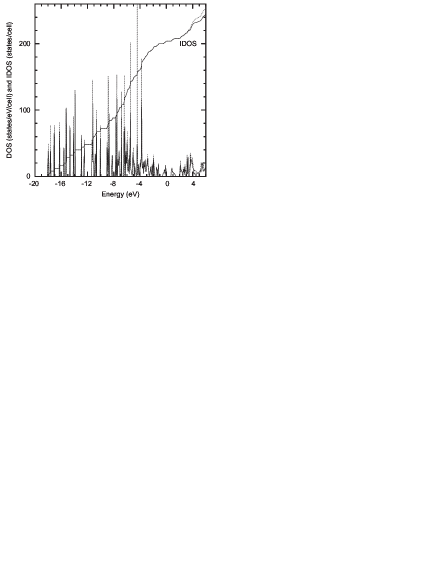
Fig. 2 displays the calculated density of states (DOS) of pentacene. All bands below the Fermi level are completely filled. The unoccupied bands are separated from the valence bands by a band gap of 0.7 eV. This is consistent with experiment, as undoped pentacene is an insulator. The experimental band gap is 2.2 eV.[19] However, an underestimation of the band gap is not unusual for GGA/DFT and, in general, doesn’t much affect the other features of the electronic structure. The DOS peak of the HOMO (just below 0 eV) and of the LUMO (at 1 eV) are both well separated from the other peaks. Each of them doesn’t mix with bands derived from other molecular states. The calculated HOMO and LUMO band widths are 600 and 700 meV respectively.
Another, recent theoretical calculation gives values of 608 and 588 meV respectively.[20] This compares well with our results, although we find a bit wider LUMO band.
Both the DOS of the single layer and of the complete 3D crystal are plotted. On the scale of the plot, differences are only apparent above 3 eV. The electronic structure of the single layer should be a good first approximation to that of the complete crystal. Its bandstructure is only 2D, which greatly facilitates the interpretation.
A Bandstructure of a Single Layer
The band structure near the Fermi level of a molecular layer is depicted in Fig. 3. Both the HOMO and the LUMO complex consist of two bands, as there are two molecules in the unit cell. For both, the maximum and minimum are at M [(,)]. Therefore, upon doping (both with electrons and with holes) the charge carriers will be created in the vicinity of this point. Their effective mass is strongly directionally dependent. In particular, note the flatness of the bands near the extrema for the direction M-Y. These observations will be further elaborated upon below.
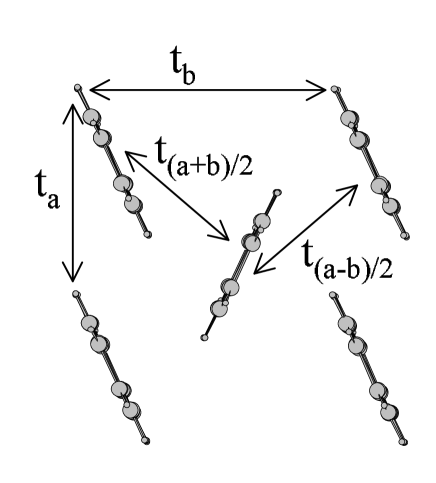
Since the band complexes are well separated from the other bands, we can attempt a tight-binding (TB) fit, for both the HOMO and the LUMO separately. The fit parameters are the transfer integrals between the molecular orbitals. Some of these are shown in Fig. 4. As we have two molecules, a matrix will have to be diagonalized:
| (1) |
Here and denote the sums of the diagonal and off-diagonal transfer integrals, multiplied with the appropriate phase factors, respectively. are the eigenvalues and accounts for the fact the the molecules are inequivalent. is required to follow the DFT result of Fig. 3 as close as possible.
As is evident from the figure, the fit follows the DFT result very well. All transfer integrals are listed in Table I. By far the most important ones are , and . For the HOMO (LUMO) the values are: = 31 (-41) meV, = -56 (-90) meV and = 91 (90) meV. All the others are very small.
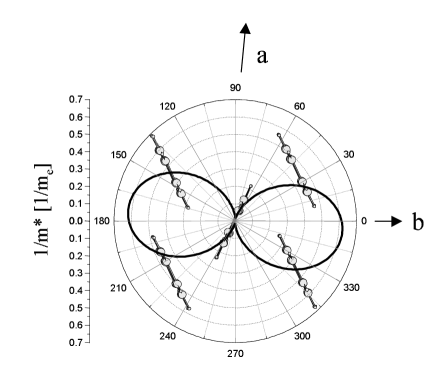
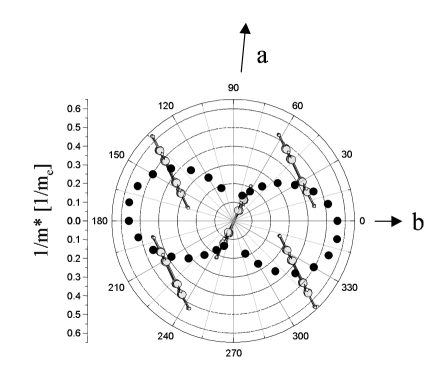
The effective mass is easily calculated with the help of the analytic expression for the fit. In Fig. 5 the hole effective mass , calculated from:
| (2) |
is plotted for all directions in the plane. Note the large anisotropy. The largest value, 58 me, occurs for the direction.
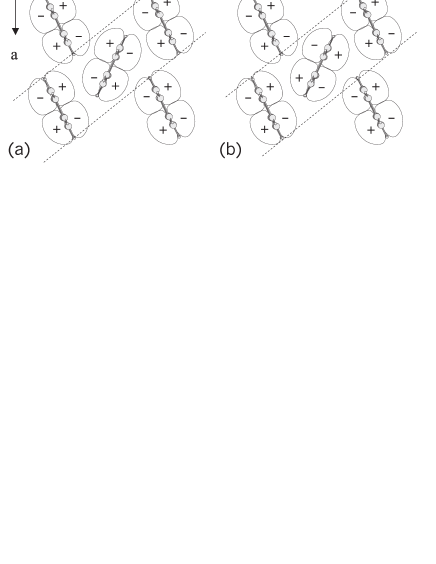
Below we’ll further discuss the band structure near the M point (i.e. the point where the valence band maximum and conduction band minimum occur) and explain the mechanism behind the large anisotropy. The molecular orbitals, HOMO and LUMO, are plotted in Fig. 6. They are both -systems, having a nodal plane coinciding with the plane of the molecule. Along the LMA the HOMO alternatingly has maxima and minima that are slightly more apart than the length of one ring-unit of the molecule. This pattern leads to 4 nodal surfaces “perpendicular” to the LMA. Additionally there’s one more nodal plane containing the LMA.
The LUMO doesn’t have such a nodal plane. It has two more nodal surfaces “perpendicular” to its LMA. Again the wave function extrema are approximately one ring-unit apart.
Fig. 7 shows a schematic representation, in a plane perpendicular to the LMA, of the HOMO-derived crystal orbitals at the M point. At M the phase of the wave function changes by 180∘, both for a translation over and . However, in Fig. 7 all 4 molecules at the corners have the same phase. This is because the staircase (slant) in the layer gives rise to a shift of the molecule at each step. This results (see the preceding paragraph) in an additional phase change of approximately 180∘.
Depending on the phase of the central molecule, either the low or high band at M is selected. In Fig. 7(b) all three important transfer integrals give a bonding contribution. Indeed, this is the most bonding eigenstate within the band complex and thus corresponds to the minimum at M. Fig. 7(a) depicts the most antibonding situation (the top of the valence band): The transfers and are maximally anti-bonding. Transfer is still bonding. Due to frustration no solution with anti-bonding overlap for all three transfers is possible.
The frustration can also explain the large anisotropy in the effective mass. Moving along ( ) two conduction channels are possible: One directly via , the other via a “double hop” [ and ]. Moving away from M, the double hop will force the bands in a downward curvature, which is counteracted by the direct channel. This explains why the band becomes flat. By contrast, moving along in reciprocal space, the channel along drops out and a cosine-shaped band results, indicative of alternate and hops.
The LUMO bands mimic the HOMO bands in a very special way: They appear as the “mirror” image of the HOMO bands on the energy axis (Fig. 3). This peculiar feature is due to the LUMO’s slightly different nodal structure (it lacks the second mirror plane containing the LMA). Therefore the top point at M has all three transfers antibonding, whereas frustration now occurs for the most bonding point at the bottom of the conduction band (where the “hop” is still antibonding). Thus the large anisotropy of the hole effective mass is “mirrored” in the electron effective mass. The analogy between the HOMO and LUMO band complex is not complete: E.g., the avoided crossing along M- only occurs for the HOMO and the total width of the LUMO complex is slightly larger than that of the HOMO complex.
B Bandstructure of the 3D Crystal
The band structure of the full 3D crystal (Fig. 8) strongly resembles that of the 2D layer. The shape of the bands for the most dispersive, and directions is essentially the same. Some differences are apparent though: (a) the top of the valence band is not at M [(,,0)], but at (0.375, 0.5, 0.075). Moreover, as is evident from the top panel of Fig. 8, the band doesn’t have a parabolic shape. The deviations are small however.
The conduction band minimum now occurs near H. (b) A small band dispersion occurs along .
Fig. 9 depicts the hole effective mass, directly calculated from the band structure using finite differences. We cannot rely on a TB fit, as it cannot capture the bump at (0.375, 0.5, 0.075). For directions close to the effective mass was not calculated, due to the locally non-parabolic nature of the band. For the other directions the picture is very similar to the 2D analogon. For we obtain: = 5.2 me.
Our results may be compared with a recent extended Hückel (EH) band structure calculation on the pentacene single crystal.[21] The agreement between the EH and our first-principles results is quite good. The EH study reports the band structure for a limited number of lines in the BZ (-X, -Y, -Z) and therefore doesn’t consider the special situation near M.
V Discussion & Conclusions
Band structure calculations for the pentacene single crystal reveal HOMO and LUMO bandwidths of 600 and 700 meV respectively. Consistently, (hole) effective masses as low as 1.7 me (for m) are found. Even (5.2 me) is rather low, in spite of the apparent flatness of the bands for the direction. Within the molecular layers a competition between different conduction paths results in a large anisotropy of both the hole and the electron effective mass, the charge carriers being orders of magnitude heavier for the (than for the direction).
Our calculations do not take into account the coupling with lattice degrees of freedom. At lower temperatures the electron-phonon coupling may renormalize the charge-carrier’s bandwidth. At higher temperatures the bandwidth renormalization and mobility reduction may differ for different directions, thus affecting the anisotropy. For anthracene, recent first-principles calculations indeed show a directionally dependent bandwidth renormalization.[22] However, as it is so pronounced, we expect much of the effective mass anisotropy to survive, also at higher temperatures, as long as coherent band-like transport is dominant.
Acknowledgments
We thank Dr. P.A. Bobbert for useful discussions and making available Ref. [22] prior to publication. This work is part of the research programme of the ’Stichting voor Fundamenteel Onderzoek der Materie (FOM)’, which is financially supported by the ’Nederlandse Organisatie voor Wetenschappelijk Onderzoek (NWO)’.
REFERENCES
- [1] S.F. Nelson, Y.-Y. Lin, D.J. Grundlach, T.N. Jackson, Appl. Phys. Lett. 72 (1998) 1854.
- [2] Y.-Y. Lin, D.J. Grundlach, S.F. Nelson, T.N. Jackson, IEEE Trans. Electron Devices 44 (1997) 1325.
- [3] W. Warta, N. Karl, Phys. Rev. B 32 (1985) 1172.
- [4] R.C. Haddon, A.S. Perel, R.C. Morris, T.T.M. Palstra, A.F. Hebard, R.M. Fleming, Appl. Phys. Lett. 67 (1995) 121.
- [5] R.A. Laudise, C. Kloc, P. Simpkins, T. Siegrist, J. Cryst. Growth 187 (1998) 449.
- [6] C.C. Mattheus, J. Baas, A. Meetsma, J.L. de Boer, C. Kloc, T. Siegrist, T.T.M. Palstra, Acta Cryst. E, accepted.
- [7] C.C. Mattheus, A.B. Dros, J. Baas, G.T. Oostergetel, A. Meetsma, J.L. de Boer, T.T.M. Palstra, Synthetic Metals, accepted.
- [8] D. Holmes, S. Kumaraswamy, A.J. Matzger, K.P.C. Vollhardt, Chem. Eur. J. 5 (1999) 3399.
- [9] C.C. Mattheus, A.B. Dros, J. Baas, A. Meetsma, J.L. de Boer, T.T.M. Palstra, Acta Cryst. C 57 (2001) 939.
- [10] T. Siegrist, Ch. Kloc, J.H. Schön, B. Batlogg, R.C. Haddon, S. Berg, G.A. Thomas, Angew. Chem., Int. Ed. 40 (2001) 1732.
- [11] J.P. Perdew, J.A. Chevary, S.H. Vosko, K.A. Jackson, M.R. Pederson, D.J. Singh, C. Fiolhais, Phys. Rev. B 46 (1992) 6671).
- [12] G. Kresse, J. Hafner, Phys. Rev. B 47 (1993) 558.
- [13] G. Kresse, J. Hafner, Phys. Rev. B 49 (1994) 14251.
- [14] G. Kresse, J. Furthmüller, Comput. Mater. Sci. 6 (1996) 15.
- [15] G. Kresse, J. Furthmüller, Phys. Rev. B 54 (1996) 11169.
- [16] P.E. Blöchl, Phys. Rev. B 50 (1994) 17953.
- [17] G. Kresse, D. Joubert, Phys. Rev. B 59 (1999) 1758.
- [18] H.J. Monkhorst, J.D. Pack, Phys. Rev. B 13 (1976) 5188.
- [19] E.A. Silinsh, Organic Molecular Crystals (1980) Springer, Berlin.
- [20] J. Cornil, D. Beljonne, J.-P. Calbert, J.-L. Brédas, Adv. Mat. 13 (2001) 1053; J. Cornil, J.-P. Calbert, J.-L. Brédas, J. Am. Chem. Soc. 123 (2001) 1250.
- [21] R.C. Haddon, X. Chi, M.E. Itkis, J.E. Anthony, D.L. Eaton, T. Siegrist, C.C. Mattheus, T.T.M. Palstra, J. Phys. Chem. B 106 (2002) 8288.
- [22] K. Hannewald, V.M. Stojanović, J.M.T. Schellekens, P.A. Bobbert, G. Kresse, J. Hafner, submitted.
| (eV) | ||
|---|---|---|