Laboratorio de Física Estadística de Sistemas Desordenados, Centro de Física, IVIC, Apartado 21827, Caracas 1020-A, Venezuela
Center for Bioinformatics, Saarland University, P.O. Box 151150, 66041 Saarbrücken, Germany
Flows in porous media Diffusion; interface formation Wetting
Dispersion of imbibition fronts
Abstract
We have studied the dispersive behaviour of imbibition fronts in a porous medium by X-ray tomography. Injection velocities were varied and the porous medium was initially prewetted or not. At low velocity in the prewetted medium, the imbibition profiles are found to be distinctly hyperdispersive. The profiles are anomalously extended when compared to tracer fronts exhibiting conventional (Gaussian) dispersion. We observe a strong velocity dependence of the exponent characterizing the divergence of the dispersion coefficient for low wetting-fluid saturation. Hyperdispersion is absent at high imbibition velocities or when the medium is not prewetted.
pacs:
47.55.Mhpacs:
68.35.Fxpacs:
68.08.BcDispersion is a process by which an initial distribution of fluid spreads out in a porous medium under the effects of the disordered nature of the porous structure and the complex flow events occurring in the pores. This process has practical relevance in the fields of hydrology (water infiltration, propagation of pollutants in soils [1]), petroleum engineering (oil recovery by water injection [2]), and biotechnology (gel and chromatographic analysis [3]).
A dispersion process can be described on the macroscopic (Darcy) scale, i.e., for an average fluid content (or saturation) defined over a “representative elementary volume” [1], by the equation
| (1) |
in which is the average velocity (or drift), the position along the flow direction, and is the dispersion coefficient. The simplest dispersion process, referred to as hydrodynamic dispersion, concerns two fluids of identical nature in which one contains “tagged” or tracer molecules. Then, is the average tracer concentration, and dispersion arises primarily from the variation in local fluid velocities (molecular diffusion is negligible for practical values of ). For homogeneous and non-consolidated porous media, the dispersion coefficient is given by , where is a length of the order of the typical pore size. Dispersion is Gaussian (i.e., is independent of ), and is a simple function of the reduced variable [4]. For many “real” porous media, however, one observes a non-Gaussian hydrodynamic dispersion: the physical mechanisms governing such anomalous behaviour are being actively investigated [5].
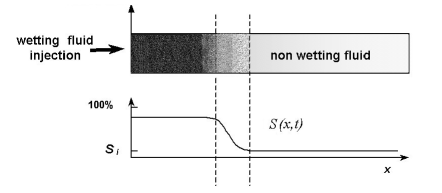
Here we are concerned with the dispersion behaviour found in imbibition: a front of wetting fluid is injected through one face of a horizontally placed porous medium. The medium is initially filled with a nonwetting fluid. Therefore, a front between wetting and nonwetting fluid forms which spreads as it advances into the porous medium, as illustrated in Figure 1.
In this case, dispersion is primarily caused by capillary forces which, depending on pore size and structure, accelerate or slow down the advance of the wetting fluid: it is usually referred to as capillary dispersion [12, 13]. Imbibition is governed by an equation similar to eq.(1) in which the convective term is replaced by , where is the (generally nonlinear) fractional flow function from which dispersion-free solutions are constructed. They are travelling waves or shocks, depending on the functional form of and the initial and boundary conditions [1, 2]. These solutions are good approximations of the true solutions when convective (viscous) forces dominate capillary forces, i.e., for high capillary numbers.
Anomalous (non-Gaussian) dispersion behaviour has been suggested theoretically to occur [6, 7] and observed experimentally [8, 9] in imbibition at low or vanishing injection velocity (‘passive’ imbibition). To characterize the evolution of the imbibition fronts a power-law divergence of the dispersion coefficient at low wetting fluid saturation is used. In the proposed models [6, 7, 12, 13] the (velocity-independent) exponent is related to the pore structure (through a fractal dimension) and to the range of the substrate-fluid interactions.
In this letter, we present and discuss a series of imbibition experiments carried out at different imposed velocities and initial wetting states of the porous medium. The experiments consist in monitoring the progression of the front of the wetting phase (water) displacing a nonwetting phase (oil) by means of an X-Ray CT-Scanner (CT = computerized tomography). From the measured water saturation profiles we are able to characterize the dispersion behaviour in a precise manner, especially at low injection velocity or capillary number, as we will show. We note that for our system, we have no a priori knowledge of either the functional dependence of nor of the dispersion coefficient and its possible dependence on wetting fluid saturation [10].
Our experiments were performed in a porous medium made of quartzitic grains with radii m, packed in a cylindrical glass column with a diameter of cm, and length cm. The porosity (or void percentage) and absolute permeability were , and m2 (or Darcy), respectively. Homogeneity was checked from X-Ray scanner measurements of the dry porous medium. The X-Ray CT-Scanner device used in this study was a fourth generation medical model FX/i, General Electric that allow very rapid measurements: less than 1 minute suffices to measure about 40 images of cross-sections of the porous medium, each cross-section being placed every cm apart. As the displaced fluid we used n-decane with 99 purity, and the (distilled) water contained a dopant (30 g/l potassium iodide) to enhance its X-Ray contrast with the oil. The displacing fluid (water) is slightly more viscous than the displaced fluid (oil), 1.03 vs. 0.89 , and their interfacial tension at the temperature of the experiments (23 ∘C) is dyn/cm. The capillary number, i.e. the ratio of viscous to capillary forces spans more than two orders of magnitude, from around 10-8 to 10-6. Here, is the imposed injection rate, and the cross-sectional area of the porous medium. The mobility ratio between the two fluid phases is favorable and one therefore expects the development of a front which is stable with respect to viscous fingering.
The procedure for our experiments in a prewetted porous medium is as follows. First the dry medium is fully saturated with water. Then, it is flooded at a high rate with an excess of oil, until no water leaves the medium. Some water cannot be displaced and remains trapped in the medium. The profile of this irreducible water measured with the CT-Scanner amounts to 25 all across the medium, except very near the outlet where it reaches 45. Such an accumulation of water is nothing but the capillary end effect. Then the experiment starts by injecting the water at an imposed flow rate . Water saturation profiles are measured at various times following the start of the injection. The are calculated from the measured data by linear interpolation with previous CT-Scan data of the porous medium fully saturated with water or oil.
For an imbibition experiment conducted at a different rate, the porous medium is again first flooded with oil (as described above) to reach the state of irreducible water saturation . Imbibition experiments in a prewetted medium were conducted at the flow rates 1, 3, 10, 30, 100, and 300 ml/hr, corresponding to superficial velocities (these velocities would correspond to those of sharp advancing fronts) which equal , and cm/hr ( ranging from to ).
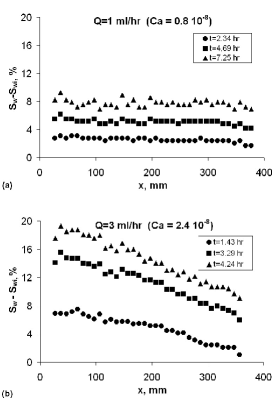
We now turn to the description of our findings. The saturation profiles corresponding to the two lowest velocities in a prewetted porous medium are shown in Figs. 2. At low injection rates (low ) the profiles increase almost uniformly throughout the entire porous medium. This behaviour qualitatively indicates the presence of a hyperdispersive imbibition process governed by a dispersion coefficient which diverges at low saturations as a power law [6, 7, 8, 9]. This behaviour is analyzed quantitatively below.
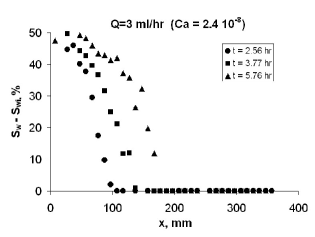
We first assess the role of prewetting on the observed hyperdispersive behaviour, which we infer from a comparison to a reference experiment in a non-prewetted porous medium. In this case, the medium was first fully saturated with oil and then the water was injected at the imposed velocity. The resulting profiles are shown in Fig. 3. The saturation front is well-defined and localized, and the signature of hyperdispersion displayed by the fronts in Fig. 2 is clearly absent.
By comparison, Figs. 4 a), b) show the saturation profiles in the medium in the prewetted medium at high velocity. With the increased velocity (i.e., larger ) the imbibition fronts sharpen and become very straight at the two highest rates ( and 300 ml/hr). Such a behaviour might be indicative of a hypodispersive behaviour, i.e. for [6, 7].
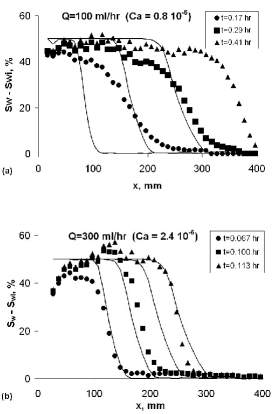
In order to further characterize the behaviour of these fronts we have conducted tracer experiments used as a probe for Gaussian (hydrodynamic) dispersion. In those tracer experiments, the water doped with the tracer molecules (30 g/l potassium iodide) was injected at a fixed rate which displaced the pure water initially fully saturating the porous medium. Then the tracer concentration profiles were measured at various successive times with the X-Ray CT-Scanner. We checked that the tracer profiles could be superimposed when expressed in terms of the reduced variable [5]. In Fig. 4(a) and (b), the data sets of the tracer fronts are superimposed with the highest flow rate imbibition fronts. Unfortunately we have too few data to quantify the capillary dispersion coefficient at low to unambiguously decide on the presence of hypodispersion in the fronts. On a longer distance (more than the 40 cm of the porous medium available to us) we expect the profiles to turn into shocks [2].
We now turn to the quantitative analysis of the saturation profiles at low flow velocities. In hyperdispersion, the dispersion coefficient diverges at low wetting phase saturation according to a power law [6, 7]. Early experiments by Bacri et al. [8, 9] had previously shown evidence for this effect in a prewetted porous medium. In their case, the data were analyzed assuming , but the acoustic technique used allowed saturation measurements only for very few positions along the porous medium.
Based on our data, we indeed find that the saturation profiles can be interpreted in terms of a power law divergence of the dispersion coefficient, however of the form
| (2) |
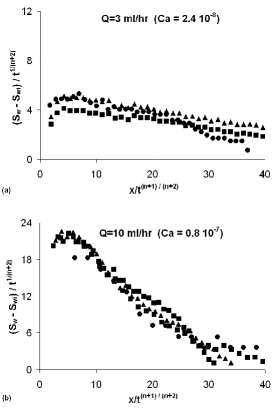
in which case eq.(1) has a self-similar scaling solution for the saturation profile for small [9, 10, 11]. Consequently, the saturation profiles superimpose when scaled by if positions are rescaled by . By using this scaling solution, we can collapse our low flow rate saturation data onto a single master curve (Fig. 5).
However, the exponent allowing the best collapse exhibits a strong dependence with the imposed flow rate: for ml/hr, and for ml/hr. For the lowest rate ml/hr, where a “giant hyperdispersivity” is found characterized by an almost homogeneous profile spanning the whole system (see Fig. 2 a), we could not determine a scaling exponent.
These results have not been anticipated theoretically. In Refs. [6, 7] it was argued that a divergence of should be related in a simple scaling fashion to the fluid-substrate molecular interactions that determine the thickness of wetting films, or to surface geometry. Our porous medium does not possess a complex (fractal) pore geometry [12, 13]; in addition, since the wetting fluid occupies about 25 of the pore space, the thickness of the wetting layers is much larger than the range (several tens of nanometers) of the fluid-substrate interactions. In our experiments it is rather capillarity that controls the distribution of the fluid in the pores space. Most of the wetting phase is in the “bulk” form of menisci and “pendular” structures, sometimes referred to as layers [15], occupying corners and substrate concavities. These wetting layers provide a continuous and conductive pathway across the porous medium, and presumably swell rather uniformly across the porous medium at low injection velocities.
A challenge for future studies is to understand how the flow events on the pore scale give rise to the observed hyperdispersive behaviour on the macroscopic (Darcy) scale. These events are complex, as they include cooperative pore invasion, flow in layers along the substrate micro-roughness, and collapse between wetting layers. A very useful tool for modeling these events is provided by pore-network models that have shed some light on various patterns and macroscopic flow parameters observed in imbibition under variation of capillary number, contact angle and wetting phase saturation [14, 15]. However, so far these models do not account for a variation in the conductance of the wetting layers (i.e., their swelling) which we believe is needed to reproduce the strong hyperdispersive effect we observe. Some progress in pore-network modeling is to be expected from the incorporation of proper swelling rules, e.g. for layers in corners [16].
To conclude, we have demonstrated experimentally, for the first time, that the presence of wetting layers is needed for hyperdispersion to occur in imbibition in a porous medium. For low wetting-phase saturation the dispersion coefficient behaves like a power-law with a velocity-dependent effective exponent. New theoretical advances are needed to account for these results which we expect can serve as a benchmark for future pore-network modeling studies.
Acknowledgements.
We are grateful to C. Fichen and C. Schlitter for their assistance in the CT-Scan measurements, and to O. Vizika and B. Noetinger for discussions. Y.M. was supported by the Post-Graduate Cooperation Program (PCP) France-Venezuela. R.B. was supported by DFG under Schwerpunktprogramm “Wetting and Structure Formation at Surfaces” (Bl-256) and the Flemish Government under Grant (VIS/97/01). We further acknowledge support under TOURNESOL grant T2000.013.References
- [1] J. Bear, Dynamics of Fluids in Porous Media, Dover, New York (1972).
- [2] L.W. Lake, Enhanced Oil Recovery, Prentice Hall, New Jersey (1989)
- [3] T. Gu, Mathematical Modeling and Scale-up of Liquid Chromatography, Springer, Berlin and New York (1995)
- [4] E. Charlaix, J.P. Hulin, and T.J. Plona, Phys. Fluids 30, 1690 (1987)
- [5] J.-C. Bacri, J.-P. Bouchaud, A. Georges, E. Guyon, J.P. Hulin, N. Rakotomalala and D. Salin, in Hydrodynamics of Dispersed Media, J.P. Hulin et al (eds.), North-Holland, Amsterdam (1990)
- [6] P.G. de Gennes, PhysicoChemical Hydrodynamics 4, 175 (1983).
- [7] P.G. de Gennes, in Physics of Disordered Materials, edited by Plenum (New York, 1985).
- [8] J.-C. Bacri, C. Leygnac, and D. Salin, J. Physique Lett. 46, L-467 (1985).
- [9] J.-C. Bacri, M. Rosen, and D. Salin, Europhys. Lett. 11, 127 (1990).
- [10] Within the standard Darcy formalism for two-phase flow in porous media, and can be expressed in terms of the capillary pressure and relative permeabilities, which are phenomenological functions of (see refs. [1, 2, 6, 7, 8, 9]).
- [11] F. Mayer, J. McGrath, and J. Steele, J. Phys. A 16, 3393 (1983).
- [12] H.T. Davis, Europhys. Lett. 8, 629 (1989); H.T. Davis, R.A. Novy, L.E. Scriven, P.G. Toledo, J. Phys. Condens. Matter 2, SA457 (1990).
- [13] P.G. Toledo, H.T. Davis, and L.E. Scriven, Transport in Porous Media 10, 81 (1993).
- [14] M. Blunt and H. Scher, Phys. Rev. E 52, 6387 (1995)
- [15] R. Hughes and M. Blunt, Transport in Porous Media 40, 295 (2000)
- [16] M.M. Weislogel and S. Lichter, J. Fluid. Mech. 373, 349 (1998)