Magneto-optics of Gd and Tb in the soft x-ray resonance regions
Abstract
We present x-ray absorption spectra around the and excitation thresholds of in-plane magnetized Gd and Tb films measured by total electron yield using circularly polarized synchrotron radiation. By matching the experimental spectra to tabulated absorption data far below and above the thresholds, the imaginary parts of the complex refractive index are determined quantitatively. The associated real parts for circularly polarized light propagating nearly parallel or antiparallel to the magnetization direction are obtained through the Kramers-Kronig relations. The derived magnetooptical parameters are used to calculate soft x-ray reflectivity spectra of a magnetized Gd film at the threshold, which are found to compare well with our experimental spectra.
pacs:
75.30.-m, 78.20.Ls, 78.70.Dm, 75.70.-iI Introduction
Magneto-optical (MO) effects in the visible-light region are widely used for analyzing magnetic materials qib00 and have important technological applications e.g., in the reading process of MO disks.MO They are based on the fact that left- and right-hand circularly polarized (CP) light is reflected with different intensities from a magnetic material depending on the local magnetization direction. Although MO effects are small in the visible-light region, sensitive detection methods yield enough contrast to distinguish bits of opposite magnetization and allow the observation of domain structures in optical microscopy.hus98 One powerful feature of MO techniques is their capability to monitor magnetization reversal processes in applied magnetic fields, which is not readily achievable with electron detection techniques due to Lorentz forces. MO techniques in the visible-light region involve optical transitions between delocalized valence states, which renders it extremely difficult to spectrally separate the magnetic contributions of different elements in compounds and in advanced layered or nanostructured materials. This can be a severe limitation in analyzing magnetic nanostructures jfg98 ; mj99 or heteromagnetic systems for information storage.MO ; prince98
Element sensitivity is naturally achieved by employing optical transitions that involve core electrons. Large magneto-optical signals in the x-ray region were theoretically predicted for resonant scattering (XRS), i.e., when the x-ray photon energy is tuned to the transition energy from a core level into a partially filled shell that contributes to an ordered magnetic moment.ers75 In fact, XRS has been used extensively to study the magnetic structure of lanthanide mgb99 and actinide mll99 materials in the hard x-ray regime.
In the soft x-ray region, large changes in the specularly reflected x-ray intensity at the edges of transition metals upon magnetization reversal have been detected khj90 ; shp98 ; wbh99 and used in element-specific studies of heteromagnetic systems.cck94 ; tonnerre95 ; tsb98 ; icf99 ; kko00 ; hkt00 ; ggj01 ; zog02
In present-day thin films and multilayers, the wavelength of soft x rays is comparable to the system dimensions (typical thicknesses range from 1 to 10 nm). It has been shown by several studies cck94 ; tsb98 ; ggj01 that in order to extract layer-resolved magnetization profiles from measured soft x-ray MO signals of layered systems, a comparison with model calculations sts00 of reflected intensities is usually required. These are based on the Fresnel equations and need accurate values of the MO constants as input.
Several experimental determinations of soft x-ray MO constants shp98 ; cic98 ; kok00 and reflection coefficients mag02 have been reported for the thresholds of ferromagnetic transition metals, but results on rare-earth elements have been scarce, in spite of the fact that these are often employed to achieve high coercive fields in magnetic layers (e.g. in spring magnets fjs98 ) or large perpendicular magnetic anisotropies.nak99 Only recently has it been demonstrated that sizeable MO signals are obtained from lanthanide elements in the soft x-ray region at the thresholds.shv01 In a further study, a huge Faraday rotation has been predicted for Gd films at the photon energy corresponding to this transition, making use of the experimentally determined difference in the refractive index for oppositely magnetized material.phk02
It is the aim of this paper to perform a quantitative determination of the MO constants for the and absorption thresholds of ferromagnetic Gd and Tb metals. Absorption spectra, calibrated by matching to tabulated data far from the resonances, provide the data basis for a determination of the imaginary parts of the refractive index. The associated real parts are obtained through a Hilbert transformation using the Kramers-Kronig (KK) relations. In this sense, the magneto-optical parameters derived in this work are quantitative; they are consistent with the tabulated values far from the resonances, but they have not been determined in an absolute way. Finally, in order to illustrate the applicability of the MO constants obtained in this way, we calculate soft x-ray reflectivity spectra of a magnetized Gd film at the thresholds and compare them with our experimental reflectivity spectra.
II Experimental
Experiments at the absorption thresholds were performed at the UE56 undulator beamline UE56 of the Berliner Elektronenspeicherring für Synchrotronstrahlung (BESSY II), while those at the thresholds were performed at the beamline ID12-B/HELIOS-I of the European Synchrotron Radiation Facility (ESRF).lah99 ; hsl99 In the UE56 experiments, the photon energy resolution was set to about (full width at half maximum), which is well below the intrinsic width of the narrow pre-edge absorption lines of Gd and Tb.sna97 By scanning the photon energy at slow speed through a synchronized movement of monochromator and undulator, an easy normalization of the spectra was made possible; this also allows one to exploit the high flux of the undulator beamline of about over a wide energy range. The degree of circular polarization at this Sasaki-type undulator beamline is 982%.UE56 The reflectivity measurements at the Gd lines were also performed at BESSY II. For the absorption measurements at the thresholds at ID12, the energy resolution was set to about 0.4 eV and the degree of circular polarization was 943%.helios
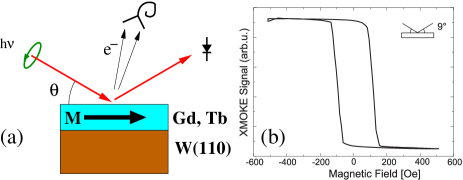
Absorption spectra were recorded in total-electron yield (TEY) mode using a high-current channeltron. To suppress the background of secondary electrons from the chamber walls, both the sample and a retarding grid placed in front of the channeltron were biased using a low-voltage battery. For signal stability, high voltage was supplied by a 3.2-kV battery box. The electron-yield current was amplified by an electrometer. TEY spectra of the thresholds were normalized to the mirror current measured in the last refocusing element of the beamline located in a separate vacuum system in front of the experimental chamber. Because it is essentially the same physical effect (secondary electron generation) that is used for the measurement of both absorption and normalization signals, possible distortions due to a lack of proportionality between TEY and absorption coefficient hsu00 in the wide photon energy range measured for the transitions are expected to be minimal. The film thicknesses were always sufficiently larger than the electron’s inelastic mean free path (IMFP) relevant for TEY measurements so that contributions of the W substrate to the TEY signal are negligible. In addition, such a contribution would be structureless in the measured photon-energy ranges and would be removed by the procedure of matching the ends of the spectra to tabulated values (see below). Reflectivity spectra were recorded in specular geometry with a photodiode mounted on a rotatable feedthrough; the diode current was measured by means of a low-noise electrometer. The experimental arrangement is shown schematically in Fig. 1.
Epitaxial Gd and Tb metal films with thicknesses ranging from 10 to 50 nm were prepared in situ by vapor deposition in ultrahigh vacuum on a W(110) single-crystal substrate. The base pressure in the chamber was in the range, rising to about during film deposition. Compared to transmission methods, which give the absorption coefficient in a more direct way, TEY detection has the advantage of allowing the use of metallic single crystals as substrates. The growth of epitaxial films on them is well characterized. In particular, controlled annealing of the deposited lanthanide films can be performed at the optimum temperatures for achieving smooth films with homogeneous thicknesses. (for details of film preparation, see Ref. sta00, ). For remanent in-plane sample magnetization, an external field was applied along the [10] direction of the substrate using a rotatable electromagnet.magnet This corresponds to the easy axis of magnetization of the Gd and Tb films. In the case of the magnetically harder Tb films, the sample was cooled from room temperature down to the measurement temperature (30 K) in an external magnetic field on the order of 0.1 T to achieve a single-domain magnetic structure with a high remanent magnetization. This has been veryfied by means of the magneto-optical Kerr effect (MOKE) in the visible-light range in the laboratory and in the soft x-ray range (XMOKE) at the beamline. As an example, Fig. 1(b) shows an element-specific hysteresis loop of a thin Gd film measured by XMOKE.
III Results and Discussion
III.1 Absorption
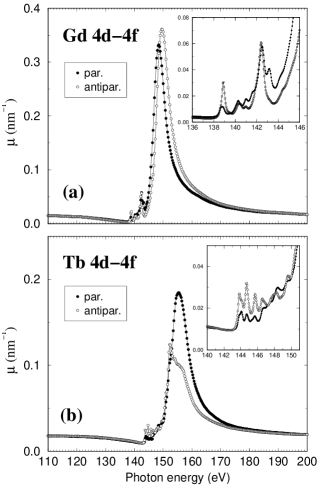
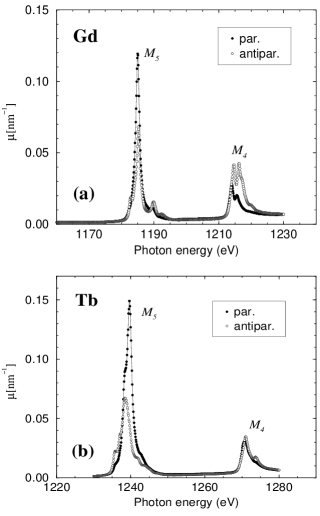
Figure 2 displays experimental absorption spectra in the region of the Gd and Tb () thresholds for nearly parallel and antiparallel orientation of the magnetization with respect to the spin of the incoming CP photons. Figure 3 shows the () absorption thresholds of both elements. The spectra have been corrected for saturation and scaled to fit the tabulated values of Henke et al.henke at the ends of the measured photon energy ranges following a procedure that is described in detail below.
The measured TEY spectra are affected by intrinsic saturation, which becomes significant when the attenuation length of the electromagnetic radiation gets comparable to , the inelastic mean free path (IMFP) of electrons in the solid.nsi99 ; vt88 In that case, the detected signal at the channeltron is no longer proportional to the absorption coefficient . Due to the large absorption cross sections at the lanthanide and thresholds, the intrinsic saturation effect is significant and the TEY spectra must be corrected for it in order to achieve a reliable quantitative estimation of the absorption coefficient. The saturation correction was made by inverting the relation vt88
| (1) |
for the measured yield . Since the constant depends on geometrical parameters of the detection system and is not precisely known, we need to determine the value of at some fixed photon energy from independent measurements. In the case of Gd , the saturation correction is based on previous results obtained from the (66) Eu/Gd(0001) surface.ask98 It consists of a quasi close-packed Eu monolayer on top of the Gd(0001) surface. Since divalent Eu has the same electronic 4 shell configuration (4) as trivalent Gd, both elements show the same multiplet structure in absorption at the thresholds. The transitions are well separated in energy. A value of (0.300.05) for the product of Gd at the threshold has been determined by comparison of the experimental peaks of Gd and Eu; for the latter, negligible saturation can be safely assumed due to the small thickness of the Eu overlayer (1 atomic layer).sahunp Furthermore, by comparing the total (energy-integrated) absorption signals of Gd and Tb and taking into account the different number of 4 holes of both elements (seven in Gd, six in Tb), we estimate a value of (0.200.05) for at the Tb threshold. A consistency argument can be applied to justify the use of the same values for the saturation correction at the thresholds: the relevant electron IMFP at the thresholds corresponds to about 150 eV kinetic energy of the Auger electrons which trigger the secondaries detected at the channeltron; it is typically 3 times smaller than at 1200 eV, according to the “universal” curve,sd79 while the values obtained for the absorption length change roughly by the same factor (see below).
The saturation-corrected absorption spectra were scaled to fit tabulated values. The photon energy ranges of the present spectra are significantly wider than those of previous studies;sna97 ; muto94 they include the wide asymmetric flanks in the case of the resonances. This allows us to calibrate the absorption spectra by matching both ends to the tabulated absorption coefficients henke at photon energies where the influence of the resonances is expected to be negligible. To this end we fixed the absorption coefficients at the low- and high-energy sides of the measured spectra to the values given by the tables of Henke et al.henke This procedure defines the ordinate scales in Figs. 2 and 3. The values for the absorption lengths determined in this way are given in Tables 1 and 2. The error bars for the quoted values have been carefully estimated. They result from an experimental precision of 1% at the considered energy and at both ends of the photon energy range, where the spectra were matched to the tabulated data. This has been determined from the scatter of the data points about their mean values. An additional contribution results from the uncertainty in the parameter used in the saturation correction (see above). A full error propagation calculation was made considering the explicit functional relation of these quantities.
| element | magnet./spin | AR | prepeak | peak |
|---|---|---|---|---|
| Gd | par. | 250 130 | 17 3 | 3.0 0.6 |
| antipar. | 360 270 | 16 3 | 2.8 0.6 | |
| Tb | par. | 105 20 | 58 12 | 5.4 1.6 |
| antipar. | 106 20 | 31 8 | 8.1 2.4 |

The absorption spectra at the thresholds display overall shapes of Fano resonances.fano61 ; zfg67 In addition, up to 10 eV below the giant resonance, small sharp prepeaks can be seen, which correspond to absorption final states reached from the respective ground states (Gd , Tb ) through violation of the selection rule.sna97 ; sta00
Note that the x-ray absorption lengths of a few nanometers at the Gd and Tb maxima are the shortest in the periodic table.henke They are accompannied by a huge magnetic contrast: the dichroic (difference) signals for Gd and Tb amount respectively to 33 and 60 % of the nonmagnetic signals, approximated by the average of the spectral pairs in Figs. 2 and 3.
The absorption cross section determined here for the Gd threshold is more than a factor of 2 higher than the calculated one for atomic Eu in Ref. pan91, . These two elements have the same 44 ground state configuration and hence the same 44 multiplet lines, but owing to the lower (screened) nuclear charge of Eu one clearly expects differences in all parameters of the giant resonance spectral profile (height, width and asymmetry). In particular the Fano parameter depends very sensitively on the radial matrix elements. Therefore a relative increase of the absorption maximum by a factor of 2 in going from Eu to Gd is not unreasonable. In fact a factor of 2 is found in other calculations. rmp89
| element | magnet./spin | betw. maxima | ||
|---|---|---|---|---|
| Gd | par. | 8.4 1.0 | 280 50 | 36 4 |
| antipar. | 14.7 1.7 | 300 50 | 27 3 | |
| Tb | par. | 6.7 1.3 | 330 100 | 33 7 |
| antipar. | 15 3 | 390 130 | 29 6 |
In the case of the lanthanide thresholds ( transitions), the matrix elements for Auger decay are reduced compared to the resonances. This causes the Fano parameter to be of the order of 100.sta00 In the limit of large , the Fano shape approaches a Lorentzian and, in fact, the absorption line shape is Lorentzian, containing hundreds of multiplet components that cluster into two main groups, the and thresholdsgtl88 (depending on whether the spin of the 3 hole state is oriented parallel or antiparallel to the = 2 orbital angular momentum). For several characteristic photon energies, the values of the absorption length, determined after the matching to tabulated data, are presented in Table 2. A quantitative determination of these values seems particularly pertinent because standard tables henke do not include the transitions, but only the steplike threshold. Our results for the absorption lengths of Gd at the peak are comparable, though somewhat larger than the magnetization-averaged value measured in transmission in Ref. vty95, . However, as stated by the authors, their absolute values might be affected by systematic errors. Note also the huge experimental magnetic contrast at , which leads to asymmetries of 40 and 57 % for Gd and Tb, respectively. Some time ago, Goedkoop et al. proposed to apply the large magnetization dependence of lanthanide absorption for constructing line filters to produce CP x rays.gft88 Furthermore, the lines are clearly separated in energy even for neighboring elements in the periodic table like Gd and Tb; this represents an advantage for element-specific studies.
III.2 Magneto-optical constants
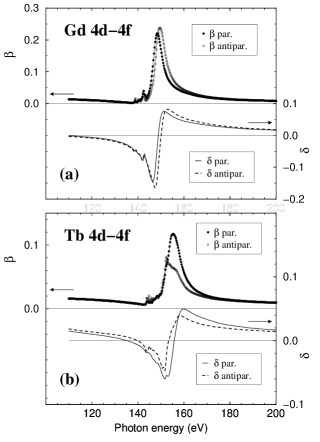
From the values obtained for the absorption coefficient we are able to calculate the magneto-optical constants, i.e., the real and imaginary parts of the complex index of refraction, defined as
| (2) |
where the and signs refer to the magnetization pointing either parallel or antiparallel to the CP photon spin vector, respectively. The imaginary part is directly related to the absorption coefficient through
| (3) |
The real parts are calculated by means of a Hilbert transformation using the KK relations. Due to the broken time reversal symmetry inside a magnetized medium, the complex refractive index satisfies the symmetry relation , and one has to apply the modified KK equations pva99
| (4) |
In order to perform these integrations over the largest possible energy range, we resumed to the tabulated values for the optical constants outside the measured regions in the entire range from 0 to 30 keV taken from the compilation of Henke et al. henke We have included the relativistic correction affecting the asymptotic behavior of the real part of the atomic scattering factor at large photon energies
| (5) |
where is the atomic number, as given by the fit of Henke et al. henke to the tabulated values of Kissel and Pratt.kissel90 The atomic scattering factor and the optical constants are related through
| (6) |
where is the classical electron radius and is the atomic density of the element.
The calculated real parts of the refractive index of Gd and Tb at the and absorption thresholds are shown in Figs. 4 and 5 for opposite orientations of the magnetization and the photon spin vector. They exhibit the well-known dispersive behavior, with tails ranging far beyond the associated imaginary parts. While the latter give the highest magnetic contrast in the absorption maxima, the real parts also provide magnetic contrast in regions where the absorption is small. This allows the performance of magnetization-dependent measurements in reflectivity in regions of different light-penetration depths, as the reflected signal is determined by both the real and the imaginary parts of the refractive index.
The exact values for can only be obtained in an ideal experiment where the magnetization direction and the photon spin are strictly colinear. Since this is not feasible for in-plane magnetized films, there is a contribution of transitions with with a weight 1/2 (Ref. goedkoop, ) to both the experimentally obtained and . This amounts to only a few percent for incidence angles up to 30∘. Contributions from the opposite magnetization, scaling as 1/2, can be safely neglected for those angles. The contribution of transitions cancels out if only the difference in the MO constants is required, as in, for example, the calculation of the Faraday effect.phk02
III.3 Reflectivity
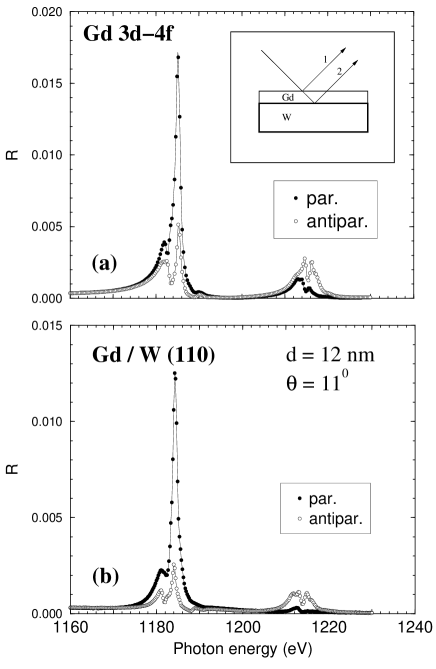
As an application of the magneto-optical constants determined in this way, we present in Fig. 6(a) calculated reflectivity spectra of a Gd film in the region of the threshold. The reflectivity was calculated using the Jones matrix formalism and the Fresnel equations for transmision and reflectivity at interfaces of magnetized media.zvk97 ; opp01 We considered interference between two channels [see insert in Fig. 6(a)]: (1) represents the reflection at the vacuum/Gd interface and (2) comprises transmission through this interface, propagation in the Gd film (which includes absorption and Faraday effect), reflection at the Gd/W(110) surface, propagation back through the film, and transmission through the Gd/vacuum interface. Higher-order paths, including multiple reflections, are found to contribute negligibly to the reflected intensity. In the calculation, we employed the MO constants for Gd at the thresholds shown in Fig. 5, together with the values for the W substrate taken from Ref. henke, .
Figure 6(b) shows the corresponding experimental reflectivity spectra of a Gd film on W(110). The nominal film thickness is 1 nm and the light incidence angle is . The experimental spectra are well reproduced by the calculation shown in Fig. 6(a), including their fine structure. The best agreement between calculated and experimental spectra was achieved by setting and in the calculation, in good agreement with the experimental values. Quantification of the experimental reflectivity R was done by normalizing using the diode signal in the direct beam. Considering the uncertainties in detector position and the simplicity of the calculation (for example, no roughness in the film was considered) the agreement of the calculated absolute intensities with the measured ones can be considered satisfactory.
In conclusion, by quantifying magnetization-dependent absorption spectra of Gd and Tb, we were able to obtain the values of the MO constants of both elements at the and excitation thresholds in the soft x-ray region. For the example of Gd , we have shown that the x-ray MO constants obtained here can serve as input for reflectivity model calculations of thin lanthanide films. In this way, our results open the possiblity to apply the power of soft x-ray reflectivity to element-specific studies of nanoscaled layered magnetic systems containing lanthanide elements.
Acknowledgements.
J. E. P. thanks the Alexander-von-Humboldt Stiftung for generous support. The authors gratefully acknowledge the experimental help of Fred Senf and Rolf Follath (BESSY), and useful discussions with Jeff Kortright and Eric Gullikson (LBNL). This work was financially supported by the German Bundesministerium für Bildung und Forschung, Contract No. 05 KS1 KEC/2.References
- (1) Z. Q. Qiu and S. D. Bader, Rev. Sci. Instrum. 71, 1243 (2000).
- (2) D. S. Bloomberg and G. A. N. Connell, in Magnetic Recording Handbook: Technology and Applications, edited by C. D. Mee and E. D. Daniel (McGraw-Hill, New York, 1990).
- (3) A. Hubert and R. Schäfer, eds., Magnetic Domains (Springer, Berlin, Heidelberg, 1998).
- (4) J. S. Jiang, E. E. Fullerton, M. Grimsditch, C. H. Sowers, and S. D. Bader, J. Appl. Phys. 83, 6238 (1998).
- (5) S. A. Majetich and Y. Jin, Science 284, 470 (1999).
- (6) G. A. Prince, Science 282, 1660 (1998).
- (7) J. L. Erskine and E. A. Stern, Phys. Rev. B 12, 5016 (1975).
- (8) D. F. McMorrow, D. Gibbs, and J. Bohr, in Handbook of Physics and Chemistry of Rare Earths, edited by K. A. Gschneidner, Jr. and L. Eyring (Elsevier, Amsterdam, 1999), vol. 26, p. 1.
- (9) D. Mannix, S. Langridge, G. H. Lander, J. Rebizant, M. J. Longfield, W. G. Stirling, W. J. Nuttall, S. Coburn, S. Wasserman, and L. Soderholm, Physica B 262, 125 (1999).
- (10) C.-C. Kao, J. B. Hastings, E. D. Johnson, D. P. Siddons, G. C. Smith, and G. A. Prince, Phys. Rev. Lett. 65, 373 (1990).
- (11) M. Sacchi, C. F. Hague, L. Pasquali, A. Mirone, J.-M. Mariot, P. Isberg, E. M. Gullikson, and J. H. Underwood, Phys. Rev. Lett. 81, 1521 (1998).
- (12) N. Weber, C. Bethke, and F. U. Hillebrecht, J. Appl. Phys. 85, 4946 (1999).
- (13) C.-C. Kao, C. T. Chen, E. D. Johnson, J. B. Hastings, H. J. Lin, G. H. Ho, G. Meigs, J. M. Brot, S. L. Hulbert, Y. U. Idzerda, and C. Vettier, Phys. Rev. B 50, 9599 (1994).
- (14) J. M. Tonnerre, L. Sève, D. Raoux, G. Soullié, B. Rodmacq, and P. Wolfers, Phys. Rev. Lett. 75, 740 (1995).
- (15) J. M. Tonnerre, L. Sève, A. Barbara-Dechelette, F. Bartolomé, D. Raoux, V. Chakarian, C. C. Kao, H. Fischer, S. Andrieu, and O. Fruchart, J. Appl. Phys. 83, 6293 (1998).
- (16) Y. U. Idzerda, V. Chakarian, and J. W. Freeland, Phys. Rev. Lett. 82, 1562 (1999).
- (17) J. B. Kortright, S.-K. Kim, and H. Ohldag, Phys. Rev. B 61, 64 (2000).
- (18) O. Hellwig, J. B. Kortright, K. Takano, and E. E. Fullerton, Phys. Rev. B 62, 11694 (2000).
- (19) J. Geissler, E. Goering, M. Justen, F. Weigand, G. Schütz, J. Langer, D. Schmitz, H. Maletta, and R. Mattheis, Phys. Rev. B 65, 020405 (2001).
- (20) O. Zaharko, P. M. Oppeneer, H. Grimmer, M. Horisberger, H.-C. Mertins, D. Abramsohn, F. Schäfers, A. Bill, and H.-B. Braun, Phys. Rev. B 66, 134406 (2002).
- (21) S. A. Stepanov and S. K. Sinha, Phys. Rev. B 61, 15302 (2000).
- (22) V. Chakarian, Y. U. Idzerda, and C. T. Chen, Phys. Rev. B 57, 5312 (1998).
- (23) J. B. Kortright and S.-K. Kim, Phys. Rev. B 62, 12216 (2000).
- (24) H.-C. Mertins, D. Abramsohn, A. Gaupp, F. Schäfers, W. Gudat, O. Zaharko, H. Grimmer, and P. M. Oppeneer, Phys. Rev. B 66, 184404 (2002).
- (25) E. E. Fullerton, J. S. Jiang, C. H. Sowers, J. E. Pearson, and S. D. Bader, Appl. Phys. Lett. 72, 380 (1998).
- (26) Y. Nakamura, J. Magn. Magn. Mater. 200, 634 (1999).
- (27) K. Starke, F. Heigl, A. Vollmer, M. Weiss, G. Reichardt, and G. Kaindl, Phys. Rev. Lett. 86, 3415 (2001).
- (28) J. E. Prieto, F. Heigl, O. Krupin, G. Kaindl, and K. Starke, Phys. Rev. B 66, 172408 (2002).
- (29) M. R. Weiss, R. Follath, K. J. S. Sawhney, F. Senf, J. Bahrdt, W. Frentrup, A. Gaupp, S. Sasaki, M. Scheer, H.-C. Mertins, D. Abramsohn, F. Schäfers, W. Kuch, and W. Mahler, Nucl. Instrum. Meth. Phys. Res. A 467, 449 (2001).
- (30) G. van der Laan, E. Arenholz, Z. Hu, A. Bauer, E. Weschke, C. Schüßler-Langeheine, E. Navas, A. Mühlig, G. Kaindl, J. B. Goedkoop, and N. B. Brookes, Phys. Rev. B 59, 8835 (1999).
- (31) Z. Hu, K. Starke, G. van der Laan, E. Navas, A. Bauer, E. Weschke, C. Schüßler-Langeheine, E. Arenholz, A. Mühlig, G. Kaindl, J. B. Goedkoop, and N. B. Brookes, Phys. Rev. B 59, 9737 (1999).
- (32) K. Starke, E. Navas, E. Arenholz, Z. Hu, L. Baumgarten, G. van der Laan, C.-T. Chen, and G. Kaindl, Phys. Rev. B 55, 2672 (1997).
- (33) M. Drescher, G. Snell, U. Kleineberg, H.-J. Stock, N. Müller, U. Heinzmann, and N. B. Brookes, Rev. Sci. Instrum. 68, 1939 (1997).
- (34) H. Henneken, F. Scholze, and G. Ulm, J. Appl. Phys. 87, 257 (2000).
- (35) K. Starke, Magnetic Dichroism in Core-Level Photoemission (Springer, Berlin, 2000).
- (36) F. Heigl, O. Krupin, G. Kaindl, and K. Starke, Rev. Sci. Instrum. 73, 369 (2002).
- (37) B. L. Henke, E. M. Gullikson, and J. C. Davis, At. Data Nucl. Data Tables 54, 180 (1993), www-cxro. lbl. gov/optical_constants.
- (38) R. Nakajima, J. Stöhr, and Y. U. Idzerda, Phys. Rev. B 59, 6421 (1999).
- (39) G. van der Laan and B. T. Thole, J. Electron Spectrosc. Relat. Phenomen. 46, 123 (1988).
- (40) E. Arenholz, K. Starke, G. Kaindl, and P. J. Jensen, Phys. Rev. Lett. 80, 2221 (1998).
- (41) K. Starke, E. Arenholz, Z. Hu, A. Bauer, G. Kaindl, and N. B. Brookes, unpublished .
- (42) M. P. Seah and W. A. Dench, Surf. Interface Anal. 1, 2 (1979).
- (43) S. Muto, S.-Y. Park, S. Imada, K. Yamaguchi, Y. Kagoshima, and T. Miyhara, J. Phys. Soc. Jpn. 63, 1179 (1994).
- (44) U. Fano, Phys. Rev. 124, 1866 (1961).
- (45) T. M. Zimkina, V. A. Fomichev, S. A. Gribivskii, and I. I. Zhukova, Fiz. Tverd. Tela (Leningrad) 9, 1147 (1967), [Sov. Phys. Solid State 9, 1128 (1967)].
- (46) C. Pan, S. L. Carter, and H. P. Kelly, Phys. Rev. A 43, 1290 (1991).
- (47) M. Richter, M. Meyer, M. Pahler, T. Prescher, E. v. Raven, B. Sonntag, and H.-E. Wetzel, Phys. Rev. A 40, 7007 (1989).
- (48) J. B. Goedkoop, B. T. Thole, G. van der Laan, G. A. Sawatzky, F. M. F. de Groot, and J. C. Fuggle, Phys. Rev. B 37, 2086 (1988).
- (49) F. C. Vicentin, S. Turchini, F. Yubero, J. Vogel, and M. Sacchi, J. Electron Spectrosc. Relat. Phenomen. 74, 187 (1995).
- (50) J. B. Goedkoop, J. C. Fuggle, B. T. Thole, G. van der Laan, and G. A. Sawatzky, Nucl. Instrum. Meth. Phys. Res. A 273, 429 (1988).
- (51) K.-E. Peiponen, E. M. Vartiainen, and T. Asakura, Dispersion, Complex Analysis and Optical Spectroscopy (Springer, Berlin, 1999).
- (52) L. Kissel and R. H. Pratt, Acta Crystallogr. Sect. A: Found. Crystallogr. 46, 170 (1990).
- (53) J. B. Goedkoop, Ph. D. thesis, Katholieke Universiteit Nijmegen (1989), unpublished.
- (54) A. K. Zvezdin and V. A. Kotov, Modern Magnetooptics and Magnetooptical Materials (Institute of Physics Publishing, Bristol, 1997).
- (55) P. M. Oppeneer, in Handbook of Magnetic Materials, edited by K. H. J. Buschow (North-Holland, Amsterdam, 2001), vol. 13, p. 229.