Modularity and Extreme Edges of the Internet
Abstract
We study the spectral properties of a diffusion process taking place on the Internet network focusing on the slowest decaying modes. These modes allow us to identify an underlying modular structure of the Internet roughly corresponding to individual countries. For instance in the slowest decaying mode the diffusion current flows from Russia towards US military sites. These two regions thus constitute the extreme edges of the Internet. Quantitatively the modular structure of the Internet manifests itself in approximately 10 times larger participation ratio of its slow decaying modes compared to the null model – a random scale-free network. We propose to use the fraction of nodes participating in slow decaying modes as a general measure of the modularity of a network. For the 100 slowest decaying modes of the Internet we measured this fraction to be around 30%. Finally we suggest, that the degree of isolation of an individual module can be assessed by comparing its participation in different diffusion modes. Using the proportionality of response as a criterion we find that the independent module approximation works well for the Internet.
pacs:
89.75.-k, 89.20.Hh, 89.75.Hc, 05.40.FbVirtually any complex system has an underlying network that defines the backbone of interactions among its components. Examples of such networks include the Internet and the World Wide Web, molecular networks of living cells, food webs in ecosystems, etc. An important question is whether nodes of such a network can be divided into smaller sub-networks (modules), which interact with each other relatively weakly Girvan2002 . Estimating the strength of inter-modular interactions, localizing crucial links connecting these modules to each other, and finding pairs of modules which are the most distant from each other is important for several reasons. First of all, it serves as a test of stability of the system with respect to breaking it up into truly isolated components. Such a break-up would be undesirable in, for example, the Internet. Creation of extra connections between the most distant modules in the network and reinforcement of crucial links is an efficient way to increase its stability. Secondly, by measuring the relative strength of inter- and intra-modular connections one directly assesses the quality of the independent module approximation, which may turn out to be important in modeling the actual dynamics of a given complex system.
In this work we explore the modular structure present in the physical layout of the Internet. To this end we study an auxiliary diffusion process taking place on this network. The slowest modes of diffusion, easily identifiable from the spectrum of its transfer matrix, allow us to detect the weakly interacting modules of the Internet. These modules turn out to roughly correspond to individual countries or for large countries to cultural or geographical regions within the country. Of course, the diffusion process studied in this work does not describe the real dynamics of the information flow over the Internet. However, the detected modular features play an important role in any local dynamical process taking place on this network including the real Internet traffic.
Analysis of spectral properties of a similar diffusion process lies at the heart of the popular search engine www.google.com google . Its variants have also been applied to social networks (the correspondence analysis) wasserman_book , random and small-world networks (the Laplace equation analysis) monasson , artificial scale-free networks, FarkasBarabasiSpectra ; GohKahngKimSpectra and the community structure of the World Wide Web Kleinberg .
In this work we explore the physical layout of the Internet on a coarse-grained level of the so-called Autonomous Systems (AS), which are large groups of routers and servers belonging to one organization such as a university or a business enterprise (e.g. an Internet Service Provider). To this end we use the January 3, 2000 dataset when the Internet consisted of 6474 Autonomous Systems exchanging information via 12572 undirected links AS . As expected for the Internet, any pair of Autonomous Systems is connected to each other by at least one path, so that topologically the network consists of just one large cluster. The diffusion process we analyze here describes the dynamics of a large number of random walkers moving on the network at discrete time steps. Statistical properties of returns to the origin of such random walks have recently been used to measure the effective dimensionality of several complex networks Bilke2002 . At each time-step every walker moves from its current node to one of the neighboring nodes along a randomly selected link. The average dynamics of this process is described by
| (1) |
where is the expectation value of the number of random walkers at site and time . The elements of the transfer matrix are equal to for neighboring nodes and and zero otherwise. Here is the connectivity (the number of immediate neighbors) of the node from which a walker steps to the node . Note that , so that the total number of walkers is conserved at all times. Eq. (1) can also be rewritten as a discrete time diffusion equation . Hence the diffusion matrix is related to the transfer matrix simply as
| (2) |
As time advances the distribution of random walkers approaches a steady state in which the diffusion current flowing from a node to a node is exactly balanced by that flowing from to . This is satisfied when the average number of walkers on every node is proportional to its connectivity .
The relaxation of any initial distribution of random walkers among nodes, , towards the steady state configuration is determined by the spectral properties of the matrix CommentSymT (or alternatively ). For instance, the steady state configuration itself is proportional to the principal eigenvector of corresponding to its largest eigenvalue , which is unique for single component networks such as the Internet. The remaining eigenvectors describe the decay of the initial configuration towards the steady state with a characteristic decay time related to the corresponding eigenvalue through . Note that in general there exist both non-oscillatory () and oscillatory () slowly decaying modes.
The modularity of a given complex network reflects itself in statistical properties of its diffusion eigenvectors . One such property is the Participation Ratio (PR), which quantifies the effective number of nodes participating in a given eigenvector with a significant weight. In the Internet the components of the principal eigenvector as well as those of other slow decaying modes are broadly distributed (scale-free) Faloustos and as such tend to be localized on just a few highly connected nodes. In this case participation ratios are best calculated using the normalized eigenvector
| (3) |
of outgoing currents flowing from node along each of its links. More formally is also the eigenvector of the transposed transfer matrix with the same eigenvalue . For such a vector normalized by the participation ratio is defined as: .
In Fig. 1 the participation ratio of eigenvectors (top) and the eigenvalue density (i.e. the spectrum of the matrix) (bottom) is plotted as a function of the corresponding eigenvalue .
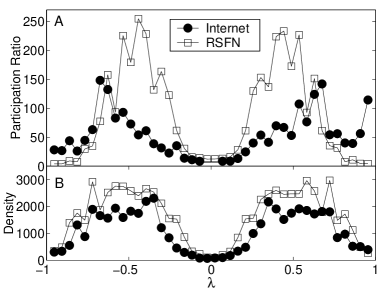
The data for the Internet (filled circles) is displayed together with the data for its randomized counterpart (open squares). The randomization of the Internet was performed in such a way that the connectivity of every node is strictly preserved maslov_sneppen_internet . It was argued maslov_sneppen_science ; maslov_sneppen_internet that such a network constitutes a proper null model of a given complex network. Since this random network has the same scale-free distribution of connectivities as the Internet Faloustos it will be referred to as a Random Scale-Free Network (RSFN).
Comparing the data for the Internet and an RSFN we note that while the density of states is rather similar in these two networks (Fig. 1 B ), the participation ratio of the slowly decaying modes (especially for the non-oscillatory ones with close to 1) is markedly higher in the Internet than in an RSFN (Fig. 1 A). In these non-oscillatory modes the diffusion current flows from relatively isolated regions (modules) along the few links connecting them to the rest of the network. If for such a module these links would be hypothetically cut one by one, the corresponding eigenvalue would gradually increase towards unity, , while the eigenvector would become more and more localized on the module. When finally the module is completely disconnected from the network the eigenvector has evolved to the steady state solution on the module, which has the participation ratio equal to its size. Thus the PR of slowly decaying eigenmodes serves as a good quantitative estimate of the size of modules in the network. In an RSFN these modules are small consisting of just a handful of nodes that accidentally happen to be loosely connected to the rest of the network. The fact that the participation ratios of slow decaying modes on the Internet significantly exceed those in an RSFN indicates that the corresponding modules are real and not accidental. The average participation ratio of slowly decaying modes can be quantified by . For this average changes only slowly in both the Internet and an RSFN and equals approximately and , respectively. A rough estimate for the number of different modules is given by the number of slowly decaying non-oscillatory states in Fig. 1 A that have a participation ratio significantly exceeding that of an RSFN. For the Internet the number is around . The sum of the participation ratios for these first 100 modes, , is a rough estimate of the total number of nodes in the modular part of the network. This should be compared to the same sum being approximately equal to in an RSFN. If one takes special care to avoid double counting nodes that appear more than once among the set of nodes with the largest taken for each eigenmode , this number gets reduced to . Thus the overall modularity of the Internet network is at least .
To determine the organizing principle behind these Internet modules in Fig. 2 we plot the outgoing current in the slowest decaying diffusion mode () as a function of the AS number (note that some AS numbers are not yet in use).
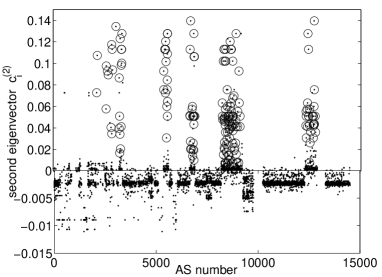
Autonomous Systems known to be located in Russia are marked with a circle. The PR for this eigenmode is , while the total number of Russian AS in our dataset is 174. In Fig. 2 one can see that almost all the Autonomous Systems that significantly participate in this mode (large positive ) are Russian. We have checked that the few exceptions to this rule are in fact Autonomous Systems closely related to Russia. Thus in the slowest decaying mode the diffusion current flows from a module that may be identified with Russia towards the rest of the Internet. Curiously enough the set of Autonomous Systems furthest away from Russia (the most negative ) are located in the US and belong to the US Military. This possible legacy of the cold war makes Russia and the US Military the extreme edges of the Internet. Performing a similar analysis for other slowly decaying modes we get a similar picture, just with other pairs of countries being pulled out. For the Internet the modules thus correspond to individual countries, or for large countries – to organizational or geographical features within the country.
It is interesting to note that these country-modules cannot be detected using the spectral analysis of the adjacency matrix of the network SpectraOfGraphs ; FarkasBarabasiSpectra ; GohKahngKimSpectra . The elements of this matrix, closely related to , are equal to 1 for a pair of neighboring nodes and 0 otherwise. The largest eigenvectors of the adjacency matrix are known to be localized primarily on the highest connected hubs and their neighbors FarkasBarabasiSpectra ; GohKahngKimSpectra . However, unlike in the case of , this undesirable localization cannot be properly eliminated simply by dividing the components of the eigenvectors by the connectivity . Hence eigenvectors of the adjacency matrix do not properly reflect the country-based modular structure uncovered in this work.
Having established that the Internet is indeed modular we now address the question of how good these individual modules are. To this end we compare different eigenmodes to each other. Although the primary feature in a slowly decaying eigenmode is the flow between a dominant pair of country-modules (such as between Russia and the US Military in ), other modules may also participate in it but to a smaller extent. This gives rise to a fine structure within slow decaying modes that is not captured by the participation ratio. The hallmark of a good module is that even though it participates in different eigenmodes to a different extent, the relative distribution of -currents within the module stays approximately the same. In other words it enters different eigenmodes as just one degree of freedom. In this case the ratio is approximately independent of the eigenmode for any pair of nodes and within the module. This is equivalent to the condition that for any two different eigenmodes and , for every node belonging to the given module. In Fig. 3 we plot the outgoing currents in the two slowest decaying non-oscillatory eigenmodes – , and – as a function of each other. Similar plots can be made for other pairs of slow decaying eigenmodes.
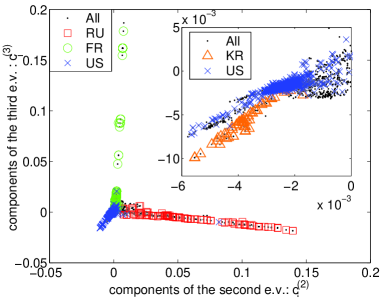
The principal feature in this kind of plot is a star like shape, where different rays of the star correspond to individual country-modules. This type of plot is more powerful in identifying individual modules than the participation ratio alone. Indeed, in Fig. 3 one can easily detect not only the most excited modules like Russia, France, and US (red squares, green circles, and blue crosses), but also less excited ones like Korea (orange triangles). We believe that the idea of measuring the quality of individual modules by how proportionally their nodes participate in different slowly decaying modes, can be easily generalized to other dynamical processes taking place on the network such as e.g. spin dynamics, vibrational modes, etc.
Finally, we would like to point out another interesting feature of Fig. 1. Both the density of states and the participation ratio are nearly symmetric around for both the Internet and an RSFN. This near symmetry indicates that both these networks are almost bipartite Comment1 , a feature also observed in citation networks, but not in metabolic networks Bilke2002 . In fact, a more detailed analysis shows that while almost every slow oscillatory mode () is related to the corresponding non-oscillatory mode with , the reverse is not true as there are roughly 30% more modes near than near . Those country-modules that are present in both the oscillatory and non-oscillatory parts of the spectrum are internally almost bipartite. The simplest bipartite graph is a tree and this seems to be the dominant structure within the Internet modules.
In summa, we have demonstrated how a diffusion process taking place on the Internet network allows one to extract information about its modules and extreme edges. For many “real-world” complex networks the local context of a node (in terms of the linkage pattern) reflects, or, perhaps, even determines the importance and function of the given node. For instance, in biology one can successfully assign putative functions to unclassified proteins based on the function of their interaction partners SchwikowskiUetz . In general the diffusion process introduced in this work can be seen as a systematic way to explore the local linkage structure of a network beyond just the nearest neighbors. The detection of the modular structure of a network is just one possible application of such a process google ; Bilke2002 .
Work at Brookhaven National Laboratory was carried out under Contract No. DE-AC02-98CH10886, Division of Material Science, U.S. Department of Energy. Two of us (K.E and K.S.) thank the Institute for Strongly Correlated and Complex Systems at Brookhaven National Laboratory for financial support during visits when part of this work was completed.
References
- (1) M. Girvan and M. E. J. Newman, Proc. Natl. Acad. Sci. USA 99, 7821-7826 (2002).
- (2) S. Brin, L. Page, “Anatomy of a Large-Scale Hypertextual Web Search Engine,” Proc. 7th International World Wide Web Conference, (1998).
- (3) S. Wasserman and K. Faust (1994). Social Network Analysis: Methods and Applications. Cambridge University Press.
- (4) R. Monasson, Eur. Phys. J. B 12, 555 (1999).
- (5) I. J. Farkas, I. Derényi, A.-L. Barabasi, and T. Vicsek, Phys. Rev. E, 64, 026704, 1-12 (2001).
- (6) K.-I. Goh, B. Kahng, and D. Kim, Phys. Rev. E 64, 051903, 1-5 (2001).
- (7) J. Kleinberg, Proc. 9th ACM-SIAM Symposium on Discrete Algorithms, 1998; D. Gibson, J. Kleinberg, P. Raghavan, Proc. 9th ACM Conference on Hypertext and Hypermedia, 1998.
- (8) The dataset collected by the Oregon Views project was downloaded from the website of the National Laboratory for Applied Network Research (http://moat.nlanr.net/AS/).
- (9) D.M. Cvetkovic, M. Doob, and H. Sachs, Spectra of Graphs, Academic Press, (1979).
- (10) S. Bilke and C. Peterson, Phys. Rev. E 64, 036106 (2001).
- (11) Even though is not symmetric, all of its eigenvalues and eigenvectors are real, since it is related by a similarity transformation to the symmetric matrix . has exactly the same set of eigenvalues as , and the corresponding eigenvectors are related to the eigenvectors of via .
- (12) M. Faloustos,P. Faloustos, and C. Faloustos, Comput. Commun. Rev. 29, 251 (1999).
- (13) S. Maslov, K. Sneppen, A. Zaliznyak, cond-mat/0205379; See also the chapter by S. Maslov, K. Sneppen, and U. Alon in the “Handbook on graphs and networks”, Eds. S. Bornholdt, H.-G. Schuster, Wiley-VCH publishers (2002).
- (14) S. Maslov and K. Sneppen, Science 296 910, (2002).
- (15) Highly degenerate zero-modes () of a matrix do not have a well defined PR. These modes are in fact rather abundant and constitute of all the eigenvalues in the Internet and in an RSFN. Zero-modes come in part from pairs of nodes of connectivity 1 interacting with the same highly connected partner. This structure is known to be overrepresented in the real Internet compared to an RSFN maslov_sneppen_internet . More generally zero-modes are localized on small substructures in the network where every second node is of low connectivity.
- (16) In fact for a bipartite network the spectrum is exactly symmetric and eigenvectors with eigenvalues are related to each other by changing sign on all nodes of one of the bipartite components.
- (17) B. Schwikowski, P. Uetz, and S. Fields, Nature Biotechnology 18, 1257-1261 (2000); S. Oliver, Nature, 403, 601 (2000).