Characterization of the Micromechanics in a Compressed Emulsion System: Force Distributions.
Jasna Brujić1, Sam F. Edwards1, Ian Hopkinson2, and Hernán A. Makse3
1 Polymers and Colloids Group, Cavendish Laboratory, University of Cambridge, Madingley Road, Cambridge CB3 0HE, UK
2 Department of Physics, UMIST, Sackville Street, Manchester M60 1QD, UK
3 Levich Institute and Physics Department, City College of New York, New York, NY 10031, US
Abstract
The micromechanics of a variety of systems experiencing a structural arrest due to their high density could be unified by a thermodynamic framework governing their approach to ’jammed’ configurations. The mechanism of supporting an applied stress through the microstructure of these highly packed materials is important in inferring the features responsible for the inhomogeneous stress transmission and testing the universality for all jammed matter. In this paper we present a novel method for measuring the force distribution within the bulk of a compressed emulsion system using confocal microscopy and explain our results with a simple theoretical model and computer simulations. We obtain an exponential distribution at large forces and a small peak at small forces, in agreement with previous experimental and simulation data for other particulate systems.
(submitted to Proc. Nat. Acad. Sci.)
1 Introduction
The concept of jamming is emerging as a fundamental feature of many systems with slow relaxation dynamics such as granular matter, complex fluids and structural glasses [1, 2, 3]. Whereas one can think of liquids or suspensions as consisting of particles which move very slowly compared to gases, there comes a point where all particles are in close contact with one another and therefore experience structural arrest. In granular systems and compressed emulsions there is no kinetic energy of consequence; the typical energy required to change the positions of the jammed particles is very large compared to the thermal energy at room temperature. As a result, the material remains arrested in a metastable state and is able to withstand an applied stress [4].
There is a growing literature studying the ”jammed” state in particulate assemblies, aiming to characterise its micromechanics [1]. It has been shown experimentally that the stresses are distributed inhomogeneously through granular materials and the features of the distribution are useful in inferring the structural elements associated with mechanisms of supporting the applied stress. In order to develop a theory to describe such closely packed particles one needs to know the geometry of the packing in the bulk, and the distribution and propagation of stress in these systems.
Several approaches have so far been employed, including 2D and 3D experimentation [5, 6], numerical simulations [7, 8, 9, 10, 11] and statistical modelling [12]. Previous experiments in 3D assemblies have been confined to measurements of the probability distribution of forces exerted at the boundaries with the container, thus reducing the dimensionality of the problem [6, 13, 14, 15, 9]. These measurements provide a quantitative understanding of the inhomogeneity of stress transmission within the bulk. However, the method does not have access to the spatial arrangement of the contact force network and other structural features, such as force chains and arching, which have been postulated as the signature of jamming [1, 11].
The salient feature of the probability distribution of interparticle contact force in jammed systems, obtained from the above methods, is an exponential decay above the mean value of the force. This feature of seems very robust, with growing evidence that it is independent of particle rigidity [7, 10], crystallinity [15], tangential forces, construction history and friction [9]. Nevertheless, there is no clear consensus on the general functional form of as there are significant discrepancies in the literature particularly regarding the behaviour at small forces, both between experimental data and the theoretical model predictions. Moreover, the possibility of a crossover to a Gaussian-like distribution has been observed at large confining pressures [8, 9, 16].
In this paper we present a novel method to measure the force distribution within a concentrated emulsion system in its jammed state, which provides the complete three-dimensional information of the contact force network and the spatial arrangement of droplets. We address this problem using confocal microscopy, which provides direct measurement of the dispersed phase morphology within the bulk of the sample. The emulsion droplets are compressed by an external pressure through centrifugation because of the density difference between the phases, and a force network develops within the system in response to the applied stress. At high volume fractions, above the random close packing regime, emulsions exhibit an elasticity which is rationalised by the storage of energy through the deformation of droplets, given in terms of their Laplace pressure [17]. The degree of deformation is used to derive an interdroplet force. The 3D imaging of a whole ensemble allows the calculation of the forces between the droplets, thus enabling the determination of . We find that the distribution is characterised by a small peak at low forces and an exponential decay at forces above the mean value, a result that can be described by the functional form of derived from the simple theoretical model we propose in this paper.
The form of the probability distribution is independent of the material of the particle provided it has well defined elastic properties. Therefore we can expect the micromechanics of an emulsion, comprised of very “soft” particles, to bear many similarities with a packing of granular materials, such as ball bearings or glass beads. Even though there have been no studies of specifically devised for compressed emulsion systems, we compare our results with the existing data for other jammed systems such as grains and foams, thus testing the hypothesis of a common behaviour for all such matter.
We use numerical simulations to examine the effect of polydispersity, osmotic pressure, and other microstructural features, such as the coordination number, on the distribution of forces. They are designed to mimic the experimental procedure on monodisperse and polydisperse distributions of soft particles. The numerical simulation result at the appropriate confining pressure is in good agreement with that obtained from the experiment, showing that the form of the force distribution is indeed independent of particle polydispersity.
Moreover, we offer in this paper what we believe is the simplest realistic theory of the force distribution, a theory which does not attempt the ambitious study of the percolation of forces [18], but has the advantage of a simple analytic solution. The theory is sufficiently crude that the reader will be able to see all sorts of ways in which it can be improved, however the simple prediction of the theory can easily be compared to experimental results and is found to describe the data well.
2 Experiment
We use a Zeiss LSM510 confocal laser scanning microscope equipped with a high numerical aperture oil-immersion objective lens with a 40 magnification. The fluorescent dye is excited with a 488nm Argon laser and the emitted light is detected using a photomultiplier behind a long-pass 505nm filter. These settings are appropriate for the excitation of Nile Red dye, used to label the emulsion described below [see Ref. [19] for more details]. The sample volume (76.376.323.6m) is typically acquired from regions 30m below the upper surface of the sample. In this work a 3D image is acquired in approximately 2 minutes.
The emulsion system constitutes of silicone oil droplets in a refractive index matching solution of water () and glycerol (), stabilised by 0.01 sodium dodecylsulphate (SDS). This system is a modification of the emulsion reported by Mason et al. [20] to produce a transparent sample suitable for confocal microscopy.
The droplet size distribution, measured by image analysis, gives a mean radius of 3.4 with a radius range between 1 and 10. This relatively narrow droplet size distribution is achieved by applying high shear rates () to a coarsely mixed parent emulsion using a Linkam shear stage [21]. To provide contrast between the phases in the microscope, the dispersed oil phase is fluorescently labelled by adding 0.1mM solution of Nile Red dye, predissolved in acetone. The emulsion system prepared in this way remains stable to coalescence for at least a year.
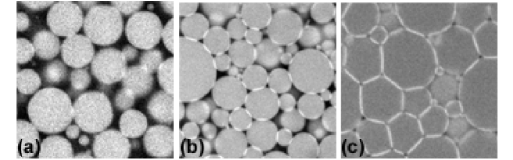
The threshold volume fraction for the onset of elasticity depends on the polydispersity of the emulsion, or in other words, the efficiency of the packing. The sequence of images in Fig. 1 shows 2D slices from the middle of the sample volume after: (a) creaming under gravity, (b) centrifugation at 6000g for 20 minutes and (c) centrifugation at 8000g for 20 minutes. The samples were left to equilibrate for several hours prior to measurements being taken. The volume fraction at the onset of droplet deformation for our polydisperse system is , determined by image analysis. This high volume fraction obtained at a relatively small osmotic pressure of 125 Pa is achieved due to the polydispersity of the sample.
Confocal imaging of the static sample revealed an effect which occurs upon emulsion compression. The areas of contact between the droplets fluoresce with a higher intensity than the undeformed perimeters on the bodies of the droplets, thus highlighting the regions of interest. Images presented in Fig. 1 illustrate this trend as the osmotic pressure is increased. This effect can be attributed to the increase in dye concentration at the regions of deformation as two droplet surfaces are pushed together to distances smaller than the resolution of the microscope. The fluorescent dye has an affinity for the surfactant so that an enhanced surfactant concentration leads to an enhanced dye concentration and thus higher fluorescence. Future work will involve a more thorough investigation of this effect.
2.1 The Force Model
The forces between the droplets are calculated from the 3D images (of size 25625664 voxels) by means of existing interdroplet force models. We extract the positions and radii of all the droplets with subvoxel accuracy using a Fourier Filtering Method (FFM) [22, 19]. The areas of contact patches shown in Fig. 1(b) are extracted based on an intensity threshold, since they are brighter than either the droplets or the aqueous background.
The determination of an accurate force model for the compression of two droplets is not trivial, but can be simplified within certain limits. For small deformations with respect to the droplet surface area, the Laplace pressure remains unchanged and all the energy of the applied stress is presumed to be stored in the deformation of the surface. Hence, at the microscopic level, two spherical droplets in contact with radii and interact with a normal force
| (1) |
This is the Princen model [17], where is the area of deformation, is the interfacial tension of the droplets and is the geometric mean of the radii of the undeformed droplets, . The normal force acts only in compression, i.e. when there is no overlap.
The above force corresponds to an energy of deformation which is quadratic in the area of deformation, analogous to a harmonic oscillator potential that describes a spring satisfying Hooke’s law. There have been several more detailed calculations [23] and numerical simulations [24] to improve on this model and allow for anharmonicity in the droplet response by also taking into consideration the number of contacts by which the droplet is confined. Typically these improved models lead to a force law for small deformations of the form , where is a coordination number dependent exponent in the range 1-1.5. Nevertheless, this work assumes the Princen model, the validity of which was tested by the summation of all the forces on a single droplet. Since the sum on each droplet could be approximated to zero we consider the method adequate.
2.2 Experimental results
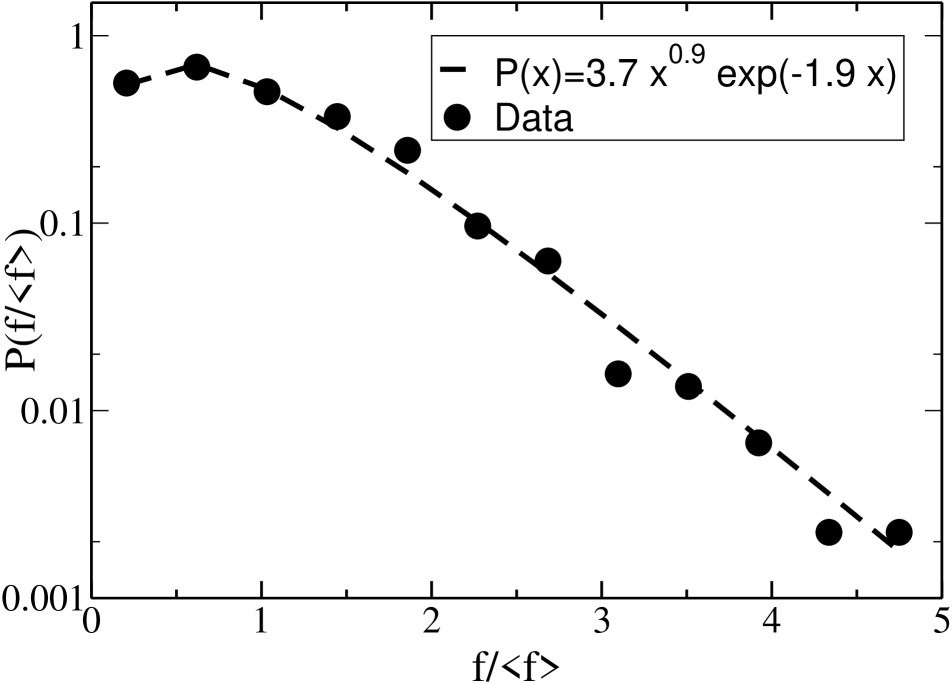
Figure 2 shows the probability distribution of interdroplet forces, , for the sample shown in Fig. 1(b). We use the Princen model (Eq. (1), N/m [20]) to obtain the interdroplet forces from the contact area data extracted from the image analysis described above.
The forces are calculated from the bright, fluorescent patches that highlight the contact areas between droplets. The radii of the droplets needed to obtain the forces according to Eq. (1) are obtained with the FFM. The distribution data shown are extracted from 1234 forces arising from 450 droplets. The data shows an exponential distribution at large forces, consistent with results of many previous experimental and simulation data on granular matter, foams, and glasses. The behaviour in the low force regime indicates a small peak, although the power law decay tending towards zero is not well pronounced. The best fit to the data gives a functional form of the distribution , consistent with the theoretical model proposed in Section 3 and the existing literature [12]. It is inappropriate to draw conclusions on the physical significance of these coefficients, since the geometry of the packing in the experiment is very different to our simple theoretical model.
Our experimental data allows us to examine the spatial distribution of the forces in the compressed emulsion, shown in Fig. 3. In this admittedly small sample volume, the forces appear to be uniformly distributed in space and do not show evidence of localisation of forces within the structure. Moreover, we find that the average stress is independent of direction, indicating isotropy. Other experiments are underway to probe the existence of force chains in compressed emulsion systems.
3 Theory
Although the experimental system consists of polydisperse particles which are deformable, in order to get a tractable theory, we simply consider spheres in multiple contact greater than or equal to four in 3-D. Even though this is a gross simplification we believe that a theory that can be carried through to an analytic solution is worthwhile. The reader is referred to more comprehensive theories such as the q-model [12] or force-splitting models [18] for more detailed analysis, which are correspondingly more difficult to solve.
By Newton’s laws, in equilibrium the sum of all the forces exerted on a particle by its nearest neighbours is zero. In three dimensions the average shape of a particle is a sphere, and the minimum co-ordination number is four [25]. Consequently the force exerted by a particle on one of its neighbours will equal the sum of the forces of the other neighbours in contact with it. To simplify we consider the scalar since it will have a very similar distribution on every grain. The distribution of the vector will differ even on adjacent grains, therefore we calculate , not . It is important to note that only those forces which are pushing on each particle are taken into account in the calculation of , a fact which will appear in the range of integration.
Our model takes into account the direction cosines of each of the forces. Excluded volume is also an important factor as particles cannot overlap and the four particle force correlation function should be included. All these effects can be crudely modelled by blurring the contribution from each of the pushing forces by a factor , which plays the role of the direction cosine and the other correlation factors.
A force balance equation which is capable of analytic solution is
| (2) |
This gives rise to an equation of the Boltzmann form:
| (3) |
It is convenient to work with the Fourier transform of the probability distribution which gives
| (4) |
which can be solved to give the normalised distribution
| (5) |
where and the proportionality constant depends on the exponent of the power law rise at low forces. More generally, if there are contacts arising from differing geometric configurations, similar calculations give
| (6) |
Note that for a large number of contacts, reaches zero very near . In Fig. 2 we see a comparison between the theoretical form and the experimental data in good agreement. There are many improvements which are essential for belief in coefficients, but the functional form, starting at zero and ending with an exponential decay, seems well founded.
4 Simulations
We perform molecular dynamics (MD) simulations to gain insight into the effects of osmotic pressure, polydispersity, and other microstructural features such as the coordination number and force chains on the probability distribution, . The numerical protocol is designed to mimic the experimental procedure used to prepare compressed emulsion systems at different osmotic pressures, described in Section 2. Our model considers an assembly of deformable spherical droplets interacting via repulsive normal forces given by the Princen model in Eq. (1). The continuous liquid phase is modeled in its simplest form, as a viscous drag force acting on every droplet, proportional to its velocity. The dynamical evolution of the droplets is obtained by solving Newton’s equation for an assembly constrained by a given osmotic pressure. Our model is similar to the Discrete Element Method (DEM) [26, 9] used in MD simulations of granular materials. However, we adjust the DEM for the system of compressed emulsions by exclusion of transversal forces (tangential elasticity and Coulomb friction) and by computation of interparticle forces using the principles of interfacial mechanics described by the Princen model instead of the Hertz model, often used in contact mechanics of solid particles ).
The simulations begin with a set of non-overlapping 2000 spherical particles located at random positions in a periodically repeated cubic cell of side . At the outset, a series of strain-controlled isotropic compressions and expansions are applied until a volume fraction slightly below the critical density of jamming is reached [9]. The system is then compressed and extended slowly until a specified value of the stress and volume fraction is achieved at static equilibrium. The distribution of forces within the static structure is calculated and then directly compared to that obtained from experiments and theory.
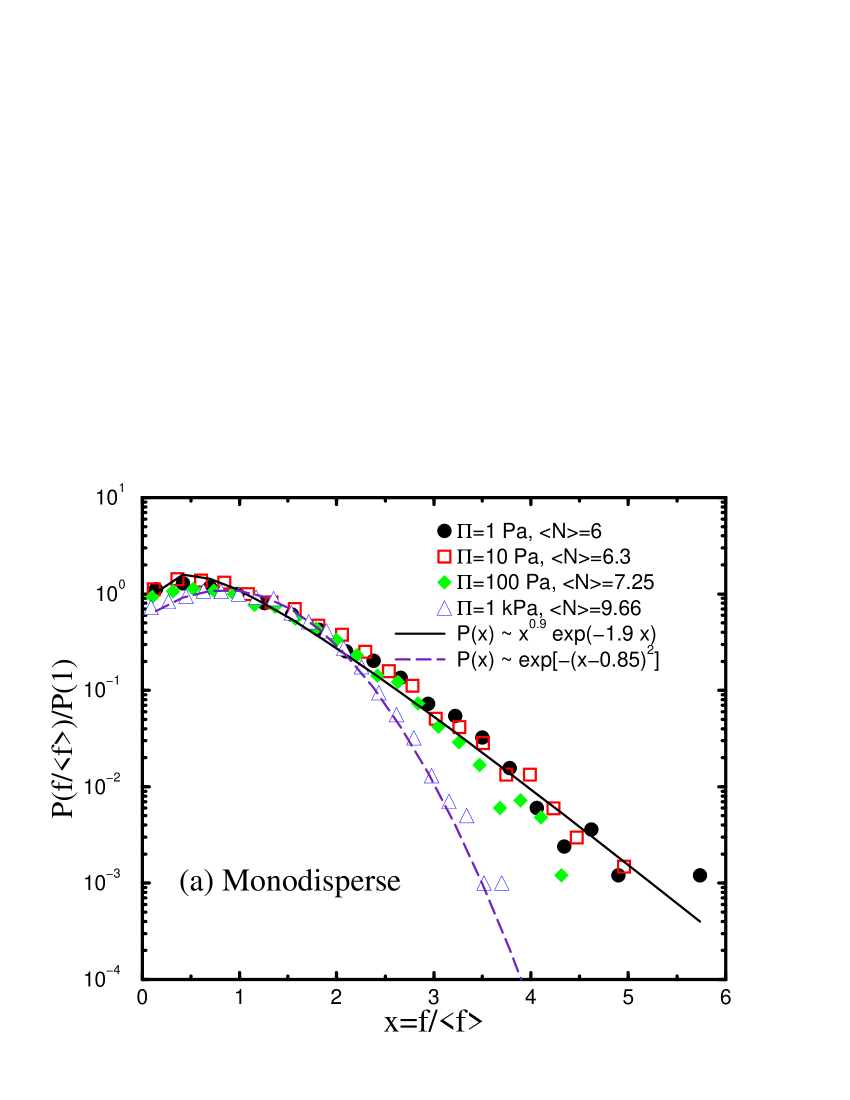
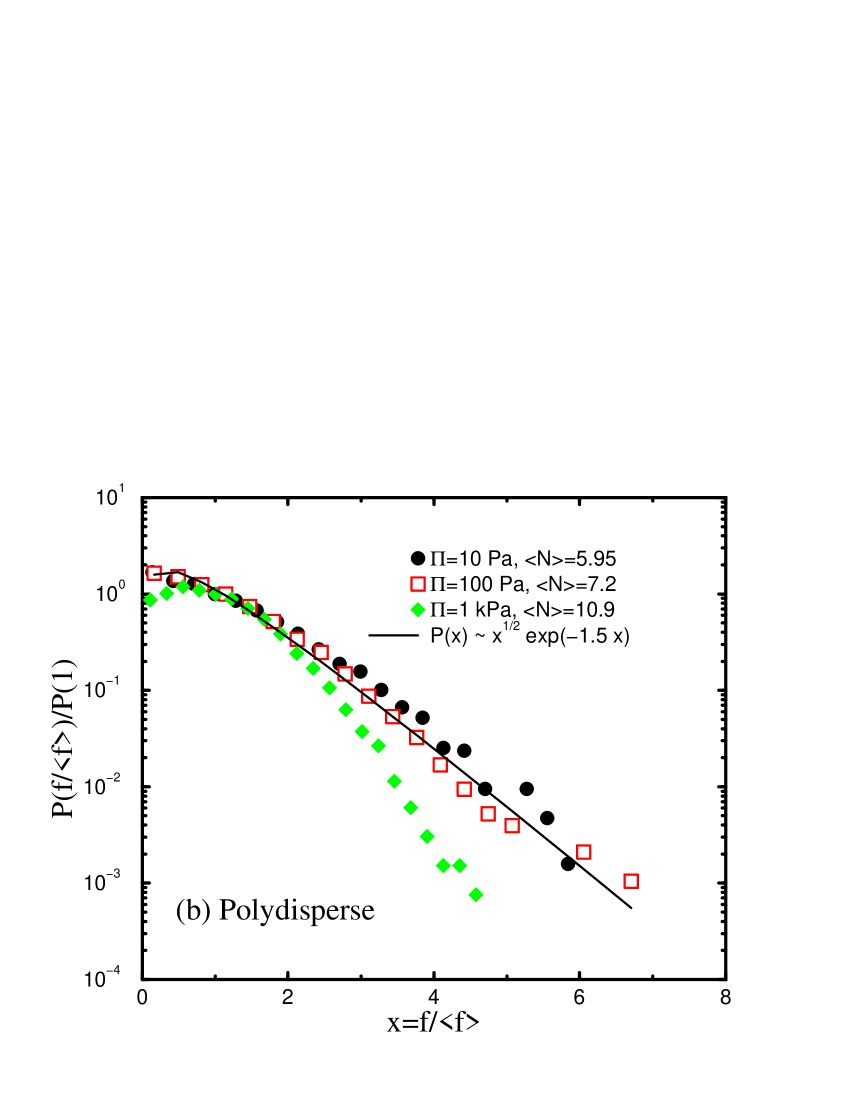
We first consider a quasi-monodisperse system composed of 1000 droplets of radius 1.05 m and 1000 droplets of radius m. Then the effect of polydispersity is investigated by consideration of the radii distribution obtained from our experiments characterized by a Gaussian distribution with a mean value m and standard deviation 1.44m, and a distribution range between 1m and m. The osmotic pressure, , is varied between 1 Pa and 1 kPa, again mimicking the experiments.
Figure 4 shows the results of the simulations. We see that the simulated data for monodisperse and polydisperse systems at low osmotic pressure agrees with the experiments and the theory. At low pressures the system is close to jamming (near RCP at ) and the average coordination number is close to its minimal value for particles interacting by normal forces only as given by constraint arguments [25, 9]. At large pressures, when the coordination number significantly departs from its minimal value, the probability distribution departs from the prediction of the theory and crosses-over to a Gaussian-like distribution in the case of the monodisperse system. In the case of the polydisperse system, the distribution at large pressures departs from the exponential decay at large forces, but its form cannot be fitted by a Gaussian-like distribution.
The numerical simulation performed under the same conditions as in the experiment yields a of the same functional form for the appropriate osmotic pressure ( Pa) and polydispersity (Fig. 4b), although the fitting coefficients obtained numerically do not correspond to those obtained experimentally. Moreover, the monodisperse system shows similar results as long as the system is at low osmotic pressure. Our results indicate that the significant feature is not the detail of the system, but its proximity to the jamming transition.
5 Discussion and Conclusions
We have presented experimental data showing the force distribution in three dimensions of a lightly compressed emulsion, close to the jamming transition. These data show an exponential distribution of interdroplet forces at large . At low , a peak in the distribution function is observed. We have fitted the experimental data with a function of the form , suggested by the simple theoretical model proposed for such a system. In addition we have carried out simulations to determine the effect of polydispersity and osmotic pressure on the force distribution function and these results are in good agreement with the experimental data. They indicate that the is not sensitive to polydispersity, however the exponential decay only fits the data well in distributions close to ’jamming’, at low confining pressures.
The theoretical model predicts a general distribution of the form , where the power law coefficient is determined by the packing geometry of the system. It is too crude a model to account for the complexity of the emulsion system, and it is therefore inappropriate to draw conclusions from direct comparisons of the coefficients obtained from theory with those arising from experimental and simulation data. Nevertheless, the agreement in the functional form for all three methods is an important result. Curiously, we observe that the fitting coefficients agree for the experimental data, the 2D theoretical model and the quasi-monodisperse emulsion system at a comparable pressure to the experiment.
In the future we hope to determine the mechanism by which the contact patches between droplets exhibit enhanced fluorescence and also to use the experimental data to test the validity of various force models for compressible droplets. In the experimental section we used the Princen model to obtain the interdroplet force from the contact area between particles. However in principle, we should be able to extract the force law from the data. This study gives supporting evidence to the universality of the concept of jamming and provides a very reliable experimental way of investigating microstructural elements within the bulk of any refractive index matched, closely packed system of an appropriate size.
We thank D. Brujić, D. Grinev, J. Bibette, M. Shattuck, A. Tolley, J. Melrose, and R. Blumenfeld for inspirational discussions. We are greatfull to the EPSRC and the Petroleum Research Fund for support of this work.
References
- [1] A. Liu and S. R. Nagel, (eds.), Jamming and Rheology: Constrained Dynamics on Microscopic Scales, Taylor & Francis, London, 2001.
- [2] S. F. Edwards and D. Grinev, Advances in Complex Systems, 2001, 4, 1.
- [3] V. Trappe, V. Prasad, L. Cipelletti, P. N. Segre and D. A. Weitz, Nature, 2001, 411, 772.
- [4] M. E. Cates, J. P. Wittmer, J. -P. Bouchaud and P. Claudin, Chaos, 1999, 9, 511.
- [5] P. Dantu, Géotechnique, 1968, 18, 50.
- [6] C. H. Liu, S. R. Nagel, D. A. Schechter, S. N. Coppersmith, S. Majumdar, O. Narayan, and T. A. Witten, Science, 1995, 269, 513.
- [7] F. Radjai, M. Jean, J. Moreau, and S. Roux, Phys. Rev. Lett., 1996, 77, 274.
- [8] C. Thornton, KONA Powder and Particle, 1997, 15, 81.
- [9] H. A. Makse, D. L. Johnson, and L. M. Schwartz, Phys. Rev. Lett., 2000, 84, 4160.
- [10] S. J. Antony, Phys. Rev. E, 2001, 63, 011302.
- [11] C. S. O’Hern, S. A. Langer, A. J. Liu, and S. R. Nagel, Phys. Rev. Lett., 2001, 86, 111.
- [12] S. N. Coppersmith, C.-H. Liu, S. Majumdar, O. Narayan and T. A. Witten, Phys. Rev. E, 1995, 53, 4673.
- [13] D. M. Mueth, H. M. Jaeger and S. R. Nagel, Phys. Rev. E, 1998, 57, 3164.
- [14] G. Lovoll, K. N. Maloy, E. G. Flekkoy, Phys. Rev. E, 1999, 57, 5872.
- [15] D. L. Blair, N. W. Mueggenburg, A. H. Marshall, H. M. Jaeger, and S. R. Nagel, Phys. Rev. E, 2001, 63, 041304.
- [16] M. G. Sexton, J. E. S. Socolar, and D. G. Schaeffer, Phys. Rev. E, 1999, 60, 1999.
- [17] H. M. Princen, J. Colloid Interface Sci., 1983, 91, 160.
- [18] J.-P. Bouchaud, P. Claudin, D. Levine, and M. Otto, Eur. J. Phys. E, 2001, 4, 451.
- [19] J. Brujić, S. F. Edwards, D. V. Grinev, I. Hopkinson, D. Brujić, and H. A. Makse, submitted to Faraday Disc. (2002).
- [20] T. G. Mason, J. Bibette, and D. A. Weitz, Phys. Rev. Lett., 1999, 75, 2051.
- [21] T. G. Mason, and J. Bibette, Langmuir, 1997, 13, 4600.
- [22] J. R. Parker, in Algorithms for Image Processing and Computer Vision, Wiley, New York, Chichester, 1997.
- [23] D. C. Morse and T. A. Witten, Europhys. Lett., 1993, 22, 549.
- [24] M-D. Lacasse, G. S. Grest, D. Levine, T. G. Mason, and D. A. Weitz, Phys. Rev. Lett., 1996, 76, 3448.
- [25] S. F. Edwards and D. V. Grinev, Phys. Rev. Lett., 1999, 82, 5397.
- [26] P. A. Cundall and O. D. L. Strack, Géotechnique, 1979, 29, 47.