Dielectric constant of glasses: first observation of a two-dimensional behavior.
Abstract
The kHz real part of the dielectric constant of a structural glass was measured at low temperature down to mK. Reducing the sample thickness to nm suppresses the usual minimum of for measuring fields MV/m. This contradicts the Two Level System (TLS) model but is well accounted for by including TLS-TLS interactions where excitations delocalize between TLS’s through a -induced mechanism recently designed: for small ’s this interaction is reduced, which explains the two-dimensional behavior of . Hence, interactions play a key role in standard thick samples.
pacs:
61.43.Fs, 77.22.Gm, 72.20.Ht, 72.20.MySince the 1970’s amorphous solids have been widely investigated at low temperature Philipps , and their properties turned out to be both ”universal” (i.e. quasi independent from the chemical composition) and strongly different from their crystalline counterparts. This is explained within the tunneling two-level system (TLS) model Anderson where some atomic species fluctuate between two neighboring energy minima separated by a potential barrier, which, at low is crossed by Tunneling.
Even if the low density of glasses (in comparison with their crystalline counterpart) may justify Lock the existence of ”voids” and thus the TLS framework, the ability of the standard TLS model, where the TLS’s do not mutually interact, to account for experiments seems very intriguing. Indeed, drawing from measurements the coupling strength of a TLS to phonons, one finds Joffrin that TLS’s are strongly coupled to each other via virtual phonons: a tunnel transition on a given TLS deforms elastically the neighboring matrix, yielding an energy change of for a TLS located at a distance , and for two neighboring TLS’s Neu one gets nm K. Similarly, since many TLS’s are charged, they interact through dipolar interaction, mediated by virtual photons, yielding an interaction energy Neu in the same range of K between neighboring TLS’s. This large energy scale contrasts with the weakness of the rare experimental evidences of TLS’s interactions: in the mK range, only small instationarities Carruzzo , and unexpected small effects Strehlow , on the kHz dielectric susceptibility have been related to interactions. In the few mK range, somewhat larger effects, such as the ultra-low- plateau Enss in the dielectric constant, and the internal friction behavior Thompson , were explained with interactions.
This work yields strong evidence of the key role of TLS’s interactions in the mK range. Indeed, we show that reducing the thickness of glassy samples down to nm strongly affects the real part of the kHz dielectric constant: the minimum, which occurs at a given for nm, is progressively moved to lower as is decreased, and finally disappears for nm. This new behavior contradicts the non interacting TLS model and evidences the role of TLS’s interactions, since the latter are strongly reduced at small ’s, as we shall see. Within the spectrum of theories dealing with interactions in the TLS model, ranging from the one stating that interactions are renormalized to zero by frustration Coppersmith , to the one assuming that interactions supersede disorder Wurger , the mechanism proposed by Burin et al. Burin will prove to account for the reported data, once included in numerical simulations of LecochecNL .
The samples were all produced similarly: on a vitreous -SiO2 mm thick substrate, a Cu/glass/Cu/glass structure was deposited, by using a multi chamber system excluding exposure to air during the whole process LecochecH . The nm thick Cu electrodes were evaporated (nm/s), while the glass layers were made from TetraEthylOrthoSilane with a MHz vapor plasma where the autopolarisation was set at V, the incoming flux at sccm, and the pressure at Pa. The resulting glass deposition rate was nm/s, allowing to set the thickness of the internal glass layer by choosing the deposition time. Since the value is crucial, it was further measured by three other methods which all gave compatible results: i) in situ laser interferometry was realized onto a Si substrate placed close to the sample during the glass deposition; ii) the glass layer (the one grown onto the Si substrate) was irradiated by a deuton MeV beam allowing, through the nuclear reaction on 16O, an estimate; iii) the value of the capacitance was checked to scale with the expected . The nm thick top glass layer hinders any spurious atmospheric effect during the cryogenic experiment. The sample was glued inside a copper box connected to the mixing chamber of the 3He/4He dilution refrigerator. Semi-rigid coaxial shielding was ensured from the cold copper box up to the -Andeen capacitance bridge. A capacitance , twice larger than that of the sample, was set in parallel of each cable, so as to filter high frequency parasitic fields: the data were unchanged when was halved, proving the filtering efficiency.
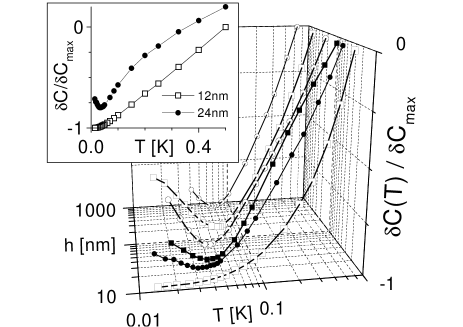
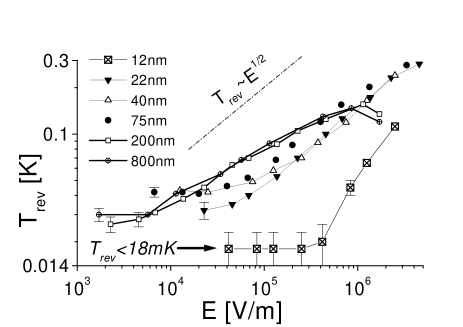
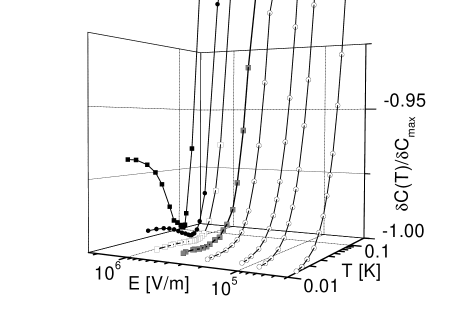
The behavior of six samples, whose ranges from nm to nm, are reported in Figs. 1-3, where K and K while is the minimum value of in our experimental range mK K. Fig. 1 shows that, for a given measuring field kV/m, the temperature , where is minimum, gradually moves towards lower values as is decreased. For the thinnest sample, the minimum is suppressed at kV/m, and instead of the usual valid for thicker samples (as well as for all previously studied glasses Rogge ), one gets where turns from above mK to below. Fig. 2 shows first that this trend of lowering when decreasing holds for all (except for the very few cases MV/m where some heating arises, see below); and secondly that this decrease only occurs for nm since the nm and nm samples behave similarly. Last, Fig. 3 shows, for the smallest , that a minimum of is recovered when MV/m, and that the value of the slope below is weakened beside that of thick samples.
These new trends for are intrinsic to the glassy state, as we shall see by showing that they come neither from a heating effect, nor from a variation of the glass composition with :
i) the -induced dissipated power might heat the sample to a temperature above the measured . Since the thermal conductances decrease as decreases, heating, at a given , increases at low , i.e. it is expected to stretch the curve by an amount increasing as is lowered. Thus, one might wonder whether the data of Figs 1-2 are due to heating or not. This explanation is ruled out since, with the parallel resistance of the sample, one has , i.e. increases with at a given . Thus, if the data of Figs. 1-2 were mainly due to heating, would decrease for thick samples, at odds with Fig. 1. In fact, heating effects are clearly visible only for the two thickest samples and for the strongest : is slightly lower at MV/m than at MV/m. Assuming that, above the linear regime, i.e. when is high enough to yield a increase, the law is obeyed (see below), one can extract the thermal resistance from the difference, increasing with , between this law and the measured . From the two thickest samples one gets MK/W at mK, with a behavior, as expected for boundary Kapitza resistances.
ii) Besides, one may imagine that the data of Figs. 1-3 come from the fact that the glass composition depends on , even for a given set of plasma parameters: due to a possible mixing of the plasma incoming particules and of the Cu of the first electrode, one may argue that the samples contain a ”boundary” layer, of thickness , whose chemical composition strongly differs of the rest of the glass (of thickness ). Since the value of slightly depends on the glass composition Rogge , one may wonder whether this could explain the reported data. This is not the case. First because the dependence of is totally new for nm: , clearly differs from the usual behavior holding both for our thicker samples and for all the previously studied samples Rogge whatever their chemical composition. Secondly, this scenario leads to add the admittances of the two consecutive dielectrics, with the of the boundary layer given by the nm thick sample, and that of the second dielectric by the nm samples. Applying this method for the nm thick sample, at kV/m, one finds first that is halved in comparison with thick samples, as observed on Fig. 2; and secondly that should be dominated by far by the behavior, which is clearly contradicted by Fig. 1 where the trend holds for the nm thick sample.
At this step, it is clear that decreasing qualitatively changes the physics of the glass sample. This contradicts the standard (i.e. non interacting) TLS model which accounts for the decrease of above by the progressive freezing of the diagonal (or relaxationnal) part of the susceptibility, while the increase below comes from the off-diagonal (or resonnant) part : due to its pure quantum nature, grows when decreases, as do all quantum effects. Within this framework, the TLS’s interactions are assumed to be so small that they only enter in the phase coherence time setting the scale over which relaxes towards its thermodynamic value. Since decreasing reduces TLS’s interactions (see below), one expects qualitatively larger in thin samples, reinforcing somehow , which is at odds with Figs.1-2. Quantitatively, in usual thick samples s in the mK range, i.e. its value is so large that the associated quantum energy is as low as K, much smaller than any relevant energy scale, which explains that does basically not depend on . Thus, no effect can be explained within the standard TLS model.
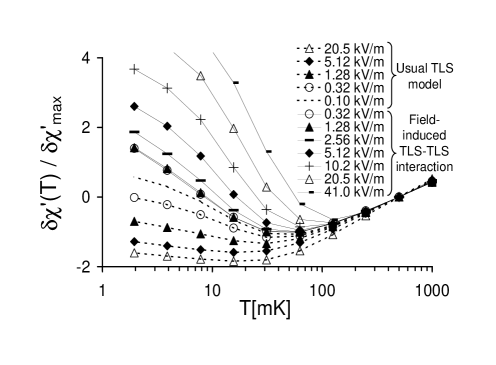
Besides, another serious limit of the standard TLS model, discovered very recently LecochecNL , is that it does not account for the nonlinear usually reported (such as those of our nm samples and those of Ref. Rogge ). Indeed, due to the quantum nature of below , is strongly depressed by a strong measuring electric field at a given . This is due to the quantum saturation phenomenon coming from the fact that increasing decreases the population difference between the two energy levels: as the Rabi oscillations produced by on the upper level are in phase opposition with respect to those produced on the ground level, the quantum response, once averaged on many independent TLS’s, tends to zero when is increased. This was checked by solving numerically the Bloch equations of TLS’s LecochecNL with a non perturbative method (see the dotted lines in Fig. 4).
Both the nonlinear measurements as well as the effect on can be accounted for by using the same -induced TLS-TLS interaction proposed by Burin et al. Burin where thermal excitations, which are at zero-field localized on each TLS, tend to delocalize by hopping to resonant nearest neighbors. This is due to the fact that resonant hopping demands that both TLS’s should have approximately the same asymmetry energy and the same tunneling energy : as the electrical field modulates the TLS parameter , the probability of finding, for a given TLS, a resonant TLS, increases from a negligible value at very low , to a non-negligible value above at higher . Since this mechanism transports energy, it mainly enhances the diagonal part of the susceptibility (by decreasing the associated relaxation time ), and since it gets stronger as decreases it yields the trend shown in Fig. 4 by the solid curves: in this picture, mainly comes from which dominates, at any , over the off diagonal part (the latter being still depressed by the values used in experiments). With , see Ref. LecochecNL , Neu , Burin’s mechanism is essential at low , and is responsible for the increase below when becomes smaller than unity, with the frequency of . This yields , as seen on Fig. 2.
In this picture, effects on are due to the two mechanisms reducing TLS’s interactions at small ’s. First, due to the usual density of states Philipps , if is the maximum energy separating the gaps of two interacting TLS’s, they are separated by the distance only while . For thin samples , the decrease of available TLS’s yields and enlarges , reducing TLS’s interactions . This applies both to the elastic part of where Neu one has , and to the dipolar part of where Burin’s mechanism states with D the TLS dipole and the glass dielectric constant Carruzzo , Rogge . Secondly, dipolar interactions are further note reduced by the screening effect in the electrodes: if their numerous electrons intercept and cancel the electric field yielding the interaction between TLS’s, which sharply decreases .
Finally, for one gets mK, not far from the range where the effects occur in Figs 1-2. Whatever or , the order of magnitude of is near nm for thick samples: this is consistent with the thickness where the effects occur in Figs. 1-2. Since TLS’s interactions bring about the behavior, their suppression at small ’s should yield a curve given by the standard non interacting TLS model: as shown by the dotted lines in Fig. 4, this amounts to suppressing the minimum, as in Fig. 1 for nm, due to the -induced strong depression of for the kV/m experimental fields.
Besides, due to the -induced modulation of , in Burin et al.’s scenario decreases at strong , opening the possibility to recover a case at strong : this would account for Fig. 3 where, even for nm, one recovers a minimum for .
In conclusion, decreasing the thickness of glass samples down to the nm range changes the physics of the real part of the kHz dielectric susceptibility. This strongly evidences the key role of TLS’s interactions up to mK. Assuming that TLS’s interactions occur via a -induced delocalisation of excitations between quasi similar TLS’s accounts for the main features of the reported data.
Many thanks to M. Ocio and E. Vincent for lending us their cryostat and to L. Le Pape for experimental support. A special thank to J.-Y. Prieur and J. Joffrin (CNRS, Orsay) for the really encouraging scientific discussions we had, and to D.L’Hôte for experimental help.
References
- (1) W. A. Philipps, Rep. Prog. Phys 50, 1657 (1987); Amorphous Solids, W. A. Philipps editor (Springer, Berlin, 1981).
- (2) P. W. Anderson, B. I. Halperin, and C. M. Varma, Phil. Mag. 25, 1 (1972); W.A. Phillips, J. Low Temp. Phys. 7, 351 (1972).
- (3) A. J. Lock, T. M. Creemers, and S. Völker, J. Chem. Phys. 110, 7467 (1999).
- (4) J. Joffrin and A. Levelut, J. Phys (Paris) 36, 811 (1976).
- (5) P. Neu, D. R. Reichman, and R. J. Silbey, Phys. Rev. B 56, 5250 (1997).
- (6) H. M. Carruzzo, E. R. Grannan, and C. C. Yu, Phys. Rev. B 50, 6685 (1994).
- (7) P. Strehlow et al., Phys. Rev. Lett. 84, 1938 (2000).
- (8) C. Enss and S. Hunklinger, Phys. Rev. Lett. 79, 2831 (1997).
- (9) E. Thompson et al., Phys. Rev. Lett. 84, 4601 (2000).
- (10) S. N. Coppersmith, Phys. Rev. Lett. 67, 2315 (1991).
- (11) A. Wurger, Physica B 263, 253 (1999).
- (12) A. L. Burin, Y. Kagan, and I. Ya. Polishchuk, Phys. Rev. Lett. 86, 5616 (2001).
- (13) J. Le Cochec and F. Ladieu, cond-mat/0206230 v2, 24 Sept 2002; submitted to Eur. Phys. Journ. B.
- (14) J. Le Cochec, F. Ladieu, and P. Pari, Phys. Rev. B. 66, 64203 (2002); cond-mat/0203564, 27 Mar 2002.
- (15) S. Rogge et al., Phys. Rev. B 55, 11256 (1997).
- (16) B. E. White and R. O. Pohl, Physica B 219-220, 267 (1996).
- (17) If screening is the major reason of the decrease of , one could explain why no effect was seen, in the nm range, in an internal kHz friction experiment White : electrodes do not exist in that case.