55Mn NMR Study of the Field-Controlled Magnetic Phase Separation in (La0.25Pr0.75)0.7Ca0.3MnO3 with Different Oxygen Isotope Content
Abstract
An influence of the 16O-18O isotope substitutions on magnetic state of perovskite-type manganite (La0.25Pr0.75)0.7Ca0.3MnO3 is studied by 55Mn NMR. Successive cycling with an isochronal exposure at different magnetic fields up to is used to study the field-induced transition from antiferromagnetic insulating (AFI) state to the ferromagnetic metal (FMM) one in the 18O-enriched sample. After exposure at the NMR spectrum of the 18O-sample evidences for magnetic phase separation (PS) resulted in the coexisting AFI and FMM domains. Further increase of exposing field leads to a progressive growth of the FMM phase at the expense of AFI domains. Its relative fraction can be controlled by external magnetic field and the resulting magnetic structure in the PS region is discussed. Anomalous dependence of the 55Mn nuclear spin-lattice relaxation rate is revealed in the FMM state of both 16O- and 18O-enriched samples. The manifestation of the Pr magnetic ordering at is considered.
I Introduction
Perovskite-type manganites R1-xMxMnO3 (R = La, Pr is trivalent rare-earth ion) are subjected to extensive studies after observation of a colossal negative magnetoresistance (CMR) effect for . The CMR effect relates in physics close to phase transition from the charge ordered antiferromagnetic insulating (CO AFI) state to the ferromagnetic metal (FMM) one Coey . Thermal hysteresis revealed in transport and magnetic properties of these compounds evidences the first order transition accompanied by the phase separation (PS) into CO AFI and FMM domains Nagaev . An ionic state of Mn determines unambiguously its spin configuration, substantial polaronic effects Khomskii and Jahn-Teller type lattice distortions Zhou in sublattice of the MnO6 octahedra and defines in many respects the microstructure of magnetic state in a low temperature phase.
The (LayPr1-y)0.7Ca0.3MnO3 manganite is one of the most convenient systems for studying the PS phenomenon. Recently Babushkina_N391 ; Babushkina_PRB60 it was shown that the ground state of electron system becomes extremely unstable at and even the isotopic substitution of 16O by 18O influences significantly the transport and magnetic properties of this compound. On cooling down in zero external magnetic field (ZFC), the (La0.25Pr0.75)0.7Ca0.3MnO3 sample with 16O isotope (referred below as LPCMO16 ) shows the successive transitions to the CO state at , to the AF state below and finally to the FMM one below . On the other hand, the 18O-enriched sample (LPCMO18) remains in the AFI state down to the very low temperature under ZFC conditions. However, this AFI ground state is extremely unstable and can be easily transformed to the FMM one with the same saturation magnetization as in the LPCMO16 by applying external magnetic field above the critical value .
The detailed magnetic phase diagram of LPCMO18 in a wide range of and has been reported as result of magnetization studies A.Y&K.K . The AFI-FMM phase composition in the PS region above is shown to be controlled by magnetic field. Any prescribed ratio of AFI to FMM phases can be obtained in the PS region and might be frozen by decrease of the magnetic field below the critical value . The new phase composition depends on neither time nor magnetic field variations below . The microscopic evidence of the phase transition from AFI to FMM state in LPCMO18 was obtained from 139La NMR studies at A.Y&K.K . Two well-resolved 139La NMR lines corresponding to AFI and FMM domains were clearly observed and their relative intensities determine directly the fraction of the both phases in the PS region.
However, 139La NMR spectra are not informative in concern to the short-range CO of the Mn ions in the AFI phase. Indeed the local magnetic field probed by the 139La is mainly due to the overlap of La(6s) and Mn() orbitals and the contribution of holes located at the -orbital of Mn3+ ions is greatly reduced in the insulating state Yoshinari . Thus the position of the 139La NMR signal in the AFI state is not sensitive to the difference of the Mn4+(d3)/Mn3+(d4) valence state of the nearest Mn ions. In sharp contrast, one may expect that 55Mn NMR study allows to obtain more detailed information about the charge and magnetic states of Mn ions in the AFI phase.
In this paper, we present the results of the 55Mn NMR studies of the field-controlled PS in (La0.25Pr0.75)0.7Ca0.3MnO3 with different oxygen isotope content to get better insight in the microstructure of the AFI ground state. The temperature dependence of nuclear spin-lattice relaxation rate is studied in the FMM state with special care to find the microscopic evidence for magnetic ordering of Pr ions.
II EXPERIMENTAL
The ceramic sample preparation and isotope enrichment procedures were described in detail elsewhere Babushkina_N391 . The NMR measurements were performed with a home-built pulse phase-coherent NMR spectrometer operated in frequency range up to using spin-echo technique. The NMR spectra were obtained by measuring at each frequency an intensity of the Hahn spin-echo signal. The width of a rf-pulses does not exceed . The amplitude of the exciting rf-pulses was optimized for the maximum of echo signal in measuring each individual line in the NMR spectrum. Any variations of the receiver gain including rf-coupling with resonant circuit were taken into account in measurement of the line intensity using an additional calibration rf-pulse with fixed amplitude formed in the rf-coil after echo-signal at each frequency point. The original probe-head designed for 55Mn NMR allowed to measure spectra in the range of using a single rf-coil. The 55Mn NMR spectrum measurements were performed in zero magnetic field (ZFNMR) and in external magnetic field up to at . The field-cycling (fc) procedure was performed as follows: after ZFC the external magnetic field was increased up to and was kept fixed for about to exclude the transition effects. Then the magnetic field was switched off and ZFNMR spectrum was measured.
III RESULTS AND DISCUSSIONS
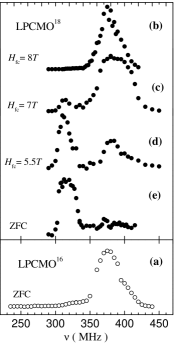
Figure 1(a) shows the 55Mn ZFNMR spectra in the FMM state in LPCMO16 after ZFC. It presents a single line peaked near . The line shows a strong rf-enhancement which is typical for ordered FM. On the other hand, in the AFI state of the LPCMO18 sample after ZFC, the observed spectrum is quite different, as shown in Fig.1(e). The main peak is observed around where a large rf-power is needed for the signal detection in contrast to the signals from the FMM state, while the small peak around with a large rf-enhancement is also detected. Besides the rf-enhancement factors the other characteristics of NMR signals for these two peaks are also completely different. Nuclear spin-spin relaxation time and nuclear spin-lattice relaxation time at the main peak are much shorter than the corresponding and observed at the small one. These short relaxation times are typical for AFI state in manganites Allodi_PRL81 . Thus we attribute the peak around to 55 Mn NMR in the FMM phase while that around is assigned to the AFI phase.
Figures 1(b,c,d) show the -dependence of the 55Mn spectrum measured with the field cycling method described above. As shown in the figures, with increasing , the peak around originated from the AFI phase gradually disappears, while a relative intensity of the peak around (FMM phase) grows up. Finally, the spectrum in the LPCMO18 after the exposing to (Fig. 1(b)) becomes very similar to that in the FMM state of the LPCMO16, Fig.1(a). From the comparison of FMM signal intensities between the virgin (ZFC) and the final (exposing to ) states the minor FMM phase in the virgin LPCMO16 sample can be estimated at most a few percent. It s worth mentioning that only intensities not the resonance frequencies of the peaks changed during this field cycling procedure, which proves that only concentrations of the two defined magnetic phases were changed.
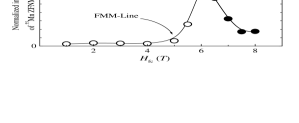
The amount of AFI or FMM phases is proportional to intensity of the corresponding ZFNMR line measured at after subsequent field cycling at different . The relative intensities of the AFI() or FMM() lines normalized to their maximum are shown in Fig.2 for the virgin (ZFC) LPCMO18. With increase of the amount of AFI domains increases slightly below , then starts to decrease nearly to zero at . On the other hand, the amount of FMM domains increases strongly above and saturates at . In the region between and , the AFI and FMM domains coexist in LPCMO18, indicating the microscopically inhomogeneous magnetic phase separation. These 55Mn-NMR results provide a microscopic confirmation of the inhomogeneous PS in LPCMO18 in the region where a detailed balance of the volume fractions of the AFI and the FMM phases can be controlled by external magnetic field. The present results are consistent with magnetic phase diagram obtained by magnetization measurements and 139La NMR studies A.Y&K.K .
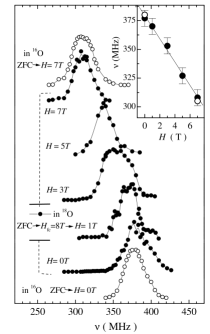
In order to shed light on more details of the electronic and magnetic states of Mn ions in FMM phase, we have investigated the external magnetic field dependence of the 55Mn NMR spectra. Fig.3 shows the -dependences of 55Mn NMR spectrum measured in LPCMO16 at (open circles) and of the spectrum for saturated FMM LPCMO18 corresponding to Fig.1(b). With increase of the peak frequencies for both samples shift to lower frequency according to the relation as shown in the inset of Fig.3. This value is in agreement with the gyromagnetic ratio of 55Mn nucleus within our experimental accuracy. As the hyperfine field at the Mn sites is mainly originated from the core-polarization contribution, its direction is opposite to that of the Mn spin moment. This result suggests that all the Mn spin moments in the FMM state aligned along the direction without any canting. is proportional to , where is hyperfine coupling constant and is spin moment. Combining the experimental value of , A.Freeman and the magnetization data measured in the same sample LPCMO16, the average magnetic moment on the Mn site is estimated as . This value suggests that the valence of Mn ions in the FMM state can be given to Mn3.6+ in high spin states in ionic approximation; namely some averaged value between Mn4+ (S=3/2) and Mn3+ (S=2). This in turn suggests that the electronic state of 0.6 electrons on the -orbitals in FMM state must be responsible for metallic conductivity. It should be pointed out that the observation of only one component of the Mn NMR spectrum in the FMM state indicates that the inverse of the life-time of the electron spins is higher than the NMR frequency (in the exchange narrowing limit between Mn4+ (S=3/2) and Mn3+ (S=2)).
On the other hand, for the CO AFI phase, we would expect two 55Mn NMR signals from Mn4+ (S=3/2) and Mn3+ (S=2) ions, because electrons of Mn3+ are expected to localize in the AFI state. However, we observed only one signal around corresponding to . The magnetic moment of the Mn ions in the AFI state is suggested to be smaller than that of the Mn3.6+ ions in the FMM state. Furthermore, the value of is well consistent with a theoretical estimation T.Kubo of the on-site hyperfine magnetic field for the Mn4+ ion in crystal field of octahedron symmetry (Mn. Hence, thus this signal can be assigned to Mn4+ ions in the CO AFI phase.
As for the NMR signals from Mn3+ ions in the CO AFI state, we have not succeeded to find them in the frequency range of even with the shortest available delay time () between rf-pulses. This might be due to a much shorter for Mn3+ ions compared to for Mn4+ ions in the CO AFI state. A similar negative result was obtained in the 55Mn NMR spin-echo studies of the CO AFI state of La0.5Ca0.5MnO3 Allodi_PRL81 and Pr0.5Sr0.5MnO3 Allodi_PRB61 .
Finally we consider peculiarities of the 55Mn nuclear spin-lattice relaxation rate probing the fluctuations of local magnetic fields in the FMM ordered state of LPCMO16 (ZFC) and LPCMO18 ( FC at ) samples. The -measurements were performed in magnetic fields using the saturation-recovery method. The recovery of nuclear magnetization of 55Mn (I=5/2) to its thermal equilibrium value after the applied saturating comb of pulses is given by Narath_PR162
| (1) |
The expression (1) was used for fitting the obtained data.
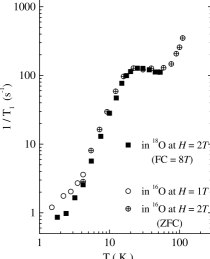
The -dependence of for both ZFC LPCMO16 (circles) and LPCMO18 (solid squares) samples cooled down at is presented in Fig.4. It s seen, that in the FMM state the temperature behavior of is similar for both samples. With increasing , increases strongly up to , have a plateau in the range of , and increases again on approaching the transition from the FMM to the AFI state at . This finding clearly indicates that low frequency fluctuating parts of the local magnetic fields at the Mn sites in the FMM state are not noticeably influenced by oxygen isotope substitution.
As expected at elevated temperatures near the critical enhancement of magnetic fluctuations at the Larmor frequency of 55Mn nuclei is responsible for a rather strong growth of . On the other hand, behavior at low temperature is quite different compared to the exponential rise Allodi_PRL81 ; Savosta_PRB59 observed for several FM manganites with concentration of mobile holes covering the CMR region of coexisting FM order and metallic conductivity. Similar hump in the temperature dependence of was also revealed in measurements of the 139La nuclear spin-lattice rate performed below for the FM line of 139La of the LPCMO18 sample FC at Furukawa . It is instructive to note that in ferromagnetic metals the dominating spin-wave contribution to via the two-magnon scattering process should lead to the power-law dependence with ranging from 2.5 to 1.5 with an increase of the magnon damping Irkhin_PRB60 .
These observations imply the unique source of fluctuating magnetic fields which contributes to nuclear spin-lattice rate of 139La and 55Mn in FMM state of (La0.25Pr0.75)0.7Ca0.3MnO3. We incline to conclude that the anomalous -behavior observed at low temperature is originated from the fluctuating local magnetic field transferred from Pr whose spin fluctuations should be increased greatly near the temperature of the Pr magnetic ordering. Indeed the temperature range of for the observed plateau of includes itself the Curie temperature for Pr magnetic ordering as followed from the magnetic phase diagram A.Y&K.K and neutron diffraction studies Balagurov_PRB60 reported for (La0.25Pr0.75)0.7Ca0.3MnO3 with the very same chemical composition. To our knowledge, the present results represents the first NMR evidence of the Pr magnetic ordering. An absence of divergent-like behavior of and rather large width of the plateau indicate that magnetic order of Pr occurs as in spin-glass materials. It s quite natural since the atomic disorder in the Pr/La sublattice should provide a rather large distribution of the exchange parameters between the localized electron spins of Pr.
In conclusion, the 55Mn NMR spectra of (La0.25Pr0.75)0.7Ca0.3MnO3 show at a microscopic level that the AF order among Mn ions in the LPCMO18 sample at low temperatures is a metastable magnetic state. After cycling of external magnetic field above the field- induced phase transition develops through the nucleation of the FMM phase at the expense of AFI domains. An upper boundary of the AFI-FMM phase separation region is established in the field- cycle NMR experiments and equals to at . The 55Mn NMR spectrum of the LPCMO18 sample cooled in the higher magnetic field shows that its magnetic state is just the same as for LPCMO16, i.e. a long-range FMM. Finally, it s proposed that transferred magnetic coupling between the Mn and Pr spins should be involved into consideration of the unusual low temperature phase diagram of this manganite.
Acknowledgements.
This study was supported in part by a Grant-in-Aid for scientific research of the Ministry of Education, Culture, Sports, Science and Technology of Japan (A.G.), by Russian Fund for Basic Research under Projects No 99-02-16975, 02-02-16357 and by CRDF Grant RP2-2355-MO-02.References
- (1) J. M. D. Coey, M.Viret , von S. Molnar Adv. Phys. 48, 167 (1999).
- (2) E.L.Nagaev, Usp. Fiz. Nauk. 166, 833 (1996).
- (3) T. Mizokawa, D.I. Khomskii and G.A. Zawatzky, Phys. Rev. B 63, 024403 (2001).
- (4) J.S. Zhou, J.B. Goodenough, Phys. Rev.B 60. 15002 (1999).
- (5) N.A. Babushkina et al., Nature 391, 159 (1998).
- (6) N.A. Babushkina et.all., Phys. Rev. B 60, 383 (1999).
- (7) A. Yakubovskii, K. Kumagai, Y. Furukawa, N. Babushkina, A.Taldenkov, A. Kaul , and O. Gorbenko, Phys. Rev. B 62, 5337 (2000).
- (8) Y. Yoshinari, P. Hammel, J. Tompson and S. Cheong, Phys. Rev. B 60, 9275 (1999).
- (9) G. Allodi, R. De Renzi, G. Guidi, F. Licci and M. Pieper, Phys. Rev. B 56, 6036 (1997), Phys. Rev. Lett. 81, 4736 (1998).
- (10) A.J. Freeman and R.E. Watson, in Magnetism, ed. G.T Rado and H. Suhl (Academic Press, New York) 1965.
- (11) T. Kubo et.al., Phys. Soc. Jpn. 21, 812 (1966).
- (12) G. Allodi, R. De Renzi, M. Solzi, K. Kamenev, G. Balakrishnan and M.W. Pieper, Phys. Rev. B 61, 5924 (2000).
- (13) A. Narath, Phys. Rev. 162, 320 (1967).
- (14) M.M. Savosta, V.A. Borodin, P. Novak, Phys. Rev. B 59, 8778 (1999).
- (15) Y.Furukawa, unpublished result.
- (16) V.Yu. Irkhin and M.I. Katsnelson, Phys. Rev. B 60, 14569 (1999).
- (17) N.A. Balagurov, V.Yu. Pomjakushin, D.V. Sheptyakov et al., Phys. Rev. B 60, 383 (1999).