Magnetic Interactions and Transport in (Ga,Cr)As
Abstract
The magnetic, transport, and structural properties of (Ga,Cr)As are reported. Zincblende Ga1-xCrxAs was grown by low-temperature molecular beam epitaxy (MBE). At low concentrations, x0.1, the materials exhibit unusual magnetic properties associated with the random magnetism of the alloy. At low temperatures the magnetization M(B) increases rapidly with increasing field due to the alignment of ferromagnetic units (polarons or clusters) having large dipole moments of order 10-102. A standard model of superparamagnetism is inadequate for describing both the field and temperature dependence of the magnetization M(B,T). In order to explain M(B) at low temperatures we employ a distributed magnetic moment (DMM) model in which polarons or clusters of ions have a distribution of moments. It is also found that the magnetic susceptibility increases for decreasing temperature but saturates below T=4 K. The inverse susceptibility follows a linear-T Curie-Weiss law and extrapolates to a magnetic transition temperature =10 K. In magnetotransport measurements, a room temperature resistivity of =0.1 cm and a hole concentration of 1020 cm-3 are found, indicating that Cr can also act as a acceptor similar to Mn. The resistivity increases rapidly for decreasing temperature below room temperature, and becomes strongly insulating at low temperatures. The conductivity follows exp[ (T1/T)1/2 ] over a large range of conductivity, possible evidence of tunneling between polarons or clusters.
pacs:
75.50.Pp, 73.61.Ey, 72.15.RnI Introduction
Utilizing the spin property of electrons is expected to add another dimension to conventional electronics which relies only on the charge property of electrons. The emerging field of spin electronics Prinz (1998); Wolf et al. (2001); Awschalom et al. (2002) has been ushered in by the promise of several spin-transport devices. These include: (i) sensitive magnetic field sensors useful for reading magnetically stored information, based on the giant magnetoresistance (GMR) effect;Grunberg et al. (1986); Baibich et al. (1988) (ii) spin-valves based on the magnetic tunnel junction (MTJ); Moodera et al. (1995); Miyazaki and Tezuka (1995) (iii) the spin field effect transistor (spin-FET); Datta and Das (1990) and (iv) magnetic random access memories (MRAM) utilizing GMR or MTJ.
Even prior to these spin devices, there has been considerable research aimed at synthesizing new ferromagnetic materials which are compatible with conventional semiconductors and semiconductor processing. Magnetic semiconductors have been actively researched for nearly half a century, beginning with europium chalcoginides (e.g. EuX, X=S, Se, Te).von Molnar and Methfessel (1967); Nagaev (1983) This was followed in the 1980’s by II-VI diluted magnetic semiconductors (e.g. (Cd,Mn)Te, (Zn,Mn)Se),Furdyna and Kossut (1988); Dietl (1994) then recently III-V ferromagnetic semiconductors (e.g. (In,Mn)As and (Ga,Mn)As).Munekata et al. (1989); Ohno (1998); Matsukura et al. (2002) Although Ga1-xMnxAs possesses robust ferromagnetism for manganese concentrations near x=0.05, it is only ferromagnetic below Tc110.Ohno et al. (1996); De Boeck et al. (1996); Ohno (1998) More recently there have been reports of higher temperature ferromagnetic semiconductors, including hexaborides (Ca,La)B6,Young et al. (1999) phosphides (Cd,Mn,Ge)P2,Medvedkin et al. (2000) oxides (Ti,Co)O2Matsumoto et al. (2001) and (Zn,V,Co)O,Ueda et al. (2001) nitrides (Ga,Mn)N,Reed et al. (2001); Sasaki et al. (2002) and antimonides (Ga,Mn)Sb,Chen et al. (2002). In addition, using chromium points to high transition temperatures in III-V materialsZhao et al. (2001); Yamada et al. (2002) and II-VI materials.Saito et al. (2002) Furthermore, calculations indicate strong ferromagnetism in (Ga,Cr)As,van Schilfgaarde and Mryasov (2001) and the zincblende forms of CrAs,Akinaga et al. (2000) and MnAs.Sanvito and Hill (2000)
GaAs doped with Cr was the focus of research a decade ago because the addition of Cr makes GaAs semi-insulating for use in electronic applications,Blakemore (1982) Similar to Fe doping, Cr in GaAs acts as a deep acceptor which compensates native donors making the material highly resistive. GaAs:Cr also possesses photoconduction,Clerjaud (1985) the photorefractive effect,Imbert et al. (1988) and optically induced change in the Cr valence stateWhite et al. (1980). The magnetic properties of (Ga,Cr)As alloys containing substantial concentrations of Cr are now being explored. This stems from the ability to grow GaAs with transition metals using low temperature molecular beam epitaxy (MBE).Ohno et al. (1996) The first study of (Ga,Cr)As alloys revealed superparamagnetic behavior for x=0.03.Saito et al. (2001) Results have also been reported for (Ga,Cr)As with x=0.11, Yamada et al. (2002) and CrAsMizuguchi et al. (2002). The present study is aimed at investigating the properties of Ga1-xCrxAs with a Cr concentration of x=0.10.
Magnetic, transport, and structural studies were carried out on samples of Ga1-xCrxAs with x=0.1 grown by low temperature MBE. Magnetic properties were investigated using a superconducting quantum interference device (SQUID) magnetometer in magnetic fields up to 5 T and temperatures T=2 to 300 K. The magnetization M(B) at low temperatures increases much faster for increasing B than expected for single magnetic ions. This behavior is evidence of ferromagnetic coupling between magnetic ions. However, there are many features which cannot be explained by a simple model of para- or superparamagnetism: (1) the low field magnetization is nonlinear in B (field dependent susceptibility); (2) the magnetization deviates strongly from 1/T behavior at low temperatures; and (3) the magnetization requires a cluster model having a wide distribution of cluster or polaron magnetic moments. Although all of the magnetic characteristics cannot be explained by a single model, some features can be described by a distributed magnetic moment (DMM) model having a large distribution of magnteic moments.
Transport measurements show mild conductivity at room temperature where 0.1 cm, and strong insulating behavior at low temperatures. Near room temperature, the conductivity is activated and Hall measurements yield a hole concentration 1020 cm-3. This indicates that Cr also acts as a deep acceptor similar to shallower Mn. It is remarkable that the conductivity follows exp[ (T1/T)1/2 ] over 8 orders of magnitude change in , implying a hopping mechanism at lower temperatures. X-ray diffraction scans exhibit a zincblende structure having a larger lattice constant than GaAs.
II Experimental Conditions
(Ga,Cr)As layers were grown on epiready (100)-oriented GaAs substrates by low temperature MBE using solid source elements. Effusion cell temperatures were 980 C for Ga, 275 C for As, and 940 C for Cr. The Cr-to-Ga flux ratio was monitored by a quartz crystal thickness monitor, and the As-to-Ga flux ratio was set to approximately 15 by monitoring the flux with a nude ion gauge. After thermally removing the surface oxide from the substrate at 630 C for 10-20 minutes in As flux, a 100 nm thick layer of a high temperature GaAs was grown at 580 C, followed by a 100 nm layer of low temperature GaAs grown at 220 C, then the 200 nm thick layer (Ga,Cr)As was deposited at 220 C at a rate of 0.1 nm/s. Chromium has higher diffusion than Mn in GaAs, requiring lower substrate temperatures around 180-220 C instead of 250 C typically used to grow (Ga,Mn)As. Cr concentrations were determined by Auger electron spectroscopy and x-ray photoelectron spectroscopy (XPS). Magnetization measurements were performed in a variable temperature 5 T superconducting quantum interference device (SQUID) magnetometer. Plots of the magnetization data were obtained after subtracting the diamagnetism of the substrate, which was =-(2.19)x10-7 emu/gG. Four-wire conductivity measurements were made on a standard Hall bar geometry sample, approximately 49 mm in size, placed in a closed cycle cryostat operating between T=4 and 300 K. Because of the high sample resistivity at low temperatures, the DC current was measured while holding the voltage at 1 V. Hall measurements were made in the cryostat which was placed in a cryogen-free 14 T superconducting magnet having a 52 mm diameter room temperature bore.
III Results and Discussion
III.1 Field-dependent and Temperature-dependent Magnetization

The field dependence of the magnetization, M(B), is shown in Fig. 1 for temperatures ranging from T=2 to 30 K and fields up to B=5 T. At low temperatures M(B) approaches saturation after several tesla. The increase of M(B) in Fig. 1 for increasing B is much faster than a paramagnetic response. The dashed curve is a Brillouin function for T=2 K, representing the response of single (S=2, g=2) ions. At low fields, the experimental data for T=2 K is many times larger than the Brillouin function. From this data it is possible to rule out a majority paramagnetism, but it is difficult to tell whether M(B) is attributed to ferromagnetic or to superparamagnetic response. The additional magnetism at low fields suggests that the field is aligning groups of magnetic ions rather than single ions. This behavior is clear evidence of ferromagnetic interaction between Cr ion moments. The interaction couples many ions into ferromagnetic groups of ions having a large dipole moment which is many times that of a single ion. Groups of ions in so-called superparamagnets are typically much smaller in size than domains in ferromagnets and lack their domain wall effects. The magnetization of individual superparamagnetic blocks have a Langevin function response, L(B/kT). It was found that the present M(B/T) data at various temperatures do not scale with B/T. This behavior was also observed in a sample with x=0.03 for which M was plotted as a function of B/T, and the M(B/T) data at various temperatures did not reduce to a single curve.Saito et al. (2001) We conclude that the behavior of M(B,T) is not that of a simple paramagnet or superparamagnet.
Near B=5 T, the average magnetic dipole moment per ion is found to be p=/=1.4. This is a factor of 2 to 3 smaller than expected if all the ions are aligned. In that case, p=3 or 4, for Cr3+(S=3/2, g=2) or Cr2+(S=2, g=2), respectively. The remainder of the magnetization presumably requires much higher fields to saturate. The Cr ions giving rise to the missing magnetization probably exist in a second phase. Although the RHEED and x-ray diffraction results did not show any appreciable crystal phases other than the zincblende structure, second phases cannot be ruled out. Another possibility is that those ions have a different electronic structure resulting in neither paramagnetic nor ferromagnetic response to the applied field. Other reported magnetic measurements of (Ga,Cr)As also find reduced values of p. Values range from p=2.7 for x=0.009,Okazawa et al. (2001) to p=2.1 for x=0.034,Saito et al. (2001) and p=1.0 for x=0.11 Yamada et al. (2002). This trend of decreasing p for increasing x has been observed for a range of x up to x=0.065, where it appears that the moment falls off approximately as p 1/x.Okazawa et al. (2001)
Finally, we note that the present samples do not show hysteresis in the M(B) measurements for temperatures down to T=1.9 K for either orientation of the magnetic field. This contrasts with a previous study of an x=0.11 sample which showed temperature dependent hysteresis.Yamada et al. (2002) In that study the remanent field decreased with increasing temperature leading to a transition temperature of Tc40 K. Those measurements also contained an unexplained temperature independent remanence which was the same magnitude as the temperature dependent remanence.
III.2 Modeling of M(B)
The M(B) dependence has a unique behavior and cannot be fit to any simple function.
Two models are considered here for M(B):
(i) bound magnetic polaron (BMP) model;
(ii) distributed magnetic moment (DMM) model.
In a BMP one itinerant carrier (electron or hole) is bound to a charged center
and there are a number of magnetic ions within the
carrier’s orbit.Wolff (1988); Heiman et al. (1983) Because the carrier’s orbit size
is predetermined in donors and acceptors, the number of ions (n) in each BMP
is about the same for each BMP. This makes the magnetic dipole moment of all BMPs
equal, except for statistical differences amounting to . The sp-d exchange
interaction between the carrier and magnetic ions creates a ferromagentic bubble.
We propose a DMM model which is similar to the BMP model.
The main difference is that the clusters or polarons can contain more than one carrier, and they
have a broad distribution in size and hence a broad distribution in dipole moment.
In addition, the carriers need not be localized by charged centers fixed
to the lattice – the carriers can be localized in groups by Anderson-type disorder.
Also because of the high density of DMMs, they can be magnetically coupled to one another
or even form a percolating network. Coupled BMPs have been discussed previously
for II-VI diluted magnetic semiconductors.Durst et al. (2002)
Both the BMP and DMM models have a superparamagnetic-like M(B) response, in which blocks of ferromagnetically coupled ion spins with large dipole moments align in the field. Generally, BMPs and DMMs are soft ferromagnets which do not possess remanence and coercive fields giving rise to hysteresis. On the other hand, ferromagnetic domains are characteristically different because of their interesting and important domain wall effects. Other than that, the magnetism exhibited by these differ primarily in the scale or size of the discrete magnetic blocks. In all three cases, the field dependence of the total magnetization usually takes place in two physically distinct steps: (i) the total moment of individual blocks align in a field even though each block may not be fully saturated at a finite temperature; (ii) the moment within each block increases up to saturation as the ions become fully aligned. For example, in standard ferromagnets the moment of each domain aligns in a small field to reach its ”technical” saturation, followed by a further increase of magnetization at much higher fields as the moment of individual domains increases towards full saturation.
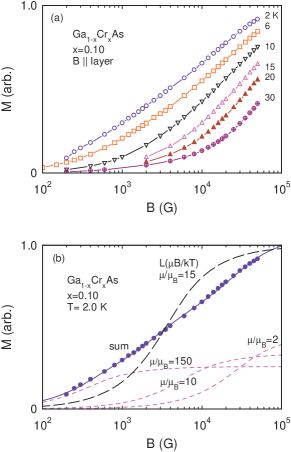
Figure 2 shows M(B) for T=2 K, with the field axis plotted on a log scale in order to display both low and high field behaviors. We first neglect the temperature dependence of M and focus on the M(B) behavior at T=2 K, displayed in Fig. 2b. We begin by computing M(B) using a simple BMP model. In this model the total magnetization is produced by many equal blocks, each characterized by a large classical magnetic moment, , aligning in a field B at a fixed temperature T. The magnetization for this, from the Langevin function, is given by
where is the saturation moment, and =1/11.6 meV/K. Assuming strong ferromagnetic coupling of magnetic ions in each block, their moment is approximated by the sum of the ion moments,
where n is the number of ions which are ferromagnetically coupled, the Lande factor, the spin of individual ions, and =0.0579 meV/T. The long-dashed curve in Fig. 2b is a fit to the data points with =15. This value is equivalent to about four S=2(g=2) magnetic ions which are coupled ferromagnetically. However, the fit to the data is poor. There is additional magnetization at low fields, as well as too little at higher fields. Also, as discussed in the last section, the data for different temperatures do not scale with the argument of the Langevin function. Thus, the BMP model is unable to describe the M(B) data, even at one temperature. It does establish that some ions are ferromagnetically coupled.
In our DMM model we employ a distribution in the magnetic moments of the polarons. The magnetization becomes
where is the distribution function of the magnetic moments. The M(B) data at T=2 K can be fit quite well using only three dipole moments in the sum, =2, 10, 150. This result is shown by the solid curve in Fig. 2b. The three separate Langevin functions from the fit are shown by the short-dashed curves. Although this fit is not unique, it points out that the distribution width encompasses several orders of magnitude in magnetic moment. This distribution is much broader than the typical ion distribution in fixed diameter acceptor-bound holes in BMPs. Furthermore, it is also useful to convert the three dipole moments into corresponding cluster diameters. For x=0.1 the three dipole moments correspond to clusters or polarons having diameters of 0.8, 1.3, 3.2 nm, respectively, assuming S=2(g=2) ions. This factor of 4 in size distribution is not unreasonable considering the sizable alloy disorder and electrical inhomogeneity in low temperature MBE grown alloys.
III.3 Temperature-dependent Susceptibility and Ferromagnetism
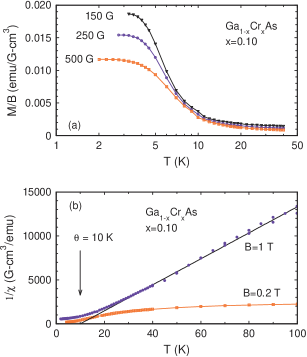
Figure 3a shows the magnetic susceptibility as a function of temperature, (T). The low-field susceptibility was determined from the measured magnetization by =M(T)/B for fields of B=150, 250, and 500 G. (Note that M/B is not field independent the data for the three fields do not coincide at any temperature.) For all three fields, the susceptibility strongly increases for decreasing temperature. Below T=4 K, (T) flattens out or saturates. Conventional ferromagnets show saturation in (T) when the sample becomes demagnetization limited, and the onset temperature is a lower bound for long range ferromagnetism.Shapira et al. (1973) The observed saturation of (T) below T=4 K could also be a lower bound for the ferromagnetic transition observed in the Curie-Weiss behavior discussed below.
The inverse susceptibility was plotted in order to see whether the Curie-Weiss law describes the paramagnetic response of the magnetic ions at higher temperatures. Figure 3b shows the temperature dependence of (T) obtained from M(T) taken at B=0.2 and 1 T. At temperatures above T=30 K, (T) is linear in temperature for the susceptibility measured at B=1 T. However, (T) obtained from the low field data is nonlinear in T. Nonlinearity was also found at lower fields, B=150, 250 and 500 G. This non-Curie-Weiss behavior for susceptibility measured at low fields is related to the nonlinearity in M(B) at low fields, which is due to ferromagnetic response of the magnetic polarons. The data taken at B=1 T was compared to the Curie-Weiss law,
where C=Nop2/3k, p2=g2S(S+1), No=2.21022 cm-3, =9.2710-21 emu/G, and k=1.3810-16 erg/K. The straight line is a fit to the data for temperatures above T=30 K with =10.0 K and C=0.0068 emu-K/cm3G. From the Curie constant, the average dipole moment per ion is p=3.1. This value obtained from the paramagnetic behavior is twice that found from the M(B) behavior at low temperatures. Assuming g=2, the computed average spin is S=1.54, close to S=3/2 for Cr3+. Finally, it is clear from the positive that there are sizable ferromagnetic interactions.
III.4 Resistivity
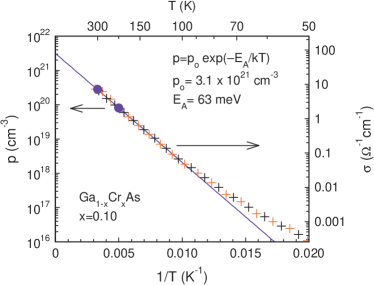
The materials are relatively good conductors at high temperatures, having a small room temperature resistivity, =0.1 cm. This is in the same range as that observed for (Ga,Mn)As, which has resistivity about an order of magnitude lower for conducting samples and one to two orders of magnitude higher in insulating samples. For decreasing temperature, the resistivity of (Ga,Cr)As increases by many orders of magnitude and becomes insulating. This behavior is similar to insulating (Ga,Mn)As, which shows insulating behavior for x0.02 and x0.06-0.08.Van Esch et al. (1997); Iye et al. (1999); Ohno (1998) Note that (Ga,Mn)As at x=0.02 is both an insulator and shows ferromagnetism. Ohno (1998) The resistivity of (Ga,Cr)As is activated at high temperatures. In Fig. 4 the log of the conductivity, log(), is plotted versus 1/T. It is clear that log() is linear in 1/T at high temperatures, from T=150 to 300 K. For this temperature range the activated conductivity follows
with an activation energy EA=661 meV. This energy is much smaller than 0.8 eV for the Cr to Cr acceptor-like transition in GaAs.Langer and Heinrich (1985) At the high doping levels appropriate to the present samples, the conduction involves activation from an effective band of electrons formed from the Cr d-levels and disorder-induced band broadening. Hall measurements were used to estimate the carrier concentration above T=200 K where the conduction is activated, but Hall measurements are not reliableLook et al. (1990) at lower temperatures where the conduction is due to hopping. In the activated region near room temperature, Hall measurements reveal hole conduction. The two p(T) data points at T=200 and 300 K have the same slope as (T). The p(T) data in Fig. 4 extrapolates to p=31021 cm-3, which is close to the density of Cr ions, xNo=2.11021 cm-3.

In order to better understand the conduction mechanisms, is plotted with =1, 1/2, 1/3, and 1/4 in Fig. 5a. From these four plots, it appears that the data for =1/2 has the highest linearity. This is displayed on an expanded scale in the lower plot, Fig. 5b. The data is remarkably linear over the entire range of conductivity of nearly nine orders of magnitude. (Some curvature is seen at higher temperatures where the conductivity has the exp[1/T] activation.) The straight line in Fig. 5b is a fit to the data using
with =1.1x104 cm-1 and T1=1.5x10⁴ K.
A temperature exponent of =1/2 has been shown to represent: (i)variable range hopping in doped semiconductors having a soft Coulomb gap; or (ii)tunneling between conducting regions in granular metals.Shklovskii and Efros (1984) Hopping conduction in (Ga,Cr)As has been suggested on the basis of the low mobility.Saito et al. (2001) Also, an exponent of =1/2 has been observed for a sample with x=0.02 over a range of conductivity of 2 and 1/2 orders of magnitude.Okazawa et al. (2001) In the case of a Coulomb gap, electron-electron interactions produce a gap in the density of localized states, with zero density at the Fermi level, EF, and a parabolic dependence on either side of EF. This model relies on the interaction between localized carriers as they hop from an occupied state below EF to an unoccupied state above EF.Shklovskii and Efros (1984) The Coulomb gap mechanism is active when the temperature is less than the gap energy. The gap energy for Cr could be substantial because of the small radius of the acceptor-like states. On the other hand, the exponent =1/2 can be related to tunneling between conducting regions, where the conducting objects are the clusters or magnetic polarons which are observed in the magnetization. Although it is remarkable that =1/2 over a range of of nearly a billion, the precise mechanism giving rise to the exponent requires further modeling. However, the mechanism of tunneling between clusters is favored over that of a Coulomb gap since the magnetization demonstrates the existence of conducting clusters or polarons which are isolated at low temperatures.
III.5 X-ray Diffraction

X-ray diffraction scans did not show any appreciable peaks not related to the zincblende structure, however, this does not rule out the possibility of small precipitates or materials having another crystal structure. The x-ray diffraction spectrum for x=0.10 is shown in Fig. 6. There is a second peak near 2=66∘in the (400) spectrum. This weaker peak is down-shifted in angle from the stronger GaAs substrate peak. The smaller angle corresponds to a larger lattice constant for the (Ga,Cr)As relative to GaAs. The down-shift of =0.094∘ corresponds to a lattice constant expansion in the growth direction of =0.000112 nm. Similar to (Ga,Mn)As, we expect that layers of (Ga,Cr)As are fully strained for thicknesses much larger than the critical thickness.Ohno (1998) In general, alloys grown at low temperatures have two contributions giving rise to a different lattice constant. Even without alloying, low temperature growth of GaAs produces a larger lattice constant.Fatemi et al. (1993) The change in lattice constant of (Ga,Cr)As with Cr concentration has been measured for x=0 to 0.06, where it was found that d/dx=+0.0082 nm.Okazawa et al. (2001) This expansion is smaller than that for (Ga,Mn)As, where d/dx=+0.032 nm.Ohno (1998) Note that (Ga,Cr)As has a 4 times closer lattice match to GaAs than (Ga,Mn)As. However, searching the literature for (x) data for (Ga,Mn)As it appear that (x) is not unique and the derivative, d/dx, varies by as much as a factor of two in samples grown in different laboratories. This means that the x-ray spectrum cannot be used to determine the concentration, unless perhaps the preparation conditions, such as As/Ga flux ratio, substrate temperature, growth rate, and post annealing are relatively unchanged.
IV Conclusions
(Ga,Cr)As at low Cr concentrations shows anomalous behavior in the magnetic and transport properties due to the random alloy nature of the magnetic and electronic interactions. At low temperatures M(B) rises much faster for increasing field than expected for uncoupled paramagnetic ions. This is evidence of short-range ferromagnetism between Cr ions. The M(B) dependence is compatible with a model of local ferromagnetism in magnetic clusters or polarons having a large distribution in magnetic moment. However, this model cannot explain the temperature dependence and further modeling is required to obtain a satisfactory picture of the inhomogeneous magnetism, including the saturating susceptibility at low temperatures. A positive =10 K from the high temperature susteptibility is also support for sizable ferromagnetic interactions. The mechanism for the ferromagnetism is not yet known. The situation could be similar to the long range ferromagnetism observed in (Ga,Mn)As, but the smaller hole wavefunction of the deeper Cr acceptors could give rise to strong localizing effects for quasi-itinerate holes. It is also possible that double exchange between the deep Cr acceptors could play a major role. Finally, it is remarkable that the conductivity below room temperature can be described by exp[ (T1/T)1/2 ] over a large range of conductivity of 8 orders of magnitude.
Acknowledgements.
We thank C. Feinstein, K. Pant, D.K. Basiaga, G. Favrot. Z. Lee, C. Bailey, T.H. Kim, and especially J.S. Moodera for considerable help with instrumentation, and Y. Ohno, S. Kravchenko, R.P. Guertin, G. Berera, and Y. Shapira for useful conversations and assistance with the measurements. This work was supported by NSF grant DMR-9804313.References
- Prinz (1998) G. A. Prinz, Science 282, 1660 (1998).
- Wolf et al. (2001) S. A. Wolf, D. D. Awschalom, R. A. Buhrman, J. M. Daughton, and S. von Molnar, Science 294, 1488 (2001).
- Awschalom et al. (2002) D. D. Awschalom, N. Samarth, and D. Loss, Semiconductor Spintronics and Quantum Computation (Springer, New York, 2002).
- Grunberg et al. (1986) P. Grunberg, R. Schreiber, Y. Pang, M. B. Brodsky, and H. Sowers, Phys. Rev. Lett. 57, 2442 (1986).
- Baibich et al. (1988) M. N. Baibich, J. M. Broto, A. Fert, F. Nguyen Van Dau, F. Petroff, P. Etienne, G. Creuzet, A. Friederich, and J. Chazelas, Phys. Rev. Lett. 61, 2472 (1988).
- Moodera et al. (1995) J. S. Moodera, L. R. Kinder, T. M. Wong, and R. Meservy, Phys. Rev. Lett. 74, 3273 (1995).
- Miyazaki and Tezuka (1995) T. Miyazaki and N. Tezuka, J. Magn. Mag. Mater. 139, L231 (1995).
- Datta and Das (1990) S. Datta and B. Das, Appl. Phys. Lett. 56, 665 (1990).
- von Molnar and Methfessel (1967) S. von Molnar and S. Methfessel, J. Appl. Phys. 38, 959 (1967).
- Nagaev (1983) E. L. Nagaev, Physics of Magnetic Semiconductors (Mir Publishers, Moscow, 1983).
- Furdyna and Kossut (1988) J. K. Furdyna and J. Kossut, Diluted Magnetic Semiconductors, vol. 25 of Semiconductor and Semimetals (Academic Press, Boston, 1988).
- Dietl (1994) T. Dietl, in Handbook of Semiconductors, edited by T. S. Moss (North Hollland, New York, 1994), vol. 3B, chap. (Diluted) Magnetic Semiconductors.
- Munekata et al. (1989) H. Munekata, H. Ohno, S. von Molnar, A. Segm ller, L. L. Chang, and L. Esaki, Phys. Rev. Lett. 63, 1849 (1989).
- Ohno (1998) H. Ohno, Science 281, 951 (1998).
- Matsukura et al. (2002) F. Matsukura, H. Ohno, and T. Dietl, in Handbook of Magnetic Materials, edited by K. H. J. Buschow (Elsevier Science, New York, 2002), chap. III-V Ferromagnetic Semiconductors.
- Ohno et al. (1996) H. Ohno, A. Shen, F. Matsukura, A. Oiwa, A. Endo, S. Katsumoto, and Y. Iye, Appl. Phys. Lett. 69, 363 (1996).
- De Boeck et al. (1996) J. De Boeck, R. Oesterholt, A. Van Esch, H. Bender, C. Bruynseraede, C. Van Hoof, and G. Borghs, Appl. Phys. Lett. 68, 2744 (1996).
- Young et al. (1999) D. P. Young, D. Hall, M. E. Torelli, Z. Fisk, J. L. Sarrao, J. D. Thompson, H. Ott, S. B. Oseroff, R. G. Goodrich, and R. Zysler, Nature 397, 412 (1999).
- Medvedkin et al. (2000) G. A. Medvedkin, T. Ishibashi, T. Nishi, K. Hayata, Y. Hasegawa, and K. Sato, Jpn. J. Appl. Phys. 39, L949 (2000).
- Matsumoto et al. (2001) Y. Matsumoto, M. Murakami, T. Shono, T. Hasegawa, T. Fukumura, M. Kawasaki, P. Ahmet, T. Chikyow, S. Koshihara, and H. Koinuma, Science 291, 854 (2001).
- Ueda et al. (2001) K. Ueda, H. Tabata, and T. Kawai, Appl. Phys. Lett. 79, 988 (2001).
- Reed et al. (2001) M. L. Reed, N. A. El-Masry, H. H. Stadelmaier, M. K. Ritums, M. J. Reed, C. A. Parker, J. C. Roberts, and S. M. Bedair, Appl. Phys. Lett. 79, 3473 (2001).
- Sasaki et al. (2002) T. Sasaki, S. Sonoda, Y. Yamamoto, K. Suga, S. Shimizu, K. Kindo, and H. Hori, J. Appl. Phys. 91, 7911 (2002).
- Chen et al. (2002) X. Chen, M. Na, M. Cheon, S. Wang, H. Luo, B. D. McCombe, X. Liu, Y. Sasaki, T. Wojtowicz, J. K. Furdyna, et al., cond-mat/0203361 (2002).
- Zhao et al. (2001) J. H. Zhao, F. Matsukura, K. Takamura, E. Abe, D. Chiba, and H. Ohno, Appl. Phys. Lett. 79, 2667 (2001).
- Yamada et al. (2002) M. Yamada, K. Ono, M. Mizuguchi, J. Okabayashi, M. Oshima, M. Yuri, H. J. Lin, H. H. Hsieh, C. T. Chen, and H. Akinaga, J. Appl. Phys. 91, 7908 (2002).
- Saito et al. (2002) H. Saito, W. Zaets, S. Yamagata, Y. Suzuki, and K. Ando, J. Appl. Phys. 91, 8085 (2002).
- van Schilfgaarde and Mryasov (2001) M. van Schilfgaarde and O. N. Mryasov, Phys. Rev. B 63, 233205 (2001).
- Akinaga et al. (2000) H. Akinaga, T. Manago, and M. Shirai, Jpn. J. Appl. Phys. 39, L1118 (2000).
- Sanvito and Hill (2000) S. Sanvito and N. Hill, Phys. Rev. B 62, 15553 (2000).
- Blakemore (1982) J. S. Blakemore, J. Appl. Phys. 53, 520 (1982).
- Clerjaud (1985) B. Clerjaud, J. Phys. C 18, 3615 (1985).
- Imbert et al. (1988) B. Imbert, H. Rajbenbach, S. Mallick, J. P. Herriau, and J. P. Huignard, Opt. Lett. 13, 327 (1988).
- White et al. (1980) A. M. White, J. J. Krebs, and G. Stauss, J. Appl. Phys. 51, 419 (1980).
- Saito et al. (2001) H. Saito, W. Zaets, R. Akimoto, K. Ando, Y. Mishima, and M. Tanaka, J. Appl. Phys. 89, 7392 (2001).
- Mizuguchi et al. (2002) M. Mizuguchi, H. Akinaga, T. Manago, K. Ono, M. Oshima, M. Shirai, M. Yuri, H. J. Lin, H. H. Hsieh, and C. T. Chen, J. Appl. Phys. 91, 7917 (2002).
- Okazawa et al. (2001) D. Okazawa, K. Yamamoto, A. Nagashima, and J. Yoshino, Physica E 10, 229 (2001).
- Wolff (1988) P. A. Wolff, in Dilute Magnetic Semiconductors, edited by J. K. Furdyna and J. Kossut (Academic Press, Boston, 1988), vol. 25 of Semiconductors and Semimetals, chap. Theory of Bound Magnetic Polarons in Semimagnetic Semiconductors, pp. 413–454.
- Heiman et al. (1983) D. Heiman, P. A. Wolff, and J. Warnock, Phys. Rev. B 27, 4848 (1983).
- Durst et al. (2002) A. C. Durst, R. N. Bhatt, and P. A. Wolff, Phys. Rev. B 65, 235205 (2002).
- Shapira et al. (1973) Y. Shapira, S. Foner, and T. B. Reed, Phys. Rev. B 8, 2299 (1973).
- Van Esch et al. (1997) A. Van Esch, L. Van Bockstal, J. De Boeck, G. Verbanck, A. S. van Steenbergen, P. J. Wellmann, B. Grietens, R. Bogaerts, F. Herlach, and G. Borghs, Phys. Rev. B 56, 13103 (1997).
- Iye et al. (1999) Y. Iye, A. Oiwa, A. Endo, S. Katsumoto, F. Matsukura, A. Shen, H. Ohno, and H. Munekata, Materials Science and Engineering B (Solid State Materials for Advanced Technology) 63, 88 (1999).
- Langer and Heinrich (1985) J. Langer and H. Heinrich, Phys. Rev. Lett. 55, 1414 (1985).
- Look et al. (1990) D. C. Look, D. C. Walters, M. O. Manasreh, J. R. Sizelove, C. E. Stutz, and K. R. Evans, Phys. Rev. B 42, 3578 (1990).
- Shklovskii and Efros (1984) B. I. Shklovskii and A. L. Efros, Electronic Properties of Doped Semiconductors, vol. 45 of Springer Series in Solid-State Sciences (Springer-Verlag, New York, 1984).
- Fatemi et al. (1993) M. Fatemi, B. Tadayon, M. E. Twigg, and H. B. Dietrich, Phys. Rev. B 48, 8911 (1993).