Spatial Structure of the Internet Traffic
Abstract
The Internet infrastructure is not virtual: its distribution is dictated by social, geographical, economical, or political constraints. However, the infrastructure’s design does not determine entirely the information traffic and different sources of complexity such as the intrinsic heterogeneity of the network or human practices have to be taken into account. In order to manage the Internet expansion, plan new connections or optimize the existing ones, it is thus critical to understand correlations between emergent global statistical patterns of Internet activity and human factors. We analyze data from the French national ‘Renater’ network which has about millions users and which consists in about interconnected routers located in different regions of France and we report the following results. The Internet flow is strongly localized: most of the traffic takes place on a ‘spanning’ network connecting a small number of routers which can be classified either as ‘active centers’ looking for information or ‘databases’ providing information. We also show that the Internet activity of a region increases with the number of published papers by laboratories of that region, demonstrating the positive impact of the Web on scientific activity and illustrating quantitatively the adage ‘the more you read, the more you write’.
pacs:
PACS numbers: 02.50 -r, 05.45.Tp, 84.40.Ua, 87.23.GeI Introduction
Internet connects different routers and servers using different operating systems and transport protocols. This intrinsic heterogeneity of the network added to the unpredictability of human practices [1] make the Internet inherently unreliable and its traffic complex [2, 3, 4, 5, 6].
There has been recently major advances in our understanding of the generic aspects of the Internet [7, 8, 9, 10] and web [11, 12, 13, 14, 15, 16] structure and development. Concerning data transport, most of the studies focus on properties at short time scales or at the level of individual connections [2, 17, 18], while studies on statistical flow properties at a large scale [3, 4, 6, 19] concentrate essentially on the phase transition to a congested regime. Despite of these results, large scale studies of traffic variations in time and space are still needed before understanding the new social practices of Internet users.
In this paper, we study the spatial structure of the large scale flow. We present in part II the data studied and in parts III and IV the results of our analysis, showing the existence of a spanning network concentrating the major part of the traffic. Finally, in part V we relate the flow properties and its spatial distribution to scientific activity measured by the number of published papers.
II Data studied
An important difficulty is to obtain real data measurements of the Internet traffic on a global scale. The availability of data of the French network ‘Renater’ allows us to consider the cartography of Internet’s traffic and its relation with regional socio-economical factors.
The French network ‘Renater’ has about million users and is constituted of a nation-wide infrastructure and of international links [20]. Most of the research, technological, educational or cultural institutions are connected to Renater (Fig. 1). This network enables them to communicate between each other, to get access to public or private world-wide research institutes and to be connected to the global Internet.
We first restrict our analysis to the national traffic and exclude the information exchange with external hosts and routers such as US and Europe Internet or peering with other ISPs. This restriction to a small part of the Renater traffic ( of roughly Gigabytes a day) has two methodological advantages: First, it ensures that the traffic studied is strictly professional (mail to non-academics, like family, friends, consultation of newspapers, e-commerce, etc. goes through outer ISP and is not taken into account); Second, it helps to understand the regional traffic structure and its relation with local economical factors. We believe that the global patterns emerging for the Renater network will be relevant for larger structures such as the global Internet.
The data consist of the real exchange flow (sum of Ftp, Telnet, Mail, Web browsing, etc.) between all routers, even if there is not a direct (physical) link between all of them. For a connection between routers and (), (in bytes per minutes) is the effective information flow at time going out from to . For technical reasons, data for a few routers were not reliable and we analyzed data for routers which amounts in matrices given for every minutes for a two weeks period (the quantities are excluded from the present study).
As an example of the measured time-series, we show (Fig. 2) the information flow versus time between two routers located in Grenoble and Marseille for a nine days period. One can see the different days and within days, bursts of intense activity. In this study, we focus on the flow and not on the growth rate (and its correlations) used in a previous study [21].
III Databases versus Active Centers
We now present our empirical results. The time averaged incoming flow
| (1) |
at a given router is a measure of the Internet activity of the corresponding region (the over-bar denotes the average over time). On the other hand, the average outgoing flow
| (2) |
can be interpreted as the total request emanating from other routers. It is thus a measure of the degree of interest produced by this region.
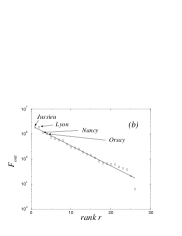
We plotted both quantities , versus their rank (Fig. 3a,b). In contrast with many cases observed since the work of Zipf [22], the observed distributions are not power laws but exponentials. This might be the signature of a transient regime and would mean that the Internet didn’t reach his stationary state, but it is more probably the sign that the Internet traffic has a unique, non hierarchical-type structure [23]. This exponential behavior also means that–at least in the Renater network–there are essentially two categories of regions. Considering Internet activity (Fig. 3a), one can distinguish active from (almost) inactive regions. Roughly, there are about eight cities which receives of the total traffic, the rest being (exponentially) negligible. Concerning the outgoing flow (Fig. 3b), there are about five most visited regions, the rest being comparatively ‘unattractive’. We checked that for different time windows the order of these cities can slightly change, but the exponential behavior is independent of these seasonal effects.
It is interesting to note that the most active and visited regions are not the same showing that each region has its specific activity. Regions with a large incoming flow can be classified as active research centers with a great need of information, and regions with a large outgoing flow correspond to important information resources such as e.g., databases or libraries.
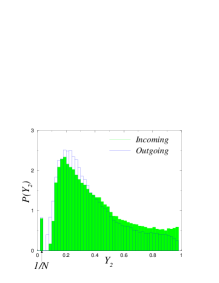
At this stage, we have shown that in the Renater traffic there is a small number of receivers (located in active regions) and emitters (visited databases). However, a further question concerns the secondary routers and the fine structure of flows. Indeed, (and similarly for ) could be a sum of many small contributions coming from many regions, or in contrast there could be only few regions which exchange a significant flow. Simple quantities which can characterize the fine structure of the incoming flow at router are the ’s introduced in another context [24]
| (3) |
where is the weight associated with the incoming flow (and similar expressions for the structure of outgoing flow). It is easy to see that , and the first non trivial quantity is . We can illustrate the physical meaning of with simple examples. If all weights are of the same order for all then is very small. In contrast, if one weight is important for example of the order and the others negligible then is of order unity. Thus is a measure of the number of important weights. We plot for both the incoming and outgoing flows (the statistics is over two weeks). The result (Fig. 4) shows clearly that the most probable value is and that is larger than (except for few cases which appear in the histogram). This confirms the fact that a few routers are exchanging most of the information, the rest of the network being negligible.
IV Spanning network
In order to illustrate the above results, we construct the network connecting a number of routers and carrying the maximal flow denoted by . We increase from to and we obtain the result plotted in Fig. (5a). It appears clearly that a small fraction of links carry most of the flow. This behavior is encoded in the fact that is a power law for
| (4) |
with an exponent smaller than one (), so that a small variation of the number of connections leads to a large variation of the transported flow.
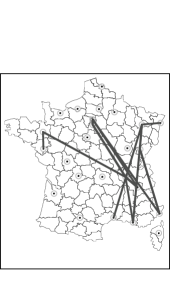
This analysis completes the Renater traffic map: there is a small number of receivers and emitters exchanging significant information between them, the rest of the network being exponentially negligible. This demonstrates the existence of a ‘spanning network’ carrying most of the traffic and connecting the main emitters to the main receivers.
In order to visualize this spanning network on the French map, we filter the flow with the following procedure. We first select flows above a certain threshold , and then we select a connection only if the corresponding flow represents a large percentage of (i) the outgoing flow from and (ii) the incoming flow in . The result is shown on Fig. 5b. We checked that the instantaneous (or averaged over a different time window) spanning network is eventually different, but always with the same characteristics (small number of interconnected emitters and receivers). The procedure described above could thus be used as a simple filter in order to visualize in real-time a complex flow matrices.
V Digression to Scientometrics: Internet Traffic versus Scientific activity
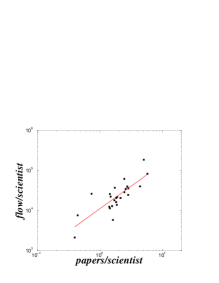
So far, we have studied statistical properties of the traffic, but an important point is to relate them to economical or social factors. The Internet activity should in principle be related to social pointers such as the number of inhabitants, the number of students, and so on. From our data, the indicator which shows the best correlation with Internet activity is scientific activity measured by the number of published papers [25]. One can expect that the more a scientist consults books or data, the more he/she will publish. This principle, ‘the more you read, the more you write’, although commonly accepted in a number of historical cases [26], is difficult to evaluate quantitatively. The main difficulty being the measure of the amount of information gathered by scientists in libraries. In the case of Internet, the information gathered by scientists working in a given region can be estimated by the average incoming flow in the corresponding router. Since the information needed for a scientist is usually scattered world-wide, it is important here to take into account the total incoming flow, including exchanges with international hosts. We thus compare the total average incoming flow (per scientist) with the average number of papers published (per scientist) per year by the region’s universities (obtained from the SCI database). As a representative panel, we choose to use data about papers published only by scientists in the national research institution (CNRS [27]). We represent these data on Fig. 6. This plot shows that the average incoming flow per scientist in a region is increasing with the number of published scientific papers per scientist by this region’s laboratories roughly as a power law
| (5) |
with exponent . This result confirms quantitatively the intuitive principle stated above and is particularly interesting from the point of view of the Web’s social impact. Indeed, it implies that the number of publications is growing with the incoming flow as a power law with exponent : the more one uses Internet, the more one publishes! This result indicates that on average the use of Internet has a positive impact on research productivity.
VI Conclusion
In summary, we have shown that the major part of the traffic takes place only between a few routers while the rest of the network is almost negligible. We have proposed a simple procedure to extract this (bipartite) spanning network, which could have some implications in visualization and monitoring of real-time traffic. In addition, resources allocation and capacity planning tasks could benefit from the knowledge of such a spanning network. These results point towards new ways of understanding and describing real-world traffic. In particular, any microscopic model should recover these statistical properties and our results provide a quantitative basis for modeling the dynamics of information flow.
We also have shown that the scientific activity of a region is increasing with its Internet activity. This indicates that it is difficult for a scientist to avoid the use of Internet without affecting his/her productivity measured in terms of publications. This result also demonstrates that in addition to increase people’s social capital [28] the Internet has a measurable positive impact on research production. More generally, it underlines the importance of Internet as knowledge sharing vector. This study also suggests that the Internet activity could be used as an interesting new socio-economical pointer well adapted to the information society.
Finally, these results exhibit some global statistical patterns shedding light on the relations between the Internet and economical factors. It shows that in addition to the structural complexity of the web and the Internet, the traffic has its own complexity with its own cartography.
REFERENCES
- [1] B. A. Huberman and R. M. Lukose, Science 277 (1997) 535.
- [2] W. E. Leland et al, IEEE/ACM Transactions on Networking 2 (1994) 1.
- [3] I. Csabai, Journal of Physics A: Math. Gen. 27 (1994) 417.
- [4] K. Thompson, G. J. Miller, and R. Wilder, IEEE Network 11, (Nov-Dec 1997).
- [5] A. Feldmann, A. C. Gilbert, W. Willinger, and T. G. Kurtz, Computer Com. Rev. 28 (1998) 5.
- [6] M. Takayasu, H. Takayasu, and K. Fukuda, Physica A 277 (2000) 248.
- [7] For a study on the Internet structure and map, see the Internet Mapping Project www.cs.bell-labs.com/who/ches/map/index.html.
- [8] M. Faloutsos, P. Faloutsos, and C. Faloutsos, ACM SIGCOMM’99, Comput. Com. Rev. 29 (1999) 251.
- [9] G. Caldarelli, R. Marchetti, and L. Pietronero, Europhys. Lett. 52 (2000) 386.
- [10] R. Pastor-Satorras, A. Vasquez, and A. Vespignagni, Phys. Rev. Lett. 87 (2001) 258701. Cond-mat/0105161.
- [11] R. Kumar, P. Raghavan, S. Rajalopagan, and A. Tomkins, Proceedings of the 25th VLDB Conf., Edinburgh, 1999.
- [12] A. Broder et al. Proceedings of the 9th International WWW conference, Amsterdam, The Netherlands, 309-320, Elsevier Science, May 2000.
- [13] A.-L. Barabási and R. Albert, Science 286 (1999) 509.
- [14] L. A. Adamic, Lect. Notes Comput. Sci 1696 (1999) 443.
- [15] B. .A. Huberman et al, Science 280 (1998) 95.
- [16] S. Mossa, M. Barthelemy, H.E. Stanley, and L.A.N. Amaral, Phys. Rev. Lett. 88 (2002) 138701.
- [17] M. Crovella and A. Bestavros, IEEE/ACM Transactions on Networking 5 (1997) 835.
- [18] W. Willinger, M. S. Taqqu, R. Sherman, and D. V. Wilson, IEEE/ACM Transactions on Networking 5 (1997) 71.
- [19] K.Fukuda, PhD Thesis: A study on Phase Transition Phenomena in Internet Traffic, Keio University (1999). Available at http://www.t.onlab.ntt.co.jp/ fukuda/research/.
- [20] For more details on this network, see the web page www.renater.fr
- [21] M. Barthelemy, B. Gondran, and E. Guichard, submitted to Phys. Rev. E (2002). Eprint: cond-mat/0206185.
- [22] Zipf, G. K. Human Behavior and the Principle of least effort Hafner Publishing Company (1972, facsimile of 1949 Edition).
- [23] Marsili, M. & Zhang, Y.-C., Phys. Rev. Lett. 80 (1998) 2741.
- [24] B. Derrida, H. Flyvbjerg, J. Phys. A20, 5273-5288 (1987)
- [25] T. Braun, W. Glanzel, & A. Schubert, Scientometric Indicators Datafiles. Scientometrics 28 (1993) 137.
- [26] M. Baratin & C. Jacob, Eds. Le Pouvoir des Bibliothèques Editions Albin Michel, Paris (1996).
- [27] http://www.cnrs.fr
- [28] B. Wellman, Computer Networks as Social Networks Science. 293 (2001) 2031.