Surface characterization and surface electronic structure of organic quasi-one-dimensional charge transfer salts
Abstract
We have thoroughly characterized the surfaces of the organic charge-transfer salts TTF-TCNQ and (TMTSF)2PF6 which are generally acknowledged as prototypical examples of one-dimensional conductors. In particular x-ray induced photoemission spectroscopy turns out to be a valuable non-destructive diagnostic tool. We show that the observation of generic one-dimensional signatures in photoemission spectra of the valence band close to the Fermi level can be strongly affected by surface effects. Especially, great care must be exercised taking evidence for an unusual one-dimensional many-body state exclusively from the observation of a pseudogap.
pacs:
79.60.Fr,73.20.-r,71.20.-b,79.60.-iI Introduction
In strictly one-dimensional (1D) metals many-body theory predicts unusual behavior of the electronic properties due to their fundamental instability against an infinitesimal small perturbation of the Coulomb interaction. Such systems can no longer be described by conventional Fermi liquid (FL) theory. Instead, the concept of a Luttinger liquid (LL) has been introduced which is characterized by generic 1D features. These comprise e.g. bosonic excitation modes rather than fermionic quasi-particles, a power-law decay of the momentum integrated spectral weight towards the Fermi energy or spin-charge separation.Voit95 Most of these signatures are best seen in the (momentum resolved) single particle excitation spectrum as directly probed by (angle resolved) photoemission spectroscopy ((AR)PES). Indeed, (quasi-)1D metals were found to display marked deviations from conventional metallic behavior using (AR)PES.Dardel91 ; Hwu92 ; Dardel93 ; Coluzza93 ; Claessen95 ; Sekiyama95 ; Takahashi96 ; Gweon96 ; Zwick97 ; Zwick98 ; Vescoli00 ; Claessen02 Basically all 1D materials studied so far show no clear Fermi cut-off. Only recently, we obtained convincing evidence for spin-charge separation in the charge-transfer salt TTF-TCNQ based on an analysis within the 1D Hubbard model.Claessen02 However, PES is extremely surface sensitive and any deviation from conventional metallic behavior could simply be due to the surface being different from the bulk. Unfortunately, up to now only little effort has been spent on the investigation of the actual nature of the surface under study. This would be especially important for organic materials which are particularly susceptible to rapid photon induced decomposition in the vacuum ultraviolet (VUV). In this paper we aim to fill this gap for TTF-TCNQ and deal with another charge-transfer salt, (TMTSF)2PF6, to exemplify the importance of both intrinsic and extrinsic surface effects.
II Organic charge-transfer salts
The organic charge-transfer salts comprise a vast variety of molecular crystals containing almost planar organic donor and/or acceptor molecules as essential structural building units. These are stacked on top of each other with a possible tilt of the molecular planes relative to the stacking direction. Several types of stacks can occur, e.g. consisting of only one species, or with molecules A and B alternating along one stack or being segregated to form two types of chains as in TTF-TCNQ. However, the interesting electronic properties of these compounds are not of molecular origin but arise from the interaction of adjacent molecules. Depending on the “side by side” and “face to face” interaction strength the crystals show predominantly one- and two-,Torrance87 or even three-dimensional features in their electronic behavior.Ishida01 The intermolecular interaction involves the orbitals pointing perpendicular to the molecular plane and ranges from van der Waals-type over weakly covalent to ionic in character. An on-molecule Coulomb repulsion energy in the range between 0.5 and 2 eV together with the relatively small band widths puts these systems in an intermediate coupling regime where correlations may be important.Torrance87 It is the quasi-tunability of the correlation strength and the dimensionality which makes the organic charge-transfer salts so interesting and produces this wealth of symmetry-breaking ground states including spin- (SDW) and charge-density waves (CDW), spin-Peierls states and even superconductivity. In this paper we focus on two systems, TTF-TCNQ and (TMTSF)2PF6 which could be classified within the above-sketched scheme as quasi-one-dimensional mixed valency segregated stack conductors. In TTF-TCNQ the mixed valency is due to incomplete charge transfer of 0.59 electrons from TTF to TCNQ while in the so-called Bechgaard salt (TMTSF)2PF6 it arises from the ratio between the radical cation TMTSF and the counter anion PF6.Torrance87 In the following we only show data which were recorded in the normal metallic state, i.e. above the CDW-transition temperature of 54 K for TTF-TCNQ Kagoshima88 and above the 1D-2D crossover temperature of about 110 K for (TMTSF)2PF6.Moser98
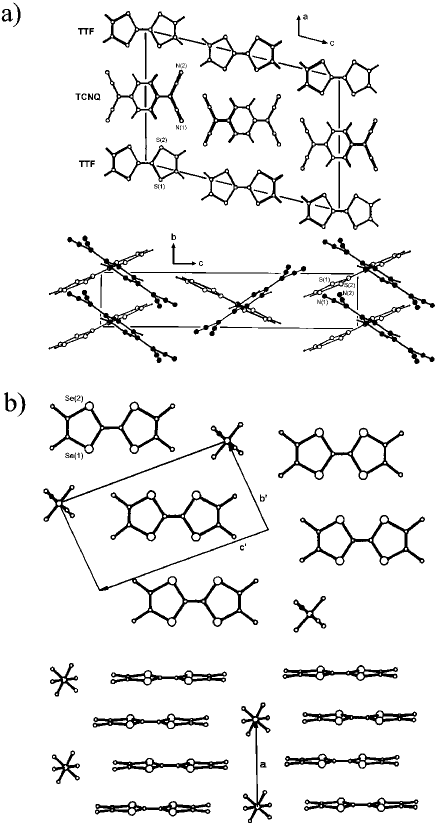
b′ and c′ denote the projections of b and c (after Ref. Thorup81, ).
TTF-TCNQ (C18H8N4S4) crystallizes in a monoclinic structure (Fig. 1), space group , with lattice parameters Å, Å, Å, and .Kistenmacher74 The segregated TTF and TCNQ stacks run along the crystallographic b direction. The molecular planes are tilted (with opposite signs) by (TTF) and (TCNQ) with respect to b around a. The two types of chains alternate along a while they do not along c. Within a unit cell there are two TTF (TCNQ) chains with opposite tilting angles of the molecules thus leading to a herringbone-type of arrangement.
The crystal structure of (TMTSF)2PF6 (2C10H12Se4.PF6) is triclinic, space group , with lattice parameters Å, Å, Å, and angles , , at 300 K.Thorup81 The easy axis, the crystallographic a direction, is made up by TMTSF stacks stabilized by the negatively charged PF6 counter ions in between. The molecular plane is almost perpendicular to a.
III Experimental details
The TTF-TCNQ and (TMTSF)2PF6 single crystals were grown by diffusion (in pure acetonitrile) and electro-crystallization, respectively. They had typical dimensions of mm3 and mm3, respectively, with their 1D direction along the long sample axes. Their lancet-like shape makes it only possible to perform PES measurements on the (001) () plane for both TTF-TCNQ and (TMTSF)2PF6.
For both systems clean surfaces were exposed by in situ cleavage of the crystals at a base pressure in the low mbar range through knocking off a post glued on the sample surface. PES spectra were recorded using an OMICRON Multiprobe surface analysis system equipped with an EA 125 analyzer. For x-ray induced photoemission spectroscopy (XPS) the total energy resolution was set to 0.6 eV while for photoemission in the ultraviolet (UPS) the energy resolution amounted typically to meV and meV for TTF-TCNQ and (TMTSF)2PF6, respectively. The acceptance angle was for XPS and for UPS. Monochromatized Al Kα radiation ( eV) and unmonochromatized He I photons (21.22 eV) from a conventional discharge lamp were taken as excitation sources. Calibration of the binding energy scale was achieved by measuring the Fermi edge of a freshly sputtered Au foil at low temperatures. All XPS spectra were recorded at room temperature whereas the UPS spectra on TTF-TCNQ and (TMTSF)2PF6 were taken at 60 K and 150 K, respectively.
IV TTF-TCNQ
IV.1 Ideal and actual sample surface in direct space
First of all it is important to note that the natural cleavage plane of TTF-TCNQ is parallel to the (001) lattice plane. If we regard the extended molecules for a moment as represented by point charges it is immediately seen that this (001) lattice plane essentially bears no net surface charge since it contains as many TTF- as TCNQ- molecules (Fig. 1). Thus there is no charge imbalance and the surface created by exposing this plane should essentially be stable. Taking into account more realistically the planar shape and the bulk arrangement of the TTF- and TCNQ-molecules the same holds for the (001) layer. However, due to the broken translational symmetry the Madelung potential at the surface will differ from that in the bulk.
Thus it is conceivable that there will occur some electronic charge redistribution probably concomitant with a structural surface relaxation. Since the intramolecular covalent bonds are quite strong and hence the molecules themselves rigid and since, in addition, there are no dangling bonds perpendicular to the surface such a structural relaxation most likely will happen by changes in the tilting angles with respect to the bulk. One could speculate that structural changes at the surface will take place such that a better screening of the Madelung potential is achieved, i.e. by a stronger hybridization of the orbitals perpendicular to the plane of the molecules. These ideas will be discussed in more detail below.
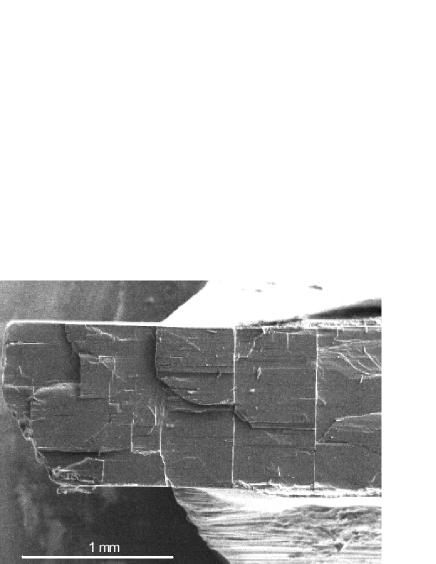
Figure 2 shows a typical scanning electron microscopy (SEM) image of a cleaved TTF-TCNQ crystal. One clearly sees the good quality of the exposed surface with large flat terraces. Thus, the actual sample surface indeed can be viewed as representing the (001) lattice plane.
IV.2 Surface characterization by XPS
The surface composition of the TTF-TCNQ crystals was investigated by means of XPS. Figure 3 shows an overview spectrum of a TTF-TCNQ surface. Each spectral feature in the spectrum can be identified and classified according to its physical origin, i. e. as stemming from core levels or Auger processes. In addition, one can find satellite structures to each intense core level at multiples of about 22 eV away from the main line. These are related to inelastic losses suffered by the photoelectrons due to plasmon excitations of all the valence electrons. Except for a slight O contamination (see below) we find only signatures of the constituent elements of TTF-TCNQ.

For a quantitative analysis it is important to assure that the individual core lines and their plasmon satellites are well separated from each other so that there is no contribution of other origin except for a structureless background due to secondary electrons. In order to determine the spectral weight of a certain core excitation a Shirley background was subtracted before integration. The areas thus obtained were weighted by the inelastic mean free path of the photoelectrons (which is a function of kinetic energy), the transmission function of the analyser (also a function of kinetic energy), and the photoexcitation cross sections. Using experimentallyWagner81 and theoreticallyYeh85 derived cross sections basically yields identical results. In Tab. 1 we summarize values obtained for a typical sample in normal-emission (NE) geometry employing the experimentally determined cross sections. Note that the error amounts to about 20 %, mainly due to the uncertainty of the tabulated cross sections used. Nevertheless, the agreement of the surface composition as determined by XPS and the nominal composition given by the bulk stoichiometry of the material is striking. Especially there is no excess of carbon detectable and only a weak contamination with oxygen is observed.
| element [core line] | O [1] | C [1] | N [1] | S [2] |
|---|---|---|---|---|
| nominal composition | 0 | 36 | 8 | 8 |
| from XPS | 0.4 | 34.2 | 7.8 | 8 |
Additional information beyond a qualitative and quantitative elemental analysis as discussed so far may be extracted from the line shapes and the fine structure of a certain core level. We first turn to the C 1 and S 2 lines since they can be discussed on equal basis. Their XPS-spectra recorded in NE geometry are displayed in Fig. 4. The C 1 and S 2 lines both consist of one single peak with an asymmetrically decaying tail at the higher binding energy side. From the peak maxima we derive a binding energy of 285.2 eV and 228.4 eV for the C 1 and S 2 level, respectively. The corresponding line widths (FWHM) amount to about 2.3 eV and 2.7 eV.

Spectra of the above mentioned core levels are rarely discussed in the literature for TTF-TCNQ.Butler74 ; Fraxedas98 As for the C 1 level the reason is obvious. Carbon is not specific for either the TTF or the TCNQ molecule, and there are many (9) inequivalent sites in the crystal structure. Since at each of these the chemical environment is different the corresponding C 1 signals are shifted in energy relative to each other. However, due to the finite experimental resolution and the lifetime broadening of the photoemission final states they overlap to one single relatively broad line as seen in Fig. 4.
A closer look at the S 2 line seems to be more promising. Sulphur is specific for the TTF molecule and there are only two crystallographically different sites in a ratio . Nonetheless, these cannot be resolved (s. Fig. 4). However, provided that there exist no further lines, e.g. due to a surface species with different binding energy and relative intensity, the superposition of two symmetric line shapes contributing with equal strength is always symmetric. Thus, from the S 2 spectrum we conclude that the asymmetric tail indeed is inherent to each single component.
That the situation actually is more subtle can be seen from the S 2 line shown in Fig. 5. In contrast to the S 2 line, the S 2 signal is split into two maxima at about 163.8 eV and 164.8 eV. The former maximum is about 15% higher in intensity than the latter. An additional shoulder is situated at about 165.9 eV. Again an asymmetrically decaying tail is seen at higher binding energies. It is obvious that the two maxima about 1 eV apart cannot be identified with the spin-orbit split 2 doublet. They exhibit not only a quantitatively wrong intensity ratio (expected to be between lower and higher binding energy peak), but it is even reversed with the lower binding energy peak being significantly weaker. Furthermore, the splitting of the order of 1 eV seems far too high to be explained by a chemical shift of the binding energies due to the two inequivalent S sites. The bonding lengths of the S(1) and S(2) atoms (s. Fig. 1) are almost equal.Kistenmacher74 Also the intermolecular environment of the S(1) and S(2) atoms is topologically similar and in particular exhibits similar distances of the S sites to the neighboring TCNQ molecules. One has to conclude that there exist two significantly different S signals with possibly different relative strength which questions the above reasoning regarding the S 2 line. Thus, in order to clarify the situation it is necessary to perform a line shape analysis of the S 2 line. In accordance with our conclusion above we used two doublets with the spin-orbit splitting (intensity ratio ) fixed at 1.18 eV. Moulder92 If the observed asymmetric tail is intrinsic for each core level and not only caused by a superposition of different lines it would be readily explained by collective screening of the conduction electrons as is well known for metals.Doniach70 Hence, to each component in our analysis we assigned the so-called Doniach-Šunjić line shape describing the metallic screening. Besides the energy position and width a parameter enters its definition which determines the asymmetry. A Lorentzian is recovered for . We used one single for all components. In the fitting procedure included was also a convolution by a Gaussian of variable width to account for the experimental resolution ( eV) and contributions to the line width which do not stem from purely exponential decay e.g. due to the coupling to phonons. Allowing for larger Gaussian widths than justified by the experimental resolution alters the line shapes of each component in that the onset at lower binding energies gets steeper, i.e. more Gaussian-like in character. The overall width and the peak asymmetry as well as all other fit parameters remain essentially unchanged. The results are displayed in
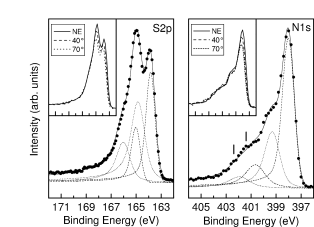
Fig. 5. The experimental spectrum is reproduced very well. The asymmetry parameter comes out to be 0.11, in reasonable agreement with values for simple metals.Huefner96 From this analysis we infer the intrinsic character of the asymmetric tail due to the coupling of the photohole to the conduction electrons and confirm that essentially two S signals are observed which, as stated above, cannot be reconciled by the chemical shift of the binding energies of the two inequivalent S sites. The most interesting quantity to be explained is the intensity ratio of the lower to the higher binding energy contribution, which from the fit is found to be .
Before further elucidating the origin of the two components of the S 2 line and their intensity ratio we first turn to the line most intensively discussed in the literature, Grobman74 ; Epstein75 ; Swingle75 ; Metzger75 ; Epstein76 ; Grobman76 ; Ritsko78 ; Fraxedas98 ; Rojas01 the N 1 core level excitation. As is obvious from Fig. 5 it consists of at least three contributions, a distinct maximum at about 398.0 eV and two shoulders at higher binding energies of about 399.5 eV and 401.4 eV. Note that for similar arguments as in the case of sulphur these energy differences are too large to be accounted for by possible chemical shifts of the two inequivalent N sites. Looking closer at the shoulder at highest binding energy one can actually distinguish additional fine structure which may be connected to two underlying components (marked by ticks in Fig. 5). Since they appear to be equally spaced and to display a similar intensity ratio as the two structures at lower binding energy we identify them simply as accompanying satellite features of two different components. This assignment is in line with the N 1 spectrum of pure TCNQ crystals, which consists of one main line and a satellite structure well separated by about 2.6 eV.Lindquist88 This satellite was attributed to an intramolecular shake-up process between the highest occupied molecular orbital of the neutral and the lowest unoccupied molecular orbital of the ionized TCNQ molecule. Due to the only weak covalent bonding similar local excitations will persist in TTF-TCNQ.
We fitted this model to our data where again we simulated the line shapes according to Doniach and Šunjić. This applies also to the satellites although their actual spectral form is microscopically of other origin. Without any additional information the two main lines and one of the satellite peaks (the more pronounced one at lower binding energy) have to be varied independently while the second satellite is coupled to its main line in the same way, i.e. with respect to energy position, width, and weight, as the first one. In addition, we employed for simplicity only one single asymmetry parameter. The results of the fit are displayed in Fig. 5. The important quantities we can extract are the main line–satellite splitting of about 2.6 eV, the asymmetry parameter and the intensity ratio of about between lower and higher binding energy contributions.
We note that the 2.6 eV main line–satellite splitting perfectly agrees with the experimental value for pure TCNQ and thus confirms our fit model. It is now interesting to correlate the intensity ratio for lower and higher binding energy contributions with that obtained for S 2. Intriguingly, the ratios have within the accuracy of this evaluation just reciprocal values. The idea suggests itself that this may have something to do with the electron transfer from TTF to TCNQ. This leaves the TTF and TCNQ molecules in a mixed valent state of 0.59+ and 0.59-, respectively. If the charge fluctuations between TTF0 and TTF+ on the one hand and TCNQ0 and TCNQ- on the other take place on a slower time scale than the photoemission process itself one would observe two peaks corresponding to the two chemical states of TTF and TCNQ, respectively. Moreover, due to less effective screening of the core potential the TTF+ state should show up in the S 2 spectrum at higher binding energy compared to the neutral chemical state. The reverse is true for TCNQ- and the N 1 line. In both cases the charged state should have a larger spectral weight with a ratio . Indeed, this scenario matches qualitatively our data and is even in fair quantitative agreement with our line shape analysis.
We only briefly mention here the controversial debate regarding the correct interpretation of the N 1 spectral features in the 70’s. Partly, it was caused by the minor quality of the data which showed quite large intensity variations depending on the method of sample preparation.Grobman74 ; Swingle75 ; Ritsko78 In particular, none of these measurements were done on cleaved single crystals as in this work. Thus, a reliable quantitative analysis was highly impeded although the idea of two chemical states of N to be seen in the spectra was used early in order to determine the amount of charge transfer.Grobman74 Moreover, much of the persuasive power of our above argumentation is owed to the correlation of the results of our analysis for the N 1 and S 2 spectra which previous work failed to attempt.Ikemoto77 ; Tokumoto82 Instead, it was argued from calculations of the Madelung potentials that Coulomb energy differences may account for the observed relative energy shifts.Epstein75 ; Metzger75 ; Epstein76 However, it was shown that as no polarization effects in the solid state were taken into account such calculations were of little use.Grobman76
Not least because of some reports on evidence for strong angle dependent intensity variations in XPS spectra of TTF-TCNQ, especially regarding the N 1 level, Swingle75 ; Ritsko78 some space is given to that issue here. Since 95 % of the detected photoelectrons at a certain kinetic energy which were not scattered inelastically stem from a layer of thickness , where is the inelastic mean free path at that energy, the information depth of XPS can be varied on a scale of about Å by changing the detection angle with respect to the surface normal. The results of our measurements at 0∘ (NE), 40∘ and 70∘ are displayed as solid, dashed and dotted lines in Fig. 4 and the insets of Fig. 5. The spectra are normalized to the background intensity at low binding energies. Note that the background might be angle dependent as well. Hence, only pronounced intensity variations as a function of emission angle should be taken seriously. In view of this caveat the S 2, S 2, and N 1 lines are not conspicuous. The slightly decreasing peak heights with increasing emission angles are most probably just a matter of the normalization being systematically wrong. On the contrary, the C 1 line displays at the biggest emission angle some additional spectral weight at higher binding energies. This is likely due to a slight surface contamination. Remarkable, however, is the angular dependence of the O 1 line. While only a weak signal is seen at NE and 40∘ off NE a strongly enhanced peak emerges at 70∘ off NE. This behavior provides striking evidence that the O must be accumulated on the topmost surface layer. It originates probably from the residual gas molecules in the vacuum chamber. The observed O contamination takes place on a very short time scale and has saturated within minutes. However, since the amount is small it does not severely affect the UPS measurements discussed below.
To make the comprehensive discussion of the XPS spectra conclusive with respect to our aim, i.e. to relate surface and electronic structure, we summarize the results of this paragraph as follows: XPS is a valuable diagnostic tool for the characterization of the surfaces of the organic charge-transfer salt TTF-TCNQ. Both the elemental and line shape analysis point to the fact that we are dealing with perfectly reproducible, well-defined, and hence intrinsic surfaces of metallic character. Determination of the charge transfer per molecule at the surface provides no hint for a significant deviation with respect to the bulk. However, so far nothing is anticipated regarding the question, if the surface electronic properties are really representative for the bulk material.
IV.3 Crystalline surface order and ARPES
From the above paragraph we know that the chemical composition of the surfaces under investigation is stoichiometric. In addition the line shape analysis indicates a metallic surface character. This may hint at long-range crystalline order. To validate this conjecture the method of choice is diffraction with low energy electrons (LEED). This probes the surface atomic order on a lateral scale given by the coherence length which amounts to typically 100 Å. Our attempts to obtain a LEED pattern failed, however. In the light of various scanning tunneling microscopy (STM) studies on both TTF-TCNQ filmsAra95 and as-grown crystal surfacesSleator88 ; Nishiguchi98 we ascribe this lack of observation to the destruction of the ordered surface by the electron beam itself.

That the TTF-TCNQ surfaces indeed are long-range ordered can be inferred from the ARPES measurements depicted in Fig. 6. The left-hand panel shows angle-resolved measurements along the Z-direction, i.e. along the one-dimensional b axis, whereas the series of the right-hand panel was recorded perpendicular to it (including the -point). At the -point two peaks are observed at about 0.19 eV (marked a) and 0.54 eV (marked b), respectively. Looking first at the left-hand panel of Fig. 6 one can follow the dispersion of these two features (the dashed lines are intended as a guide to the eye) both approaching the Fermi energy at an angle around 7∘. Two other features can be identified. Feature c disperses away from the Fermi energy starting at an angle of about 7∘ while feature d seems to be split off feature b at the -point and moves to higher binding energies with increasing angles (see dashed lines).
Switching to the right-hand panel, containing data measured perpendicular to b, a completely different behavior is observed. If one follows again peaks a and b as a function of emission angle starting with the spectrum at the -point essentially no dispersion is observed. The pronounced dispersions along the 1D direction clearly indicate long-range surface order. These together with the lack of any dispersion perpendicular to the 1D axis on the other hand truly reflect the electronic 1D character of the TTF-TCNQ surfaces. We refrain here from a detailed discussion of the observed dispersions along the b axis. We just note that we could demonstrate previously that they can be reconciled within the one-dimensional Hubbard model. Thus the data bear evidence for spin-charge separation where feature a represents the spinon and feature b the holon branch of the excitation spectrum.Claessen02
Rather another issue from our previous work we like to stress here. A comparison of the ARPES derived bands with the results of band calculations based on density functional theory (DFT) showed experimental band widths being larger by about a factor of 2. Otherwise good agreement of the DFT results with bulk properties, e.g. regarding the Fermi vectors as reflected in the periodicity of the CDW, were taken as evidence for a renormalization of the hopping integral and hence the band width at the surface. A possible explanation for the mechanism behind the renormalization might be the following. In the bulk the relatively rigid TTF and TCNQ molecules are tilted in opposite directions around the a direction by 24.5∘ and 34.0∘, respectively. At the surface the Madelung potential is different from the bulk and hence the balance between Coulomb and hybridization interaction may readjust. This most likely involves different tilting angles for the TTF and TCNQ molecules. Indeed it was shown that TTF-TCNQ films sublimed onto mica as a substrate exhibit two kinds of phases.Ara95 One of them was identified with that as known also from STM measurements on crystal surfaces. The other was interpreted with a rearrangement of at least the TCNQ molecules such that they are oriented steeper with respect to the surface. It was argued that both arrangements deviate only slightly in energy from each other. Since it is difficult to determine the actual tilting angles from the STM images if possible at all, it might be well the case that the phase only seen on evaporated thin films is the stabilized bulk phase while the other represents the reconstructed surface of single crystals. We conclude that regardless of the actual reconstruction intrinsic surface effects are important in TTF-TCNQ and reflected in the electronic structure of the surface.
IV.4 VUV-radiation induced surface damage
Radiation induced surface damage both in the VUV and x-ray regime is a well-known but rarely talked about phenomenon in the context of PES. This is due to the fact that any time-dependent spectral changes regardless of their origin are usually unwanted since in most cases they signal some kind of surface degradation and hence hinder the observation of intrinsic surface properties. Up to now only in cases of technological interest such as in the field of polymers there exist a number of systematic studies related to this problem.Briggs90 Nevertheless, for several other even inorganic materials such effects have been reported, in particular at low temperatures.Purdie99 In any case it is important to be aware of this issue, especially using synchrotron radiation where the high photon flux may reduce the time scale on which surface damage occurs down to seconds. In the following we will address some of these aspects for TTF-TCNQ.
Figure 7 displays PES spectra taken at the Fermi vector kF and 60 K using the He I radiation (21.22 eV) of a conventional unmonochromatized hollow-cathode discharge lamp. For each curve the total VUV exposure until the spectrum was recorded is indicated. The observed spectral changes are twofold. First, the intensity of the structure at significantly decreases upon radiation exposure on a time-scale of about 2–3 hrs. Secondly, also the energy position of this structure changes. It shifts by about 50 meV to higher binding energies. That these time-dependent changes are really radiation-induced is shown in the inset of
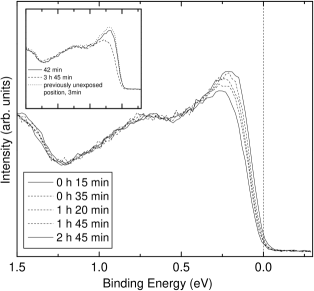
Fig. 7. There it is demonstrated that the spectrum taken on a freshly cleaved crystal after 42 min VUV exposure is fully recovered even after about 4 hrs, if one measures a previously unexposed sample spot. Measurements using synchrotron radiation (not shown) reveal that these degradation effects are predominantly dependent on the photon energy (and not so much on the intensity). Using slightly higher photon energies (25 eV) the tolerable VUV exposure time does not scale with the photon flux compared to the measurements in the lab while 35 eV photons damage the surface within minutes. From this we conclude that there exists a threshold or a resonance energy in the VUV regarding beam damage. The observation that the electron beam of a LEED optics with typical energies above 25 eV destroys the surface almost instantly points to the scattering of the photoexcited electrons rather than to the photoabsorption process itself as the genuine cause for the observed damages. Note that the observed energy shift of the spectral feature at the Fermi energy is intrinsic and not caused by surface charging. From conjugated -electron systems such irradiation effects are well-known and were attributed to the generation of structural and chemical defects, i.e. bond breaking and/or cross-linking.Koch01 These defects hinder the formation of delocalized molecular -orbitals and thus affect first the corresponding states close to .
We make a short remark regarding a more sophisticated explanation of the observed phenomena. We start from the microscopic physical picture of the undestroyed surface in terms of the 1D Hubbard model.Claessen02 Since the 1D Hubbard model and the LL picture are asymptotically equivalent within certain limits Voit95 it is tempting to discuss irradiation damage under the notion of the so-called bounded LL.Voit00 ; Meden00 There the effect of finite chain length onto the spectral properties of a LL is treated. It is conceivable that the irradiation induced defects are local in nature and just have the effect of cutting off the 1D chains. Introducing more and more defects means a continuous decrease of the mean chain length. Hence the spectral changes upon VUV irradiation would reflect the crossover to a bounded LL. Clearly, this issue demands further exploration.
V (TMTSF)2PF6
V.1 Ideal and actual sample surface in direct space
In the case of TTF-TCNQ we have seen that following simple considerations regarding the net charge of the exposed cleavage surface one already gets a clue of how the surface eventually will behave in terms of reconstruction. Our heuristically deduced findings were confirmed by STM imaging and ARPES measurements. The main point was to realize that the natural cleavage plane exposes non-polar surfaces. The situation is different for (TMTSF)2PF6.
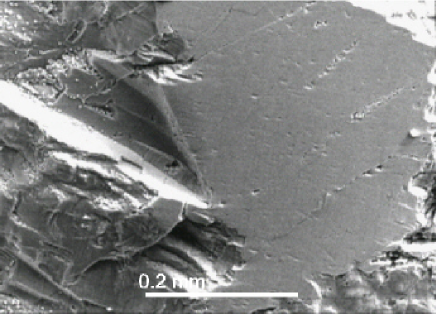
Here the natural surface of as grown crystals is parallel to the (001) plane. The topmost surface layer contains either only TMTSF molecules or PF6 counter ions. Thus it clearly bears a positive or negative net surface charge (cf. Fig. 1) which is energetically highly unfavourable and makes the surface especially susceptible to electronic or atomic reconstruction. The former possibly would lead to a modified charge transfer at the surface changing the electronic properties severely with respect to the bulk. On the contrary, the latter probably would induce quite a high defect density, if there is no easy and unique way to rearrange the surface molecules such that a distinct energy minimum is achieved. Moreover, the polar character of the (001) lattice plane means that in a sense there is no well-defined natural cleavage plane. Instead of cleaving the crystal one will rather rip it off between the (001) lattice planes. It is conceivable that the obtained surfaces will at least be rough and resemble more a fractured surface than being shiny and flat. Actually, this is what we see in an SEM micrograph of an in situ cleaved crystal (s. Fig. 8). However, this does not exclude the possibility of finding areas which are with or without reconstruction undisturbed and well ordered on an atomic scale. Indeed, STM images were reported showing a regular arrangement of molecules.Fainchtein90 However, non-local probes will average over macroscopic length scales and hence may yield another picture.
V.2 Surface characterization by XPS
It was just shown that the surfaces of our cleaved (TMTSF)2PF6 crystals are rather rough compared to the ones of TTF-TCNQ and thus might hinder the observation of dispersing electronic states by means of ARPES. However, the chemical composition should be unaffected by the surface morphology. Again we used XPS for the analysis of the surface stoichiometry. An XPS overview spectrum is displayed in Fig. 9. The most important lines are labeled according to their physical origin. Note that the P 2 and P 2 core levels interfere with various Se-Auger features and thus cannot be clearly discriminated. Otherwise, every line in the spectrum can be identified. Except for C and O (see below) only elements which are constituents of (TMTSF)2PF6 are found. In addition to the main lines plasmon loss features are found corresponding to a plasmon excitation energy of about 22 eV similar to the value seen in TTF-TCNQ.

Due to the overlap of various lines only a limited number of core levels was suited for the determination of the surface composition using the same evaluation method as above for TTF-TCNQ. The results for the cleavage surface which displayed the weakest O signal are summarized in Tab. 2.ann1 We give here the mean of the values which one gets using the cross sections of both Ref. Wagner81, and Yeh85, , respectively. Compared to TTF-TCNQ the discrepancy between the nominal values and those derived from XPS is striking. It amounts to almost 80 % excess of carbon and about 40 % deficiency of Se.
| element [core line] | O [1] | C [1] | Se [3] | F [1] |
|---|---|---|---|---|
| nominal composition | 0 | 20 | 8 | 6 |
| from XPS | 3.3 | 35.5 | 4.5 | 6 |
Moreover, a non-negligible amount of oxygen is observed. We note that all surfaces were freshly prepared. It should be added that the measured compositions of the investigated surfaces scattered unsystematically with relative deviations from the averaged values of Tab. 2 by up to 50 % in contrast to the case of TTF-TCNQ. One thus could be led to suspect that this just reflects the bad quality of our crystals in general. However, measurements of the dc and microwave resistivity as well as electron spin resonance (ESR) data on our samples neatly show the SDW transition at 12 K.Dumm00 The pronounced deviation of the surface composition from the nominal one may be explained by severe reconstructions of at least parts of the surface due to its polar character. Just as well it could be related to processes taking place already during crystal growth, e.g. to the substitution of Se by the chemically equivalent O from the solvent or to microscopic cracks or precipitations (cf. Fig. 8) which are chemically modified. In any case, already from the XPS elemental analysis we must conclude that the surfaces of (TMTSF)2PF6 as exposed by in situ cleavage of well-characterized single crystals are not only not representative for the bulk material, they even are not intrinsic surfaces.
This conclusion is further corroborated, if one has a closer look at the various core lines. The F line is expeditiously treated (s. Fig. 10). A single almost perfectly symmetric line is observed at a binding energy of about 686.6 eV. There exist three crystallographically inequivalent lattice sites for the fluorine atoms whose P–F bond length and angles, however, do not much differ. In addition, the distance of the PF6 complexes to the TMTSF stacks is very large. This excludes a notable chemical shift of the binding energies. Since the PF6 counter ions do not much hybridize with the TMTSF molecules and thus do not participate in forming delocalized conduction bands one would not expect any asymmetry of the F 1 line as well.

Turning to the XPS spectrum of the Se 3 doublet shown in Fig. 10 we only see one single line at about 56.5 eV binding energy because the spin-orbit splitting is too small to be resolved. For similar arguments as above possible chemical shifts in the binding energies of the four inequivalent Se atoms should not be important. The bonding lengths and environment of the Se atoms within the TMTSF molecule are quite the same and their distances to the adjacent TMTSF molecules and PF6 counter ions are large. What is remarkable is the lack of a pronounced asymmetric tail up to higher binding energies as it was observed for TTF-TCNQ and explained by the coupling of the photohole to the conduction electrons. The Se atoms are located on the 1D conducting stacks and a coupling of similar size as in TTF-TCNQ would be expected. This again manifests what we concluded already above from the chemical analysis that apparently the (TMTSF)2PF6 surfaces not at all reflect bulk properties.

We refrain from a thorough discussion of the C 1 line as it overlaps with spectral weight due to Se Auger electrons and discuss it here only in the context of the angle dependence of the various XPS lines (Figs. 10 and 11). In contrast to the F 1 and Se 3 lines the C 1 line shows a significant dependence upon variation of the emission angle. The line is split into two components at about 284.7 eV and 286.6 eV binding energy. The intensity of the latter increases notably at the biggest off-normal emission angle of 70∘ thus indicating a surface species. A similar even more pronounced behavior is observed for the O 1 line at about 533.2 eV. We draw two conclusions from those observations: Firstly, the cleavage surface even if not as good as in the case of TTF-TCNQ is sufficiently well-defined to show angle dependencies at all. An irregularly rough surface as generated by fracture (as opposed to cleavage) of crystals would not display angular dependencies due to the averaging of exit angles and shadowing effects.Briggs90 Secondly, only part of the O signal can be attributed to an O contamination on top of the topmost surface layer. In the same way one can argue that also only part of the C 1 intensity is intrinsic due to the C atoms in the TMTSF molecules, part stems from contamination of the topmost surface layer, and part originates from C contamination built in the crystal e.g. at microcracks.
V.3 Crystalline surface order and ARPES
In the light of the results of the preceeding paragraph it might appear questionable whether one should anticipate long range surface order for (TMTSF)2PF6 at all. In any case, our attempts to see a LEED pattern failed. Obviously, if there was any long range surface order before, it is destroyed by the electron beam as in the case of TTF-TCNQ. Again we could use ARPES to reveal long range order by the observation of dispersing electron states. ARPES spectra along the 1D direction of (TMTSF)2PF6 are shown in the left hand panel of Fig. 12. In the energy range reaching to 2 eV below only one broad structure is observed with a maximum at about

1 eV. This structure sits on a relatively high inelastic background which artificially introduces a small shift to higher binding energies. If one corrects the data for those secondary electrons essentially no dispersion is seen. In the right hand panel of Fig. 12 we have summed up the ARPES spectra to simulate an angle integrated spectrum which can be compared to data previously published by Vescoli et al.Vescoli00 The agreement is almost perfect. In the context of bulk-probing optical and transport data in that paper the strong suppression of spectral weight at as well as the specific power-law decay of the leading edge towards the Fermi level was consistently interpreted as evidence for a LL scenario. Only the exponent governing the power-law decay would come out too high. However, it was argued that this observation together with the absence of any dispersion in related Bechgaard salts should rather be taken as indirect manifestation of the LL phenomenology: while the bulk properties can be reconciled within a standard LL picture, impurities at the surface induce localization of the spin and charge excitations which have to be described by a so-called bounded LL.Voit00 ; Meden00 The finite length chains and the thereby imposed boundary conditions would renormalize and thus explain the unusual high power-law exponent. In the light of our surface analysis we must however conclude that the measured (AR)PES spectra do not represent intrinsic surface let alone bulk properties of the Bechgaard salts.
Our reasoning on the Bechgaard salts in the context of ARPES measurements may be parallelled and further corroborated by the results published so far for the two-dimensional organic BEDT-TTF salts. As in the Bechgaard salts their surfaces comprise either anion or cation layers. Reconstruction/relaxation induced structural modulations have been revealed on the surfaces of various BEDT-TTF based compounds by STM.Ishida01 And again PES fails to see a clear Fermi cut-off in the metallic BEDT-TTF materials and notable dispersion of the electronic excitations close at .Liu95a ; Liu95b ; Soederholm95 ; Soederholm97 ; Sekiyama97 Thus one is led to speculate that it is indeed the influence of surface effects, in particular their polar character, which in many organic charge-transfer salts hampers the observation of the electronic structure intrinsic for the bulk or a well-defined and reproducible surface by means of PES. So PES often may only pretend unconventional electronic behavior as it has been reported previously.
VI Conclusion
In this paper we comprehensively studied the surfaces of two organic charge-transfer salts, TTF-TCNQ and (TMTSF)2PF6, in comparison. Strong limitations regarding employable probing techniques are imposed by their high sensitivity to chemical decomposition due to electron and photon irradiation. We showed that against this background x-ray induced photoemission spectroscopy is a valuable diagnostic tool which does not destroy the surfaces within reasonable time scales and provides information on surface contaminations, surface stoichiometry, and even metallicity of the surface. Thus it is possible to decide if such a surface most probably exhibits intrinsic – as is the case for TTF-TCNQ – or extrinsic – as is the case for (TMTSF)2PF6 – surface properties. In how far intrinsic surfaces represent bulk properties, however, is another question as we demonstrated for TTF-TCNQ. There photoemission spectra of the valence band showed clear indication for renormalized electronic properties at the surface with respect to the bulk. From our investigations we are able to confirm the observation of generic one-dimensional features in terms of spin-charge separation for TTF-TCNQ while we can definitely rule out unambiguous indications of Luttinger liquid behavior in (TMTSF)2PF6 as stated previously.
Acknowledgements.
We gratefully acknowledge financial support by the Deutsche Forschungsgmeinschaft (DFG) under CL 124/3-2.References
- (1) J. Voit, Rep. Prog. Phys. 58, 977 (1995).
- (2) B. Dardel, D. Malterre, M. Grioni, P. Weibel, Y. Baer, and F. Lévy, Phys. Rev. Lett. 67, 3144 (1991).
- (3) Y. Hwu, P. Alméras, M. Marsi, H. Berger, F. Lévy, M. Grioni, D. Malterre, and G. Margaritondo, Phys. Rev. B 46, 13624 (1992).
- (4) B. Dardel, D. Malterre, M. Grioni, P. Weibel, Y. Baer, J. Voit, and D. Jérôme, Europhys. Lett. 24, 687 (1993).
- (5) C. Coluzza, H. Berger, P. Alméras, F. Gozzo, G. Margaritondo, G. Indlekofer, L. Forro, and Y. Hwu, Phys. Rev. B 47, 6625 (1993).
- (6) R. Claessen, G.-H. Gweon, F. Reinert, J. W. Allen, W. P. Ellis, Z. X. Shen, C. G. Olson, L. F. Schneemeyer, and F. Lévy, J. Electron Spec. Rel. Phenom. 76, 121 (1995).
- (7) A. Sekiyama, A. Fujimori, S. Aonuma, H. Sawa, and R. Kato, Phys. Rev. B 51, 13899 (1995).
- (8) T. Takahashi, T. Yokoya, A. Chainani, H. Kumigashira, O. Akaki, and R. Kato, Phys. Rev. B 53, 1790 (1996).
- (9) G.-H. Gweon, J. W. Allen, R. Claessen, J. A. Clack, D. M. Poirier, P. J. Benning, C. G. Olson, W. P. Ellis, Y.-X. Zhang, L. F. Schneemeyer, J. Marcus, and C. Schlenker, J. Phys.: Condens. Matter 96, 9923 (1996).
- (10) F. Zwick, S. Brown, G. Margaritondo, C. Merlic, M. Onellion, J. Voit, and M. Grioni, Phys. Rev. Lett. 79, 3982 (1997).
- (11) F. Zwick, D. Jérome, G. Margaritondo, M. Onellion, J. Voit, and M. Grioni, Phys. Rev. Lett. 81, 2974 (1998).
- (12) V. Vescoli, F. Zwick, W. Henderson, L. Degiorgi, M. Grioni, G. Gruner, and L. K. Montgomery, Eur. Phys. J. B 13, 503 (2000).
- (13) R. Claessen, M. Sing, U. Schwingenschlögl, P. Blaha, M. Dressel, and C. S. Jacobsen, Phys. Rev. Lett. 88, 096402 (2002).
- (14) J. B. Torrance, in: Low-Dimensional Conductors and Superconductors, edited by D. Jérome and L. G. Caron, NATO ASI series. Series B Vol. 155 (Plenum Press, New York, 1987).
- (15) M. Ishida, O. Takeuchi, T. Mori, and H. Shigekawa, Phys. Rev. B 64, 153405-1 (2001).
- (16) S. Kagoshima, H. Nagasawa, and T. Sambongi, One-Dimensional Conductors, (Springer, Berlin, 1988).
- (17) J. Moser, M. Gabay, P. Auban-Senzier, D. Jérôme, K. Bechgaard, and J. M. Fabre, Eur. Phys. J. B 1, 39 (1998).
- (18) T. J. Kistenmacher, T. E. Phillips, and D. O. Cowan, Acta Crystallogr., Sect. B 30, 763 (1974).
- (19) N. Thorup, G. Rindorf, H. Soling, and K. Bechgaard, Acta Crystallogr., Sect. B 37, 1236 (1981).
- (20) C. D. Wagner, L. E. Davis, M. V. Zeller, J. A. Taylor, R. H. Raymond, and L. H. Gale, Surf. Interface Anal. 3, 211 (1981).
- (21) J. J. Yeh and I. Lindau, At. Data and Nucl. Data Tables 32, 1 (1985).
- (22) J. F. Moulder, W. F. Stickle, P. E. Sobol, K. D. Bomben, Handbook of X-ray Photoelectron Spectroscopy, Eden Prairie, 1992.
- (23) S. Doniach and M. Šunjić, J. Phys. C 3, 285 (1970).
- (24) S. Hüfner, Photoelectron Spectroscopy, Solid-State Sciences, Vol. 82, (Springer, Berlin, 1996).
- (25) M. A. Butler, J. P. Ferraris, A. N. Bloch, and D. O. Cowan, Chem. Phys. Lett. 24, 600 (1974).
- (26) J. Fraxedas, J. Caro, A. Figueras, P. Gorostiza, and F. Sanz, J. Vac. Sci. Technol. A 16, 2517 (1998).
- (27) W. D. Grobman, R. A. Pollak, D. E. Eastman, E. T. Maas, Jr., and B. A. Scott, Phys. Rev. Lett. 32, 534 (1974).
- (28) A. J. Epstein, N. O. Lipari, P. Nielsen, and D. J. Sandman, Phys. Rev. Lett. 34, 914 (1975).
- (29) R. S. Swingle, II, R. P. Groff, and B. M. Monroe, Phys. Rev. Lett. 35, 452 (1975).
- (30) R. M. Metzger and A. N. Bloch, J. Chem. Phys. 63, 5098 (1975).
- (31) A. J. Epstein, N. O. Lipari, D. J. Sandman, and P. Nielsen, Phys. Rev. B 13, 1569 (1976).
- (32) W. D. Grobman and B. D. Silverman, Solid State Commun. 19, 319 (1976).
- (33) J. J. Ritsko, A. J. Epstein, W. R. Salaneck, and D. J. Sandman, Phys. Rev. B 17, 1506 (1978).
- (34) C. Rojas, J. Caro, M. Grioni, and J. Fraxedas, Surf. Sci. 482-485, 546 (2001).
- (35) J. M. Lindquist and J. C. Hemminger, J. Phys. Chem. 92, 1394 (1988).
- (36) I. Ikemoto, T. Sugano, and H. Kuroda, Chem. Phys. Lett. 49, 45 (1977).
- (37) For TMTTF-TCNQ cf. M. Tokumoto, N. Koshizuka, H. Anzai, and T. Ishiguro, J. Phys. Soc. Jpn. 51, 332 (1982).
- (38) N. Ara, A. Kawazu, H. Shigekawa, K. Yase, and M. Yoshimura, Appl. Phys. Lett. 66, 3278 (1995).
- (39) T. Sleator and R. Tycko, Phys. Rev. Lett. 60, 1418 (1988).
- (40) T. Nishiguchi, M. Kageshima, N. Ara-Kato, and A. Kawazu, Phys. Rev. Lett. 81, 3187 (1998).
- (41) D. Briggs and M. P. Seah, Edts., Practical Surface Analysis, Vol. 1, (Wiley, New York, 1990).
- (42) D. Purdie, M. Garnier, M. Hengsberger, and Y. Baer, J. Electron Spectrosc. Relat. Phenom. 101-103, 223 (1999).
- (43) N. Koch, D. Pop, R. L. Weber, N. Böwering, B. Winter, M. Wick, G. Leising, I. V. Hertel, and W. Braun, Thin Solid Films 391, 81 (2001).
- (44) J. Voit, Y. Wang, and M. Grioni, Phys. Rev. B 61, 7930 (2000).
- (45) V. Meden, W. Metzner, U. Schollwöck, O. Schneider, T. Stauber, and K. Schönhammer, Eur. Phys. J. B 16, 631 (2000).
- (46) R. Fainchtein and J. C. Murphy, J. Vac. Sci. Technol. B 9, 1013 (1990).
- (47) To determine the correct amount of carbon 10 % of the area under the C 1 peak was estimated to stem from underlying Se Auger excitations.
- (48) M. Dumm, A. Loidl, B. W. Fravel, K. P. Starkey, L. K. Montgomery, and M. Dressel, Phys. Rev. B 61, 511 (2000).
- (49) R. Liu, H. Ding, J. C. Campuzano, H. H. Wang, J. M. Williams, and K. D. Carlson, Phys. Rev. B 51, 6155 (1995).
- (50) R. Liu, H. Ding, J. C. Campuzano, H. H. Wang, J. M. Williams, and K. D. Carlson, Phys. Rev. B 51, 13000 (1995).
- (51) S. Söderholm, P. R. Varekamp, and D. Schweitzer, Phys. Rev. B 52, 9629 (1995).
- (52) S. Söderholm, R. T. Girard, and D. Schweitzer, Phys. Rev. B 55, 4267 (1997).
- (53) A. Sekiyama, T. Susaki, A. Fujimori, T. Sasaki, N. Toyota, T. Kondo, G. Saito, M. Tsunekawa, T. Iwasaki, T. Muro, T. Matsushita, S. Suga, H. Ishii, and T. Miyahara, Phys. Rev. B 56, 9082 (1997).