Picosecond Nonlinear Relaxation of Photoinjected Carriers
in a Single GaAs/Al0.3Ga0.7As Quantum Dot
Abstract
Photoemission from a single self–organized GaAs/Al0.3Ga0.7As quantum dot (QD) is temporally resolved with picosecond time resolution. The emission spectra consisting of the multiexciton structures are observed to depend on the delay time and the excitation intensity. Quantitative agreement is found between the experimental data and the calculation based on a model which characterizes the successive relaxation of multiexcitons. Through the analysis we can determine the carrier relaxation time as a function of population of photoinjected carriers. Enhancement of the intra–dot carrier relaxation is demonstrated to be due to the carrier–carrier scattering inside a single QD.
pacs:
78.47.+p, 78.67.Hc, 73.21.LaSemiconductor quantum dots (QDs) are designable mesoscopic atoms easily integrable in bulk electronics. These zero–dimensional structures, being solid state systems with an atomic–like density of states, have attracted large interest as possible efficient replacements of other quantum heterostructures for standard optoelectronic devices. Recently a more general prospective has been addressed, aiming to exploit the specific features of QDs for a new generation of novel devices. Examples of this new trend are in the field of quantum cryptography Moreau et al. (2001) and quantum computing Bayer et al. (2001), based on single QD (SQD) devices. Within this framework it is obvious that the main effort in QD research has been focused on the comprehension and the control of SQD properties. Studies of the phase relaxation Besombes et al. (2001), the spectral diffusion Seufert et al. (2000) and the carrier–carrier correlation Bacher et al. (1999); Bayer et al. (2000); Dekel et al. (2000a, b) are nowadays the focus of attention in QD basic research.
In this paper we study the ultrafast nonlinear properties on the carrier relaxation inside a single QD. The SQD emission transients are resolved with ps time resolution and interpreted in terms of the successive transition between the correlated few–exciton states. Quantitative analysis on the SQD emission allows us to determine the temporal dependence of the carrier population confined in a single dot. This permits us to show a strict correlation between the intrinsic carrier energy relaxation and the number of photoinjected carriers. We demonstrate that the intra–dot carrier–carrier scattering process is responsible for the efficient carrier relaxation in semiconductor QDs.
The samples are GaAs/Al0.3Ga0.7As self–assembled QDs grown by modified droplet epitaxy (MDE) Koguchi et al. (1991); Watanabe et al. (2000). MDE is a non–conventional growth method for self–assembling QDs even in lattice matched systems Watanabe et al. (2000). By modifying the surface reconstruction and the adatom mobility it is possible to obtain QD samples with a density as low as cm-2. Surface and cross sectional high resolution scanning electron microscope images demonstrate the formation of pyramidal shape nanocrystals of 16 nm height and 20 nm base Watanabe et al. (2001).
The optical measurement was performed with a fs mode–locked Ti–sapphire laser of 76–MHz repetition rate. A second–harmonic beam of the laser output ( nm) was used for excitation. This beam was loosely focused on the sample by a conventional lens of 200 mm. The emitted signal was collected by a microscope objective of N.A. = 0.5. The present configuration allows one to irradiate the sample homogeneously inside the detection spot, and to determine the power density with precise accuracy. The spatial resolution was m, causing QDs to be collected on average. The signal was dispersed by a polychromator, and detected by a synchronously scanning streak camera. The temporal and spectral resolution was 15 ps and 0.8 meV, respectively. The sample was attached to a cold finger of a He–flow cryostat. All experiments were performed at 3.5 K.
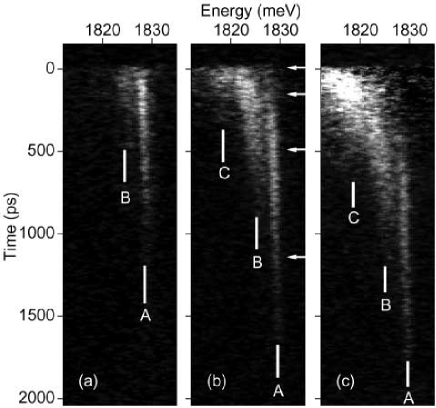
Figure 1 shows a series of time–resolved SQD emission in a linear gray scale at various excitation powers, Pexc. These emissions originate from the recombination of an electron (and a hole) which is in the lowest–energy QD state. As is clearly shown, a highly nonlinear behavior and peculiar temporal dynamics appear on the SQD emission. At low excitation, P nJ/cm2, Fig. 1(a) exhibits a narrow line, defined as A, and a weak band, defined as B, at the low–energy side of A. Both components decrease monotonically with time, although the B band decays much faster than the A line. With increasing excitation power to 150 nJ/cm2 (Fig. 1(b)), the B band appears as strong as A, and an additional rapid–decay component, defined as C, emerges at the lower energy. Simultaneously, the temporal shape of A tends to be stretched, and the finite rise profile is evidently resolved. After nearly 500 ps the spectral evolution is almost identical with that of the lower excitation case. On increasing the irradiation, as in Fig. 1(c), the broad C band dominates the transient stage of emission, and the rise of A and B is found to be slower. It is worth noting that the present features are common to all the SQD emissions, independent of their energy or dot size.
The temporal behavior of SQD emission is characterized by the transient PL spectra reported in Fig. 2(a). We selected four spectra from the PL trace at P nJ/cm2, indicated by the white arrows in Fig. 1(b). The spectra show that: (i) the broad C band together with the B band dominates the early stage of the emission; (ii) the C band rapidly fades away with time; and finally, (iii) in the long time limit, the B band is totally replaced by the A line. Temporal development of these emission bands are reported in Figs. 2(c) and 2(d) for two different excitation powers. In the transient spectra, we also resolve a red shift of the A line (0.8 meV, presented by vertical lines in Fig. 2(a)) and a narrowing of the B band with increasing time. These observations suggest that A and B originate from multiple components which are not spectrally resolved. This speculation is supported by the high–resolution SQD spectra with cw excitation, reported in Fig. 2(b). In fact, the high–resolution spectra exhibit two lines split by 0.8 meV in the A–line region, while four lines characterize the B–band region. When the irradiation is weak enough, the highest–energy line appears alone, and with increasing irradiation, other lower–energy lines take place. Note that a very similar spectral profile is obtained for Figs. 2(a) and 2(b), although a different QD was captured.
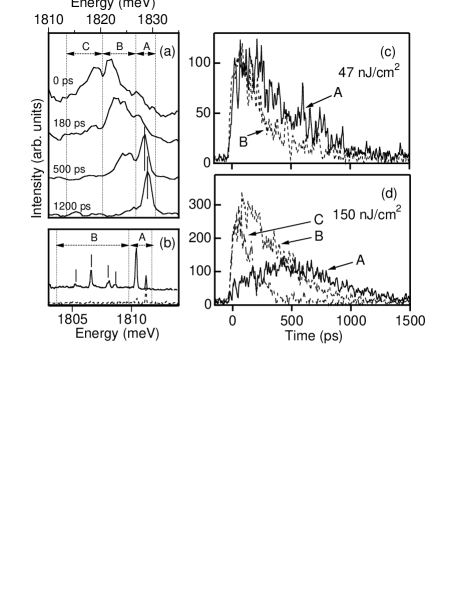
The transient emissions are therefore characterized by three components: the long lasting, high energy A line at 1828 meV, the B line at 1823 meV, and the fast and broad C band whose energy depends on the excitation power and delay time. This peculiar evolution can be attributed to multiexcitonic effects. The presence of more than one exciton in the QD determines the splitting and the red shift of the emission energy of the QD ground state transition. In fact, the carrier exchange interaction leads to a progressive decrease of emission energy when increasing the number of excitons in the QD, although a certain reduction is expected due to correlation effects Williamson et al. (2001). Thus, when the number of excitons increases, more lines appear in the low energy side of the fundamental single exciton transition. Within this framework we attribute the doubly degenerate A line to single exciton and biexciton recombinations, and the four–fold degenerate B band to the recombinations when the total number of excitons is between 3 and 6. A larger number of excitons captured in the QD give rise to the C band. These attributions reproduce the power dependence of the SQD emissions well, as will be discussed later.
It is noteworthy that the multiexciton complex has been first explored in bulk indirect semiconductors weakly doped by impurities Sauer (1973); Thewalt and Rostworowski (1978). In this case multiple carriers are bound by the Coulomb interaction, and their eigen-state is described by the shell model, which specifies the relative motion of carriers Kirczenow (1977). For the case of QDs, on the other hand, multiple carriers are bound mainly due to the quantum confinement, and the shell structure is simply given by the confinement sublevels determined for a single carrier. The carrier–carrier correlation reflects in the renormalization of the single carrier levels. In the present QDs, the energy split between the lowest energy shell (s shell) and the second-lowest one (p shell) is 80 meV, and we focus on the recombination of an electron (and a hole) occupied in the s shell, which is modified by the correlation with the other carriers.
To perform a quantitative discussion, we analyze the time evolution of the SQD PL using a model based on the successive transitions between the multiexciton states. Since our observations suggest that the transient SQD spectrum is solely determined by the population of excitons at a specific time, the emission dynamics are described by a set of rate equations Sauer (1973); Dekel et al. (2000b), , where is the probability to find excitons inside the QD, and is the X transition rate – hereafter X indicates the recombination with excitons inside the QD. We also adopt the realistic assumption that the number of photoinjected carriers are statistically distributed, and it is given by the Poisson distribution, so that , where represents the average number of photoinjected carriers Sauer (1973).
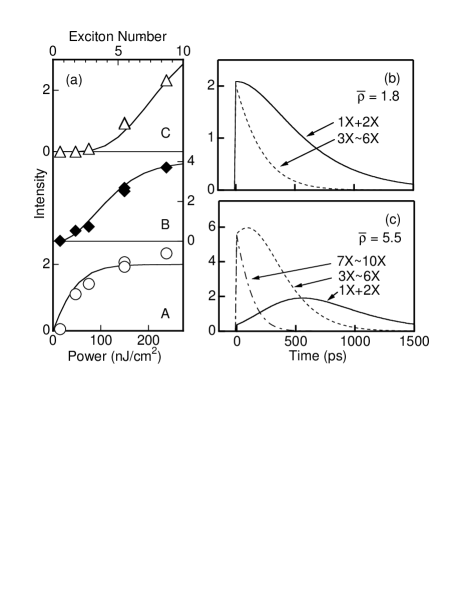
The efficiency of photoinjection was extracted by analyzing the time–integrated (TI) intensities of the SQD emissions. Variations of the TI intensities for the A–, B–, and C emission bands are presented in Fig. 3(a), together with the calculations based on the above model. The best fit to the data gives an efficient carrier–capturing cross section, , of cm2. With the use of , the number of photoinjected carriers is given by the multiplication of with the photon flux, or the carrier density at the sample surface. The present procedure allows us to determine the carrier population inside the QD. It was found that the magnitude of is consistent with a result of the PL yield measurement of the present sample, and of the same order with that of the InAs/GaAs QDs reported in Ref. Dekel et al., 2000b.
To interpret the temporal evolution of the SQD emission, is solved numerically. For simplicity we assume that the transition rate of the multiexciton state is given by the summation of the relevant single–carrier recombination rates. In this treatment, dynamics of up to 10 excitons are specified using the three lowest inter–shell (s–, p–, and another higher shell) transition rates as free parameters. In Figs. 3(b) and 3(c), the best fits of the data (Figs. 2(c) and 2(d)) are presented, where the transition times for the s–, p–, and the higher energy shell are derived as 400 ps, 600 ps, and 300 ps, respectively, by an accuracy of 20 %. Excellent agreement between calculation and the data supports the validity of the assumption that the multiexciton transition strength, i.e., overlapping between the few electron–hole pairs, is not strongly modified by the carrier–carrier correlation.

The rise characteristics of the SQD emissions are shown in Fig. 4. Here we plot a phenomenological rise time, , by measuring the time delay needed for each emission band to reach its maximum, as a function of average number of photoinjected carriers. Note that is roughly three to four times larger than the conventional rise time, , obtained by a single–exponential fit. The C band indicates the fastest rise time ( ps), close to our time resolution limit. The A band and the B band show an increase in rise time when the exciton number is larger than two. This delay feature is understood by the present model based on the successive relaxation of multiexcitons: the emission of the X band starts only when the internal excitons decrease to , through several recombinations after pulse excitation, thus resulting in a delay of the X onset time. The observed behavior of the emission rise for is well reproduced by the calculation using the parameters described above. On the other hand, in the case of low carrier injection, , the experimental rise time is instead longer than the predicted one. It is therefore suggested that the intra–dot carrier relaxation to the ground–state configuration is evidently slowed down in the absence of multiple carriers inside the QD. This phenomenology is strictly related to the well–known PL characteristics observed by the ensemble QD experiment. In this case, the emission rise time, , increases to several 10 ps at weak excitation density. With increasing density, on the other hand, the PL rise is observed to be fast. The commonly accepted interpretation is that the intra–dot relaxation is enhanced due to the Auger–like scattering of photoinjected carriers involving continuum electronic states Morris et al. (1999); Uskov et al. (1998); Raymond et al. (2000).
Our SQD data is consistent with the result of ensemble QD measurements, which generally show a monotonic decrease in PL rise time with photoinjection intensity Sanguinetti et al. (2002). In addition, by resolving the SQD emission dynamics we obtain a different and more precise picture of the intrinsic relaxation process. The speeding up of the carrier energy relaxation occurs whenever the number of excitons in the SQD is larger than few unities. At low carrier injection, when there is less than two excitons per QD (in this case the B band is weak or not resolved), the carrier relaxation to the ground state is relatively slow and almost independent of the excitation power. The B band already shows a fast rise at the minimum injection needed for detection. With increasing photoinjection, the C band becomes the dominant contribution of the SQD emission (the A and B bands appear only at very long delay times). Contribution of the all SQD emission bands leads to the monotonic decrease in the PL rise time, found in the ensemble averaged measurement. These results demonstrate that the shortening of the rise time of the QD emission stems from a multiexciton recombination, which cannot be resolved in standard PL of the QD ensemble, due to the large inhomogeneous broadening. At the same time our data show that the Auger–like processes effective in the QD relaxation should be associated to carrier–carrier scattering inside the QD Ferreira and Bastard (1999); Sanguinetti et al. (2002), rather than that involving the carrier population in the wetting layer and/or barrier states, as usually considered in the literature Morris et al. (1999); Uskov et al. (1998); Raymond et al. (2000).
In conclusion, we have determined the nonlinear carrier dynamics in a single quantum dot by means of PL measurements with picosecond time resolution. Effects of the multiexciton dynamics leads to strong nonlinearities in the SQD emission. The observed behavior stems from successive relaxation dynamics of multiexcitons. Moreover, the efficient intra–dot relaxation has been shown to be due to the nonlinear interaction between carriers inside a QD. We believe that the investigation of transient SQD emissions allows us to get deeper understandings on the ultrafast carrier dynamics in zero dimensional semiconductor systems.
References
- Moreau et al. (2001) E. Moreau, I. Robert, J. M. Gerard, I. Abram, L. Manin, and V. Thierry-Mieg, Appl. Phys. Lett. 79, 2865 (2001).
- Bayer et al. (2001) M. Bayer, P. Hawrylak, K. Hinzer, S. Fafard, M. Korkusinski, Z. R. Wasilewski, O. Stern, and A. Forchel, Science 291, 451 (2001).
- Besombes et al. (2001) L. Besombes, K. Kheng, L. Marsal, and H. Mariette, Phys. Rev. B 63, 155307 (2001).
- Seufert et al. (2000) J. Seufert, R. Weigand, G. Bacher, T. Kuemmell, A. Forchel, K. Leonardi, and D. Hommel, Appl. Phys. Lett. 76, 1872 (2000).
- Bacher et al. (1999) G. Bacher, R. Weigand, J. Seufert, V. D. Kulakovskii, N. A. Gippius, A. Forchel, K. Leonardi, and D. Hommel, Phys. Rev. Lett. 83, 4417 (1999).
- Bayer et al. (2000) M. Bayer, O. Stern, P. Hawrylak, S. Fafard, and A. Forchel, Nature 405, 923 (2000).
- Dekel et al. (2000a) E. Dekel, D. Gershoni, E. Ehrenfreund, J. M. Garcia, and P. M. Petroff, Phys. Rev. B 61, 11009 (2000a).
- Dekel et al. (2000b) E. Dekel, D. V. Regelman, D. Gershoni, E. Ehrenfreund, W. V. Schoenfeld, and P. M. Petroff, Phys. Rev. B 62, 11038 (2000b).
- Koguchi et al. (1991) N. Koguchi, S. Takahashi, and T. Chikyow, J. Cryst. Growth 111, 688 (1991).
- Watanabe et al. (2000) K. Watanabe, N. Koguchi, and Y. Gotoh, Jpn. J. Appl. Phys. 39, L79 (2000).
- Watanabe et al. (2001) K. Watanabe, S. Tsukamoto, Y. Gotoh, and N. Koguchi, J. Cryst. Growth 227–228, 1073 (2001).
- Williamson et al. (2001) A. J. Williamson, A. Franceschetti, and A. Zunger, Europhys. Lett. 53, 59 (2001).
- Sauer (1973) R. Sauer, Phys. Rev. Lett. 31, 376 (1973).
- Thewalt and Rostworowski (1978) M. L. W. Thewalt and J. A. Rostworowski, Phys. Rev. Lett. 41, 808 (1978).
- Kirczenow (1977) G. Kirczenow, Can. J. Phys. 55, 1787 (1977).
- Morris et al. (1999) D. Morris, N. Perret, and S. Fafard, Appl. Phys. Lett. 75, 3593 (1999).
- Uskov et al. (1998) A. V. Uskov, , J. McInerney, , F. Adler, H. Schweizer, and M. H. Pilkuhn, Appl. Phys. Lett. 72, 58 (1998).
- Raymond et al. (2000) S. Raymond, K. Hinzer, S. Fafard, and J. L. Merz, Phys. Rev. B 61, 16331 (2000).
- Sanguinetti et al. (2002) S. Sanguinetti, K. Watanabe, T. Tateno, M. Wakaki, N. Koguchi, T. Kuroda, F. Minami, and M. Gurioli, Appl. Phys. Lett. 81, 613 (2002).
- Ferreira and Bastard (1999) R. Ferreira and G. Bastard, Appl. Phys. Lett. 74, 2818 (1999).