Electron-phonon interaction in transition metal diborides B2 (=Zr, Nb, Ta) studied by point-contact spectroscopy
Abstract
The electron-phonon interaction (EPI) in transition metal diborides B2 (=Zr, Nb, Ta) is investigated by point-contact (PC) spectroscopy. The PC EPI functions were recovered and the EPI parameters were estimated for all three compounds. Common and distinctive features between the EPI functions for those diborides are discussed also in connection with the superconductivity in MgB2.
pacs:
63.20.Kr, 72.10.Di, 73.40.JnIntroduction. The recent discovery of superconductivity in MgB2 at 39 K by Akimitsu (see Nagamatsu et al. Nagam ) renewed the interest in electron transport measurements and activated a search for superconductivity in other diborides. According to a recent review Buzea no superconducting transition has been observed so far in diborides of transition metals B2 ( = Ti, Zr, Hf, V, Cr, Mo). Only NbB2 is expected to superconduct with a rather low transition temperature 1 K and contradictory reports about superconductivity up to = 9.5 K in TaB2 can be found in the literature (see, e. g., Refs. 2, 3 and further Refs. therein). Finally, the reported = 7 K in ZrB2 Gaspa encourages further studies of these three diborides.
The goal of this paper is to determine the electron-phonon interaction (EPI) function for selected diborides by means of point-contact (PC) spectroscopy in order to address the above mentioned issues about superconductivity in these compounds. The measurement of the nonlinear conductivity of PC‘s between two metals allows us, in a direct way Yanson , to recover the PC EPI function . The knowledge of for conducting systems provides a consistent check for the possibility of a phonon-mediated pairing mechanism, e.g., by an estimation of the electron-phonon-coupling strength characterized by the EPI parameter . From a comparison of the experimentally determined with theoretical calculations, different models and approaches can be discriminated. Thus the PC spectroscopy could be helpful to understand details of the EPI in the diborides under consideration, and to evaluate contradictory reports about possible superconductivity within this family.
Experimental details. We have used single crystals of B2 (=Zr, Nb, Ta) grown by the rf-heated floating-zone methodOtani . Samples were prepared using a diamond wire saw. The residual resistivity and the RRR of B2 are shown in Table I.
The experimental cell with the sample holders, which allows mechanical movements of electrodes by differential screw mechanism, was placed directly in liquid 4He to ensure good thermal coupling. The PC‘s were established in situ at low temperatures by a touching of the cleaved surface of B2 by the edge of another single crystals. We did not control the mutual orientation of electrodes; therefore, the contact axis was not determined with respect to the definite crystallographic direction. However, we did not observe an appreciable variation of the maxima position (see additional remarks for NbB2 at the end of discussion below) and their relative intensity in the spectra for different contacts. Therefore, we believe the anisotropy is not crucial. Both the differential resistance dd and the second derivative of the characteristic d/d vs were registered using a standard lock-in technique. The zero-bias resistance of investigated contacts ranged from a few ohms up to several tens of ohms at 4.2 K.
| Samples111For NbB2, the estimated was two orders of magnitude larger compared to the other diborides probably due to the presence of inner cracks. Therefore, corresponding cells in the Table I are empty. | , m | RRR | 222The density of carriers was estimated by the number of valence electrons (4 for ZrB2, 5 for NbB2 and TaB2) per volume of the corresponding unit cell. , m-3 | |
|---|---|---|---|---|
| ZrB2 | 3.31 | 24 | 13 | |
| NbB2 | - | - | 18.2 | |
| TaB2 | 220 | 1.2 | 18.6 |
Results and discussion. The voltage applied to the ballistic contact defines the excess energy e of electrons; therefore, for some of them backscattering processes caused by the creation of phonons can take place. This results in a decrease of the net current through the contact and leads to a nonlinear characteristic. According to the theory of Kulik, Omelyanchouk and ShekhterKOS in this case the second derivative - d/d of the curve at low temperatures is proportional to . In the free electron approximationKulik
| (1) |
where , , roughly speaking, measures the interaction of an electron with one or another phonon branch. The kinematic restriction of electron scattering processes in a PC is taken into account by the factor , where is the angle between initial and final momenta of scattered electrons [for transport and Eliashberg EPI functions the corresponding factors are: and =1, respectively]. Therefore in PC spectra the large angle scattering (back-scattering) processes of electrons dominate.
From Eq.(1) EPI function can be expressed via the measured rms signal of the first and second harmonics of a small alternating voltage superimposed on the ramped dc voltage :
| (2) |
The PC diameter , appearing in Eqs.(1) and (2), determines the constriction resistance which consists of a sum of the ballistic Sharvin and the diffusive Maxwell terms according to the simple formula
| (3) |
derived by WexlerWexler , which is commonly used to estimate the PC diameter . Here e2, where is the Fermi momentum, is the density of charge carriers.
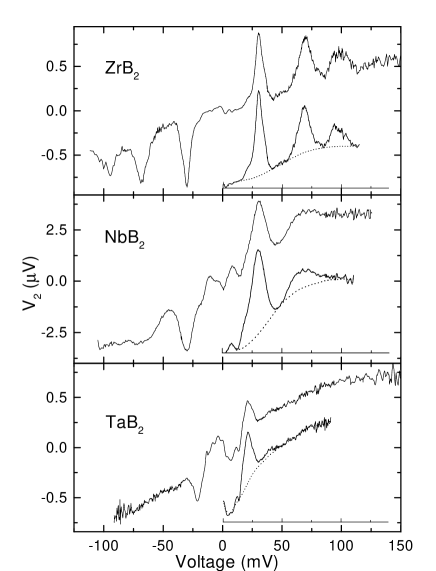
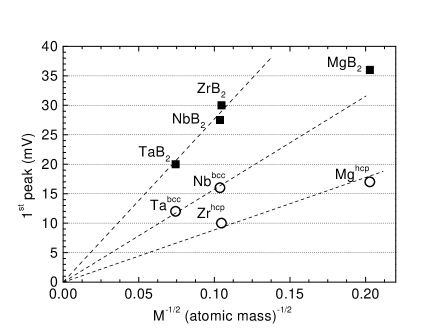
Representative examples of measured d/d dependencies are shown in Fig. 1. Among tens of curves, which show reproducible phonon structure for each compound, we selected d/d characteristics with the most pronounced and intensive maxima. A common feature for all crystals is the presence of the main low energy maximum placed at about 30, 28 and 20 mV for ZrB2, NbB2 and TaB2, respectively. This is in line with the common consideration that at fixed spring constants the phonon frequency decreases with increasing atomic mass (see Fig. 2). Such a behavior suggests that the first peak corresponds to the vibration of transition metal. Curiously, on the one hand, the aforementioned peaks appear just above the maximal phonon energy on PC spectra of the corresponding clean metals: Zr Zr , Nb and Ta from Ref.10 (see Table II). On the other hand, the neutron data peak position for MgB2 on Fig. 2, at about 36 meV Osborn , is far below the straight line connecting the B2 compounds. This might be considered a consequence of a softening of the corresponding spring constants, i. e. metallic bonds in MgB2 instead of relatively strong B covalent bonds in the B2 series. Notice that the recent dataBobrov recovered maxima in the PC spectra of MgB2 even at lower energy of about 30 and 20 meV. This cannot be occasional. It points either to peculiarities in the lattice dynamics of MgB2 since such peaks are missing in standard first-principle phonon calculations Kong ; Heid or to the presence of other, nonphononic, low-frequency bosonic excitations Shulga . It is noteworthy that the presence of such anomalous low-energy modes has also been noticed by other experimental techniques: Raman scatteringvarelogiannis and tunneling measurementsDyachenko . Their relationship to its high critical temperature remains unclear at present.
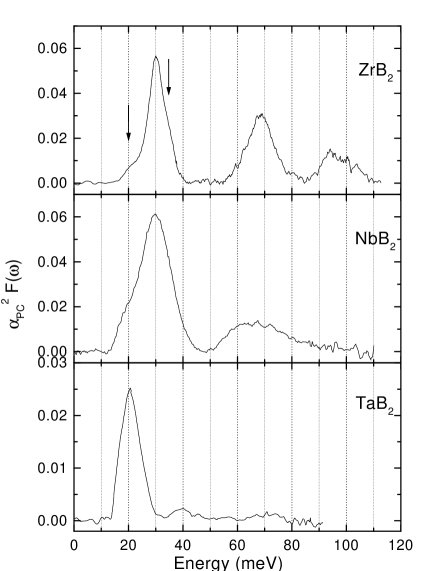
Because of the large mass difference between the transition metal and the boron atoms the boron derived modes are expected to occurat much higher energy. Indeed, for ZrB2 two additional maxima at 70 and 100 mV twophin are well resolved, while for NbB2 the high energy part of the spectrum presents a broad maximum around 60 mV. For TaB2 the high energy phonon peaks were difficult to resolve, although according to a rough estimationRosner the boron in-plane and out-of-plane displacement modes should have energies of 98 and 85 meV, respectively. No spectral features were found for the above-mentioned compounds above 100 meV. This is in line with the measured surface phononsAizava for ZrB2 and NbB2. There all phonon frequencies are below 100 meV. Moreover, for both compounds a phonon dispersion studyAizava demonstrated a gap between 30 and 50 meV which separates acoustic and optic branches. In this energy region a minimum in our PC spectra occurs. Comparing the high energy parts of the ZrB2 and the NbB2 PC spectra, we may support the statementAizava that, for NbB2 the boron surface phonon modes are softer and more complex than in the case of ZrB2. Possibly for this reason in the PC spectra of NbB2 all boron derived modes form broad structureless maxima around 60-70 meV (see Fig. 3).
| Samples | 1st peak | 2nd peak | 3d peak | ||
|---|---|---|---|---|---|
| meV | meV | meV | meV | ||
| ZrB2 | 25 | 0.06 | |||
| NbB2 | - | 28 | 0.08 | ||
| TaB2 | 40? | - | 20 | 0.025 |
To recover the spectral EPI function according to Eq.(2), at first d/d has been transformed into - d/d, and thereafter the background (see Fig. 1, insets) was subtracted. There are a few models, both theoretical and empirical, for the background behaviour. Using our experience with PC spectra of different metals and compounds we have drawn the background simply by eye with a dependence like , as shown in Fig. 1, insets. During this procedure we paid attention to the following: (i) zero-bias anomalies were disregarded; (ii) the background curve is made to touch the measured one at the minimum above the first peak, where a gap between acoustic and optical phonons is expected; and (iii) above 100 mV or below in the case of lacking visible maxima the background coincides with the data. Fig. 3 presents the recovered PC EPI function for the investigated diborides calculated by Eq. (2) with a Fermi velocity m/s. To obtain the PC diameter we used the Sharvin part of the PC resistance from Eq.(3) and the calculated value ee with from Table I. By virtue of the fact that the simplicity of the evaluation of (see Table I footnote) is not crucial for the calculation of and afterward for estimation of the EPI parameter .
It is also seen from Fig. 3 that the upper boundaries of the ZrB2 and NbB2 spectra are at about 110 meV and 90 meV (see Fig. 3), which is much larger than their Debye temperatures of 280 K and 460 K, respectively, estimated from the Bloch-Grüneisen temperature dependence of the resistivityGaspa .
With the EPI function we have calculated the EPI parameter . We should emphasize that, in general, due to presence of the -factor, ; however, for many superconductors it was foundKhot that . As we can see from Table II, is rather low for the diborides lambda . We remark that a small 0.02 were also reported for PC studies of the transition metal silicides NbSi2 and TaSi2 Balkas . The reason for this can be the deviation from the ballistic electron flow and the establishment of a regime with in PC (here is the elastic mean free path of electrons), which adds a prefactorKulYan of the order of in Eq. (1). The large background level and the absence of the high energy peaks, e. g., for the PC spectra of TaB2, may have the same origin: the lack of a ballistic regime in our PC‘s. Also note also, that the TaB2 samples are of relative low quality (their RRR‘s amounts to only 1.2) (see Table I); that is, a small -value is already expected in the bulk. Therefore, for TaB2 we assume that is underestimated. However, in the case of ZrB2, where the PC spectra present distinct peaks up to the maximal energy, and even at the first peak such details as a bump at 20 mV and a shoulder at 35 mV are seen, we believe that our parameter corresponds here to a real state of the arts. Our results also show that NbB2 has the largest among the studied compounds. Thus the search for superconductivity in NbB2 is more interesting. We should note that, among the studied diborides, for NbB2 we observed the largest variation in the position of the first peak. For some PC spectra the peak shifted down to 22-23 mV. In this case any high energy maxima, e. g., at 60 mV, was difficult to resolve. Most likely this is due to disturbed metal structure in the PC area caused by low temperature deformation at the contact formation. In any case the effect of anisotropy has to be studied. Of course, to draw a more weighty conclusion about details of the EPI and the value in the presented B2 family, a theoretical calculation of with the mentioned -factor, and a comparison with experimental data is any desirable.
Finally, we should stress that by investigation of MgB2 thin filmsBobrov the EPI inelastic contribution to the PC spectrum was estimated only in a few percent of the total PC resistance, which is nearly an order of magnitude lower than for the B2 under consideration. Why the EPI features on PC spectra of MgB2 are shallow and hardly reproducible is still unclear at the moment. Possibly this is due to a weak EPI for a 3D-band of the Fermi surface sheet, which determines the PC conductivity of thin filmsYansmgb , along with a small ratio.
Conclusion. We have measured the PC spectra in transition metal diborides: ZrB2, NbB2 and TaB2. The spectra exhibit structure up to an energy of about 100 meV, which is unequivocally caused by phonons. For all compounds the PC EPI function was established and the EPI parameter was calculated. The obtained small values strongly question the reported bulk superconductivity in these compounds. The PC EPI spectra of the above-mentioned diborides differs even qualitatively from that measured earlier for superconducting MgB2.
Acknowledgements. The work in Ukraine was supported by the National Academy of Sciences of Ukraine. The investigations were carried out in part with the help of equipment donated by the Alexander von Humbold Stiftung (Germany). Further thanks to the Deutsche Forschungsgemeinschaft for financial support. Discussions with H. Rosner and S. V. Shulga are grateful acknowledged (S.-L. D.).
References
- (1) J. Nagamatsu et al., Nature (London) 410, 63 (2001).
- (2) C. Buzea and T. Yamashita, Superconductors, Science & Technology, 14, R115-R146 (2001).
- (3) V. A. Gasparov, N. S. Sidorov, I. I. Zver‘kova, and M. P. Kulakov, JETP Lett. 73, 532 (2001).
- (4) I. K. Yanson, Sov. J. Low Temp. Phys. 9, 343 (1983).
- (5) S. Otani, M. M. Korsukova and T. Mitsuhashi, J. Crystal Growth 186, 582 (1998); 194, 430 (1998).
- (6) I. O. Kulik, A. N. Omelyanchouk and R. I. Shekhter, Sov. J. Low Temp. Phys. 3 840 (1977).
- (7) I. O. Kulik, Sov. J. Low Temp. Phys. 18, 302 (1992).
- (8) A. Wexler, Proc. Phys. Soc. (London) 89, 927 (1966).
- (9) PC spectra of Zr were measured by N. L. Bobrov and V. V. Fisun (unpublished).
- (10) A. V. Khotkevich and I. K. Yanson, Atlas of Point Contact Spectra of Electron-Phonon Interaction in Metals (Kluwer Academic Publisher, Boston, 1995).
- (11) N. L. Bobrov, P. N. Chubov, Yu. G. Naidyuk et al., in New Trends in Superconductivity, edited by J. F. Annett and S. Kruchinin, (Kluwer Acad. Publ., 2002) NATO Science Series II: Mathematics, Physics and Chemistry, Vol.67, p.225.
- (12) R. Osborn, E. A. Goremychkin, A. I. Kolesnikov, and D. G. Hinks, Phys. Rev. Lett. 87, 017005 (2001).
- (13) Y. Kong, O. V. Dolgov, O. Jepsen, and O. K. Andersen, Phys. Rev. B 64, 020501 (2001).
- (14) K. B. Bohnen, R. Heid, and B. Renker, Phys. Rev. Lett. 86, 5771 (2001).
- (15) S. V. Shulga et al., cond-mat/0103154.
- (16) D. Lampakis et al., cond-mat/0105447.
- (17) A. I. D’yachenko et al., cond-mat/0201200.
- (18) It turns out that the 3d peak corresponds to the sum of the 1st and the 2nd peaks (95 mV 30 mV + 68 mV). However, our anylysis of two-phonon contributions to the PC spectrum of ZrB2 reject multiple phonon nature of this maximum.
- (19) H. Rosner et al., Phys. Rev. B 64, 144516 (2001).
- (20) T. Aizava, W. Hayami, and S. Otani, Phys. Rev. B 65, 024303 (2001).
- (21) was calculated for a number of PC spectra selected by commonly used in PC spectroscopy criteria Yanson ; Khot . The scattering in was within 20% more likely due to deviation from the ballistic regime. Table II shows the maximal .
- (22) O. P. Balkashin et al., Sol. State Commun. 100, 293 (1996).
- (23) I. O. Kulik and I. K. Yanson, Sov. J. Low Temp. Phys. 4, 596 (1978).
- (24) I. K. Yanson et al., cond-mat/0206170.