Torsional response and stiffening of individual multi-walled carbon nanotubes
Abstract
We report on the characterization of torsional oscillators which use multi-walled carbon nanotubes as the spring elements. Through atomic-force-microscope force-distance measurements we are able to apply torsional strains to the nanotubes and measure their torsional spring constants and effective shear moduli. We find that the effective shear moduli cover a broad range, with the largest values near the theoretically predicted value. The data also suggest that the nanotubes are stiffened by repeated flexing.
pacs:
The motivating vision of the future for nano-electro-mechanical systems (NEMS) Craighead00 ; Erbe01 ; Cleland98 ; Yang01 is the emergence of high frequency, high sensitivity devices which are commercially useful and also will serve as nanolabs for fundamental investigations into physics of the mesoscale. The goal of high mechanical resonance frequency along with high sensitivity (high quality factor ) requires that devices are small (low mass), stiff (high elastic modulus) and structurally defect free (low phonon scattering). Carbon nanotubes (CNTs) may provide several advantages over etched bulk semiconductors in this regard. They are naturally nanometer-scale objects, so little processing of the CNT itself is required. Furthermore, their surfaces are atomically ordered, and they have relatively low chemical reactivity, so they may not suffer from some of the surface-to-volume ratio issues that limit the of semiconductor-based devices Lifshitz00 ; Carr99 .
Because of these factors as well as their unique mechanical and electrical properties Postma01 ; Bachtold01 , CNTs may be ideal candidates for use in NEMS. Nevertheless, there have been only a handful of reports of CNTs used in an electromechanical setting Poncharal99 ; Kim99 . We report here on the incorporation of CNTs into nano-electro-mechanical devices which allows the direct measurement of the CNTs’ torsional properties.
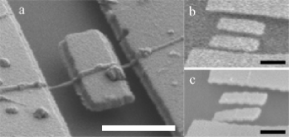
Torsional or ”paddle” oscillators are commonly studied MEMS structures Cleland98 ; Evoy99 ; Carr00 . We fabricate paddle oscillators with multi-walled carbon nanotubes (MWNTs) as the spring elements (Fig. 1). Fabrication is described in detail elsewhere Williams02b . Briefly, MWNTs are dispersed onto silicon wafers which have 400-500 nm of oxide. Electron-beam lithography is used to pattern large metal pads over the two ends of each MWNT to pin them down, and a strip of metal over the center of each MWNT to form the paddle. The metal is thermally evaporated, 15 nm of Cr followed by 100 nm of Au. The oxide is etched such that the paddles are completely undercut but the larger pads pinning the MWNT ends are not Nygard01 . The samples are then critical-point-dried.
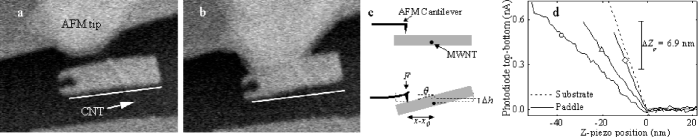
Force measurements are performed in a hybrid atomic force microscope (AFM)/scanning electron microscope (SEM) system; a Thermomicroscopes Observer AFM mounted inside a Hitachi S-4700 cold-cathode SEM. Using coarse-translation motors, we position the AFM tip above a paddle such that the entire paddle is within the range of the AFM scan tube. Vertical force vs. distance curves are taken at positions along the length of the paddle. Figure 2 shows an example of a force vs. distance curve in progress, and typical curves resulting from such measurements. In all of our analyses, we use the data taken while the tip is being extended towards the sample. The data taken during tip retraction are similar. The AFM cantilevers are Si Nanosensor cantilevers with nominal resonance frequencies of 70-80 kHz and force constants N/m.
With the AFM we can apply forces to the paddles and measure their displacements. We use these data to deduce the torsional properties of the MWNT spring-elements. Before performing a quantitative analysis, we check the assumption that the MWNTs twist uniformly along their lengths, rather than being strained in a localized region. We fabricated a device with two paddles suspended from one MWNT (Fig. 1b). When one of the paddles was tilted with the AFM tip such that its end was pinned to the substrate, the other deflected by about half as much (Fig. 1c). The suspended portions of the MWNT are all of similar length, so this suggests that the MWNT is uniformly strained.
To measure force quantitatively with an AFM, we must characterize the AFM cantilever. We measure its dimensions with the SEM and its resonance frequency with the AFM. These values are used to calculate the spring constant () of the cantilever. Also, vertical force-distance traces, which result in linear plots of photodiode signal vs. piezo-distance-traveled (), are taken on the substrate. Under the assumption that the substrate is effectively an infinitely hard surface, the slopes of these traces () give us the relationship between the detector signal and the cantilever deflection (Fig. 2d) Luthi95 .
To characterize an oscillator, vertical force-distance curves are taken on the paddle itself, which yield traces with slopes (Fig. 2d). The force applied to the paddle is and the vertical displacement of the point of contact with the AFM tip is . The torsional compliance of the MWNT can be described by a torsional spring constant (), which relates the applied torque (, where is the lever arm from the axis of the MWNT) to the angular deflection () of the paddle. The vertical compliance can be characterized by a vertical spring constant (), which relates to the vertical displacement () of the MWNT pivot-point paddlestiff :
| (1) |
and combine to yield the displacement of the point of contact with the AFM tip, . Combining these equations, we obtain:
| (2) |
On each paddle, we measure the slopes from a series of force-distance curves at various positions . Equation 2 is fit to the resulting points to yield and .
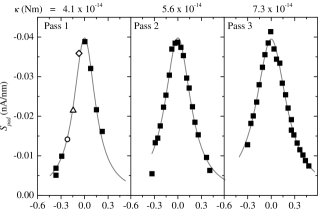
The panels in Fig. 3, from left to right, depict three sets of data consecutively measured on device C. It is surprising, therefore, that changes from one panel to the next. A rise in is seen in all of the devices we measure, and the percent change in from one pass to the next is roughly correlated with the number of deflections performed in the previous pass. values for some of our measurements are summarized in Table 1.
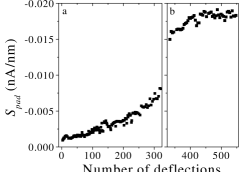
We also positioned the AFM tip near the end of paddle D and repeatedly performed vertical force-distance measurements (Fig. 4). After 330 force curves, the tip was moved away from the device and then returned to within 50 nm of the original position. In spite of the break in the data, the trend is clear; the effective torsional stiffness of the paddle increases until about 400 deflections are performed, and then it saturates, showing a net change in stiffness of about an order of magnitude.
In principle, the MWNT could be accruing amorphous carbon deposited during SEM imaging of the device, but this is unlikely to explain its change in stiffness. In Fig. 3, we imaged the device during pass 1, but we turned off the electron beam for the next two passes, and the stiffness still increased. For the data in Fig. 4, the electron beam was off for most of the measurement, but the stiffness increases smoothly. After the measurements on the paddles were completed, we used the AFM to image the edges of the regions the SEM had been scanning, and saw no topographical step. The AFM has a vertical resolution on the order of 1 nm, so if a significant thickness of carbon had been deposited during the measurement, it would have appeared as a topographical feature in the AFM image. To show that the stiffening is not an instrumental artifact, both and the cantilever resonance frequency were measured before and after each experimental run, and they showed no significant change. Also, we repeatedly deflected one AFM cantilever with another times and saw no change in stiffness. This implies that the repeated twisting of the nanotube is making it stiffer! The shear strain applied to the MWNT was typically . The applied tensile strain was very small.
| Device/pass | ||||
|---|---|---|---|---|
| ( Nm) | (nm) | (GPa) | (GPa) | |
| A/1 | 15 | 15 | 600 | |
| B/1 | 2.4 | 16 | 60 | 830 |
| B/2 | 4.5 | 120 | ||
| B/3 | 4.6 | 120 | ||
| B/4 | 10 | 280 | ||
| B/5 | 22 | 590 | ||
| B/6 | 46 | 1200 | ||
| C/1 | 2.5 | 18 | 15 | 210 |
| C/2 | 3.4 | 20 | ||
| C/3 | 4.4 | 26 | ||
| D111A full pass was not made on paddle D. was estimated from SEM images, and used in Eqn. 2 to calculate . The , , and given are (i) for the first few deflections and (f) for the saturation (See the text and Fig. 4.)/i | 1.4 | 16 | 30 | 430 |
| D111A full pass was not made on paddle D. was estimated from SEM images, and used in Eqn. 2 to calculate . The , , and given are (i) for the first few deflections and (f) for the saturation (See the text and Fig. 4.)/f | 17 | 400 |
Most existing studies focus on the tensile properties of CNTs; we look to these results to gain some insight. Experiments have shown that MWNTs can withstand tensile strains of between 10% and 20% before breaking Falvo97 ; Yu00 , although details of the structural behavior before the actual break are not known. Simulations of single-walled nanotubes under tension predict that Stone-Wales defects can form at tensile strains of and defect motion may occur at tensile strains as low as Nardelli98 . We are repeatedly applying shear strains of about to the MWNTs, and few times in each pass approaching . There are two structural changes that could stiffen the MWNTs. The individual shells of the MWNTs could be stiffened or the mechanical coupling between different shells could be increased. It is unlikely that changes in the connection between the nanotube and either the pinning metal or the paddle would result in an increase in device stiffness. Mechanical flexing of those joints would be expected to weaken them, which would result in a decrease in measured stiffness.
From the , and the paddle dimensions, we can calculate the devices’ expected torsional resonant frequencies, which are in the 1-10 MHz range. In principle, we should also be able to extract from our fits to Eqn. 2. For most of the devices, however, including device C shown in Fig. 3, at is within experimental error of . This means that there is negligible vertical deflection of the paddle, and that . We cannot accurately measure using a cantilever with . Nevertheless, given our experimental uncertainty in , we can estimate a lower bound for . We return to this point below in our discussion of moduli.
In order to make comparisons between MWNTs of different dimensions, we use the continuum mechanics model for the shear () and Young’s () moduli. We use beam bending equations Young89 combined with Eqs. 1:
| (3) |
where and are the outer and inner radii and are the lengths of the suspended MWNT sections. Since the moduli depend on , taking to be 0 yields moduli only smaller than taking to be . Based on TEM observations, of our arc-grown MWNTs are typically much less than half of . We therefore approximate the MWNTs as solid cylinders and calculate effective shear moduli , which are summarized in Table 1.
Uncertainty in contributes the bulk of the uncertainty in . AFM measurements of the metal surface under which the MWNTs were buried, and of MWNTs pushed down to the substrate with the AFM tip, varied by more than a factor of two for a given MWNT. The reported in Table 1 were arrived at by averaging the full-width at half-maximum of the SEM image brightness along lines perpendicular to the suspended MWNTs. Applying this technique to multiple SEM images of the same MWNT, taken under different imaging conditions (i.e. different image brightness, secondary electron detector, etc.), yielded a variation in the measured of about , corresponding to an uncertainty in of about a factor of 2. It is also possible that there is a systematic error in the estimation of from SEM images, which can exaggerate nanotube diameters.
As mentioned, the MWNTs increased in stiffness as the experiment progressed. Since the cause of this increase is still unknown, we initially discuss data from the first pass on each paddle, where the MWNT has been least affected by the experiment. The calculated from the first pass on each paddle range over about an order of magnitude. We hypothesize that these differences are due to differences in the mechanical coupling between the shells of the MWNTs in the various devices. Cumings and Zettl have shown, by pulling inner shells of a MWNT out from the outer ones, that it is possible to have a very low intershell mechanical resistance Cumings00 . Yu’s et al. study of the tensile failure modes of MWNTs shows that the individual shells are not equally strained in all MWNTs, since some break at widely separated places along the tube’s length Yu00 . Our wide range of suggests that in some MWNTs, the stress is evenly distributed among many shells, while in others the stress is concentrated only in the outer shell or few shells while the inner ones slide easily. Since our MWNTs are clamped by evaporating metal onto their outer shells, it is conceivable that the inner shells may be sliding both where the MWNTs pass through the paddle and where they pass through the metal pinning the MWNT ends. Observations have shown that some MWNTs have circular cross-sections, while others have polygonal cross-sections Liu94 . Such polygonal MWNTs could have greater inter-shell coupling than circular MWNTs under rotational strain. This would explain the large range of effective calculated from the solid rod model where the entire diameter of the MWNT is assumed to share the stress. Other contributors to the large range of measured could include defects in the MWNTs or imperfect pinning of the nanotubes within the metal.
In Ref. Lu97, , using a model which assumes that all shells are strained, Lu predicted GPa for a ten-wall 7.8 nm-diameter CNT. For comparison, in diamond GPa and in graphite the basal plane GPa. Our largest measured are consistent with the theoretical value. The experimental values which fall below this prediction can be explained by sliding of the inner shells when only the outer shell or few shells are clamped by the evaporated metal. Indeed, assuming that only the outer shell carries the load, and using the inter-shell spacing as the effective thickness of that shell, we can calculate a shell shear modulus . Some of these results are also in Table 1. For devices B, C, and D, which initially have small , is near the theoretical value. The stiffening of the MWNTs with repeated twisting suggests that the inter-shell coupling can be modified. Both devices B and D are stiffened by more than on order of magnitude, resulting in consistent with the theoretical values. It is noteworthy that device D shows a saturation at this value. These results are consistent with the idea that, initially, only the outer shell is strained, and that repeated deflections increase the inter-shell coupling until all shells are strained. A more accurate measurement is required to confirm this conclusively. For Young’s modulus, if we calculate lower bounds using the lower bound values of the , we find is typically greater than a few hundred GPa, which is consistent with previous experimental and theoretical results Yu00 ; Lu97 .
In conclusion, we have fabricated and characterized CNT paddle oscillators. We repeatedly apply torsional strains to the MWNT spring-elements and measure their torsional spring constants. We find that the MWNTs become stiffer with repeated deflection. The effective shear moduli of the nanotubes calculated by approximating the MWNTs as solid cylinders vary by nearly two orders of magnitude, from near the theoretically predicted value to significantly less than it. The results suggest that the inter-shell mechanical coupling varies widely from one MWNT to the next and can be modified by applying strain.
Acknowledgements.
We thank the ONR and the NSF for funding for this project.References
- (1) H. G. Craighead, Science 290, 1532 (2000).
- (2) A. Erbe, C. Weiss, W. Zwerger, and R. H. Blick, Phys. Rev. Lett. 87, 096106 (2001).
- (3) A. N. Cleland and M. L. Roukes, Nature 392, 160 (1998).
- (4) Y. T. Yang et al., Appl. Phys. Lett. 78, 162 (2001).
- (5) R. Lifshitz and M. L. Roukes, Phys. Rev. B61, 5600 (2000).
- (6) D. W. Carr et al., Appl. Phys. Lett. 75, 920 (1999).
- (7) H. W. C. Postma et al., Science 293, 76 (2001).
- (8) A. Bachtold, P. Hadley, T. Nakanishi, and C. Dekker, Science 294, 1317 (2001).
- (9) P. Poncharal, Z. L. Wang, D. Ugarte, and W. A. de Heer, Science 283, 1513 (1999).
- (10) P. Kim and C. M. Lieber, Science 286, 2148 (1999).
- (11) S. Evoy et al., Jour. Appl. Phys. 86, 6072 (1999).
- (12) D. W. Carr et al., Appl. Phys. Lett. 77, 1545 (2000).
- (13) P. A. Williams et al., in press.
- (14) J. Nygård and D. H. Cobden, Appl. Phys. Lett. 79, 4216 (2001).
- (15) R. Lüthi et al., Surf. Sci 338, 247 (1995).
- (16) Bending of the metal paddle itself is negligible. The calculated spring constant due to the bending of the paddle is one to two orders of magnitude larger than the effective spring constants of the CNT.
- (17) M.-F. Yu et al., Science 287, 637 (2000).
- (18) M. R. Falvo et al., Nature 389, 582 (1997).
- (19) M. Buongiorno Nardelli, B. I. Yakobson, and J. Bernholc, Phys. Rev. Lett. 81, 4656 (1998).
- (20) W. C. Young, Roark’s Formulas for Stress and Strain, sixth ed. (McGraw-Hill, New York, 1989).
- (21) J. Cumings and A. Zettl, Science 289, 602 (2000).
- (22) M. Liu and J. M. Cowley, Ultramicroscopy 53, 333 (1994).
- (23) J. P. Lu, Phys. Rev. Lett. 79, 1297 (1997).