High frequency acoustic modes in vitreous Beryllium Fluoride
probed by inelastic X-ray scattering.
Abstract
Inelastic X-ray Scattering measurements of the dynamics structure factor have bene performed on vitreous Beryllium Fluoride (v-BeF2) at =297 K in the momentum transfer, , range =1.510 nm-1. We find evidence of well defined high frequency acoustic modes. The energy position and linewidth of the excitations disperse with as and , respectively up to about one half of the first maximum of the static structure factor. Their magnitude compare favorably with low-frequency sound velocity and absorption data. The results indicate worth mentioning similarities of the high frequency collective dynamics of different network forming glasses such as v-B2O3 and v-SiO2.
pacs:
PACS numbers: 67.55.Jd, 67.40.Fd, 61.10.Eq, 63.50.+xI INTRODUCTION
The interest in the provocative behavior of the glass-forming liquid BeF2 has been recently renewed in an effort to relate a viscosity anomaly to some water-like features, such as the existence of a negative thermal expansion coefficient region [1]. Since the first appearance of the -scaled temperature dependence of the viscosity plot for glass-forming systems, it became clear that liquid BeF2 has an intriguing property: it shows a crossover between the two extreme strong and fragile behaviors. In particular, using existing viscosity data [2] Angell and co-workers have shown that -in a -scaled plot- the high-temperature limit of BeF2 viscosity obtained by extrapolation should reach an un-physically small value [1]. Molecular dynamics simulations have recently been performed [1] to explain the above observation in terms of a weak thermodynamic anomaly. In particular, a density maximum has been predicted to occur at 2000 K and a density minimum at 1250 K, a temperature at which a considerable (30) rise in heat capacity was also predicted.
Despite these intriguing thermodynamics anomalies, BeF2 is much less studied compared to other network forming glasses like the oxides SiO2, GeO2, B2O3 etc., owing to the subtleties that it presents in its purification procedure (hygroscopicity, toxicity, corrosiveness etc.).
From the experimental point of view the structure of BeF2 has been elucidated by x-ray [3] and neutron [4] diffraction studies supporting the resemblance of BeF2 structure with that of SiO2, i.e. a 3D network of corner sharing BeF4 tetrahedral units. The room temperature Raman spectrum of BeF2 has been measured by Galeener et al. [5] where a comparison between this glass and other oxides is attempted. Finally, dynamic properties of BeF2 at low temperature and ultrasonic frequencies have been carried out [6] showing that i) between =10 and 200 K, BeF2 has an acoustic absorption comparable to that of SiO2, ii) the temperature dependence of the sound speed of BeF2 (similar to that of SiO2) shows anomalous behavior. In particular, in contrast to the monotonically decreasing sound speed with temperature rise which is usually found in glasses (B2O3, GeO2, Zn(PO3)2), the sound speed of BeF2 (and of SiO2 as well) exhibits an initial drop followed by an upturn above 50 K.
In this paper, we present the first experimental determination of the acoustic properties of BeF2 in the THz frequency range, by means of Inelastic X-ray Scattering (IXS). In particular, we have measured the dynamic structure factor, , at room temperature (=598 K) i) as a function of energy for fixed values of in the range nm-1; ii) as a function of for the fixed energies of 0 and 7 meV. The obtained data allow us to extract some information about the high frequency sound dispersion and attenuation properties for the longitudinal acoustic excitations of this network forming glass. Specifically, we find that i) Well defined high frequency acoustic modes exist and propagate in the glass; ii) The excitation frequency disperses linearly with (); iii) The excitation width (FWHM) increases quadratically with , (); iv) The sound speed, , and the sound energy absorption coefficient, , compare favorably with literature low-frequency ultrasonic data [7]. Finally, a comparison of the sound absorption data of BeF2 with that of SiO2 indicates striking similarities in the behaviour of the high frequency collective dynamics of these two systems.
II EXPERIMENTAL DETAILS
Beryllium fluoride is a substance that presents considerable difficulties in its purification procedure. This stems from the fact that it is extremely hygroscopic, toxic and corrosive for conventional containers like fused silica tubes. For the above reasons the whole material handling operation took place in an inert atmosphere (nitrogen-filled) glove box with a water content less than 2 ppm while the material was melted in gold-plated silica tubes of 8 mm inner diameter. The BeF2 starting material was purchased from Alfa Aesar Chemical Co. with nominal purity 99.5 which was not enough to obtaine a transparent glass/melt free of black spots. Thus, BeF2 was first sublimed under dynamic high vacuum and high temperature in graphite tubes. The material obtained after sublimation contained pure and contaminated parts from the container. The proper amount of pure BeF2 was selected and placed into the gold-plated cylindrical silica crucibles with flat bottom. The crucibles with the pure BeF2 were placed in a quartz cell that was evacuated, partially filled with Ar, and flame sealed. This cell was then transferred into a furnace and heated up to the softening point of the glass (1100 K) for 1-2 hours to obtain complete homogenization. The melt was cooled down to room temperature in a controlled way in order to obtain a transparent glass, free of internal stresses. With this procedure we were able to obtain cylindrical BeF2 glass samples with a length of about 1 cm, comparable with the absorption length for 21.7 keV x-rays. Characteristic temperatures of BeF2 are: glass transition temperature 598 K and melting point of both the quartz-like and cristobalite-like crystalline modifications K.
Data for the BeF2 glass have been collected at room temperature (=297 K) at the IXS beamline ID28 of ESRF [8, 9]. The experiment has been performed at fixed exchanged wavevector over a region nm-1 with a resolution (FWHM) of nm-1. The overall energy resolution (FWHM) has been set to meV utilizing the (11 11 11) reflection for the Si monochromator and crystal analyzers. A five-analyzers bench, operating in horizontal scattering geometry, allowed us to collect simultaneously spectra at five different values of . Each energy scan ( meV) took about 300 minutes, and several scans have
been accumulated for a total integration time of about 500 seconds/point. Measurements at constant energy have also been conducted, scanning over the scattering angle. In this case the energy resolution was the same as in the fixed scans, while the resolution was increased, nm-1, by using tunable-width slit placed on the scattered beam path.
III DATA PRESENTATION AND DISCUSSION
Fig. 1 illustrates a selection of experimental spectra accumulated at the indicated values as a function of the exchanged energy . Since the incident flux on the sample slightly varies during the acquisition of each scan, the data have been normalized to a monitor signal for each frequency value, and then multiplied by the average monitor. The data of Fig. 1 bear a close resemblance with those collected from other network forming glasses, such as SiO2 [10, 11] and B2O3 [12]. A strong elastic peaks dominates the spectra, and the inelastic features appear only as weak shoulders on the tail of the resolution-broadened elastic line. In order to extract quantitative information on the excitations giving rise to the inelastic signal, we fitted the the experimental data with a model function for the convoluted with the instrumental resolution.
In fact, the actual experimental intensity, , is proportional to the convolution of the dynamic structure factor, , (), with the instrumental resolution function .
| (1) |
where contains the efficiency of the analyzers, the atomic form factors and other angular-dependent correction factors. The true, quantum, can be approximately related to its classic counterpart by
| (2) |
An useful expression for the (classical) dynamic structure factor can be obtained by recalling that its Fourier transform in the frequency domain, i.e. the density fluctuation correlation function , obeys a generalized Langevin equation [13]:
| (3) |
where is a parameter related to the static structure factor [13], and is the ”memory function”. In this “exact” expression all the difficulties associated to the calculation of have been transferred to the determination of , with the advantage that the first two sum rules for are automatically satisfied [13]. By Fourier transforming Eq. (3), it is easy to show that:
| (4) |
where =+ is the time Fourier transform of the memory function . In the 1 limit, a limit that is certainly valid in the present case of a glassy sample, the memory function can be approximated by the sum of a constant term, , -which reflects the frozen -process- plus a function showing a very fast decay at short times. The latter contribution to the memory function -often referred to as “microscopic” or “instantaneous”- is usually represented as a delta-function with area . Therefore:
| (5) |
and hence Eq. (4) reads as:
| (6) |
where =, and =1- is the non-ergodicity factor. The expression in Eq. 6 is the sum of an elastic line (the frozen process) accounting for a fraction of the total intensity, and of an inelastic feature which is formally identical to a Damped Harmonic Oscillator (DHO) function. The parameter coincides with the maximum of the longitudinal current correlation function, , and it is related to the apparent sound speed value , while , the excitation width, is related through its low value to the acoustic absorption coefficient .
The model function, utilized to fit the experimental data will be, therefore
| (7) | |||
| (8) |
which, apart from an intensity factor , contains three free shape parameters: , and .
In Fig. 1, together with the raw data (circles), we report the the elastic contribution (dashed lines), the fits to the data (full lines) and the inelastic contribution (dotted lines). This latter contribution clearly shows a dispersing behavior despite the considerable sound attenuation ( at nm-1).
In Fig. 2 (upper panel) we report the best fit values of (dots) along with the dispersion obtained in the low frequency (ultrasound) limit (dotted line, corresponding to the adiabatic sound speed m/s [14]). To represent the -dependence of we utilized the expression in order to keep into account for the bending of the dispersion curve associated to the existence of a quasi-Brillouin zone. This procedure yielded for the sound speed , a value that, as in the case of vitreous silica [11], exceeds its low frequency value. The higher value of the high frequency sound velocity could be the signature of the crossing of some relaxation process. Such a process can not be the structural relaxation, since in the glass it lies in the sub- region, while it can be ascribed to the action of a microscopic process -produced by the topological disorder that is present in the glassy phase, as demonstrated in the case of simulated monatomic glasses [15, 16]. This hypothesis implies that the assumption of an instantaneous decay of the memory function in eq. 5 may be inadequate; unfortunately, however, the low magnitude of the inelastic to elastic ratio does not allow us for a more realistic ansatz for the memory function shape. The excitation width is reported as a function of in the lower panel of Fig. 2. Its -dependence is compatible with the law already found in all the glasses where the dynamic structure factor has been measured in the mesoscopic region: . Actually, a fit to the data with the law (full line) results in =1.960.05 and =1.050.05 meV/nm-2.
In order to further illuminate the previous results, the dynamic structure factor has also been measured at a fixed exchanged energy value as a function of the momentum transfer. In the constant scans (as those reported in Fig. 1), indeed, the inelastic signal always appears as a shoulder of the resolution broadened central line, so that the choice of an appropriate model for the can be, in principle, neither easy nor unique [17]. In a constant scan, on the contrary, the inelastic signal is more clear, since the (resolution broadened) elastic contribution appears as an almost flat, -independent, background. Moreover, the parameters determined trough the best fit to the energy scan data can be utilized to build-up a curve that can be compared to the constant experimental data [17]. In Fig. 3 we present, as an example, the result of such a comparison for a scan at =7 meV: in the upper panel we show the raw experimentally measured elastic, meV, and inelastic, meV data. Obviously, the latter data contain an elastic contribution as a consequence of the finite energy resolution. In order to subtract this elastic contribution we used a series of spectra at constant taken between =23 and 32 nm-1. After aligning and scaling the experimentally determined resolution function to the elastic peaks in the spectra at high , we estimate the relative intensity between the elastic and inelastic signals at the energy transfers utilized in the constant- spectra. The elastic to inelastic intensity ratio has been obtained at =13, 16, 19, and 22 nm-1. These ratios allow us to put in the correct relative scale the spectra taken at =7 meV and at =0. This normalization procedure is used to derive the inelastic part of the by the subtraction of the normalized elastic contribution from the total scattered intensity. The difference spectrum at 7 meV is reported in the lower panel of Fig. 3 (circles) together with the error bars as derived from the counting statistics. In this spectrum the existence of a defined Brillouin peak is highly emphasized. The dashed line in the lower panel of Fig. 3represents the function predicted on the basis of Eq. 7, with and (as derived from Fig. 2), where the only adjustable parameter is now an intensity factor since , , and are determined from the fit results of the energy scans. Although the peak position turns out to be slightly underestimated, the proposed fitting model appears to capture the main features of the experimental data.
The convergent results obtained by analyzing the two independent data sets, i. e. the constant- and - scans, allow us to establish the appropriateness of the approximations introduced in the memory function of the density fluctuations, and, more specifically, of the results reported in Fig. 2 for and .
One of the most intriguing topics, as far as the glassy dynamics is concerned, is the frequency (or ) dependence of the sound attenuation. Despite that in the IXS window (i. e. at values ranging from 1 to 10 nm-1, or energies ranging from 5 to 50 meV) a law describes the excitation broadening, at lower frequencies the situation becomes less clear due to the presence of relaxation processes. An interesting comparison between BeF2 and SiO2 is presented in Fig. 4 where we report the parameter for these two glasses over a wide range of frequencies as derived from IXS and other literature data. Both glasses exhibit a behavior above 35 GHz, while below this value a power law well represents the available experimental data for SiO2 [18].
Finally, in Fig. 5, we present the non ergodicity factor as determined by IXS in vitrous silica and Beryllium Fluoride. Indicating with and the integrated elastic and inelastic spectral contribution (determined by the fit), the non ergodicity factor reads as . As shown in the figure, the of BeF2 is in good agreement with the SiO2 data when reported as a function of . The results reported in Figs. 4 and 5 imlpy the existence of an interesting analogy between these two network forming glasses as far as their high frequency dynamics is concerned.
IV CONCLUSIONS
In conclusion, a room temperature IXS study of glassy BeF2 has been undertaken in the present work. In accordance with all previous studies in strong and fragile glasses, evidence has been presented for well-defined propagating (high frequency) acoustic modes, whose frequency position and linewidth scale as and , respectively. The longitudinal speed of sound for glassy BeF2 has been estimated to exceed its low frequency (ultrasonic) limit by almost 5; a case analogous to that found in studies of vitreous silica. The extrapolation of the high-frequency linewidth conforms nicely with the value obtained from ultrasonic studies, and exhibits a scenario similar to that of vitreous silica. Another similarity which deserves further study is that the temperature dependence (in a Tg-scaled plot) of the non-ergodicity factor, as determined from the ratio of the elastic to the total scattered intensity, follows the behavior exhibited by SiO2 (Fig.5) while for less strong glasses the drop of is much faster with increasing temperature. Unfortunately, for BeF2 it is up to now available only one point in such a -scaled plot, which however coincides with the data for silica. Further temperature-dependence studies on BeF2 are expected to shed more light on this issue.
V ACKNOWLEDGEMENTS
We kindly acknowledge M. Krisch and the staff of the ID28 beamline at the ESRF for valuable help and assistance during the measurements, in particular the local contacts M. Lorenzen and R. Verbeni.
REFERENCES
- [1] M. Hemmati, C.T. Moynihan, C.A. Angell, J. Chem. Phys 115, 6663 (2001).
- [2] S. V. Nemilov, G. T. Petrovskii, and L. A. Krylova, Inorg. Mater. (Transl of Neorg. Mater.) 4, 1453 (1968). C. T. Moynihan and S. Cantor, J. Chem. Phys. 48, 115 (1968).
- [3] A. H. Narten, J. Chem. Phys. 56, 1905 (1972); A. J. Leadbetter and A. C. Wright, J. Non-Cryst. Solids, 7, 156 (1972).
- [4] A. C. Wright, A. G. Clare, G. Etherington, R. N. Sinclair, S. A. Brawer, and M. J. Weber, J. Non-Cryst. Solids, 111, 139 (1989), and references therein.
- [5] F. L. Galeener, A. J. Leadbetter, and M. W. Stringfellow, Phys. Rev. B 27, 1052 (1983).
- [6] J. T. Krause and C. R. Kurkjian, J. Am. Ceram. Soc. 51, 226 (1968).
- [7] In the literature there is often confusion about the relation of the sound absorption with the Brillouin linewidth. In particular, is sometimes reported as the full width at half maximum while some other times is the half width at half maximum. We believe that this apparent controversy is related to the choice of the energy attenuation or of the field attenuation, respectively. In this paper we always consider the energy attenuation.
- [8] R. Verbeni, F. Sette, M. Krisch, U.Bergman, B. Gorges, C. Halcoussis, K. Martel, C. Masciovecchio, J. F. Ribois, G. Ruocco and H. Sinn, J. Of Synchrotron Radiation, 3, 62 (1996).
- [9] C. Masciovecchio, U. Bergman, M. Krisch, G. Ruocco, F. Sette and R. Verbeni, Nucl. Inst. and Meth., B-111, 181 and B-117, 339 (1986).
- [10] M. Foret, E. Courtens, R. Vacher and J.B. Suck, Phys. Rev. Lett. 77 3831 (1996); P. Benassi, M. Krisch, C. Masciovecchio, V. Mazacurati, G. Monaco, G. Ruocco, F. Sette and R. Verbeni, Phys. Rev. Lett. 77 3835 (1996).
- [11] C. Masciovecchio, V. Mazzacurati, G. Monaco, G. Ruocco, T. Scopigno, F. Sette, P. Benassi, A. Cunsolo, A. Fontana, M. Krisch, A. Mermet, M. Montagna, F. Rossi, M. Sampoli, G. Signorelli, R. Verbeni, Phil. Mag. B 79, 2013 (1999).
- [12] A. Matic, L. Borjesson, G. Ruocco, C. Masciovecchio, A. Mermet, F. Sette and R. Verbeni, Europhys. Lett. 54, 77 (2001).
- [13] U. Balucani and M. Zoppi, Dynamics of the Liquid State (Clarendon Press, Oxford, 1994).
- [14] This value was taken form G. E. Walrafen, Y. C. Chu, and M. S. Hokmabadi, J. Chem. Phys. 92, 6987 (1990) where it was attributed to data by J. T. Krause and C. R. Kurkjian.
- [15] G. Ruocco, F. Sette, R. Di Leonardo, G. Monaco, M. Sampoli, T. Scopigno and G. Viliani, Phys. Rev. Lett. 84, 5788 (2000).
- [16] T. Scopigno, G. Ruocco , F. Sette and G. Viliani, to appear in Phys. Rev. E.
- [17] O. Pilla, A. Cunsolo, A. Fontana, C. Masciovecchio, G. Monaco, M. Montagna, G. Ruocco, T. Scopigno, F. Sette, Phys. Rev. Lett. 85, 2136 (2000).
- [18] T.C. Zhu, H.J. Maris and J. Tauc, Phys. Rev. B 44, 4281 (1991).
- [19] R. Vacher, J. Pelous, E. Courtens, Phys. Rev. B 56, R481 (1997).
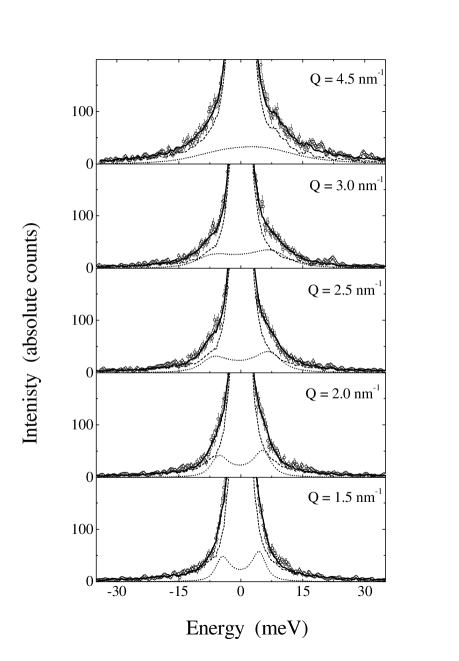
Fig. 1 - T. Scopigno et al, “High frequency acoustic modes…”
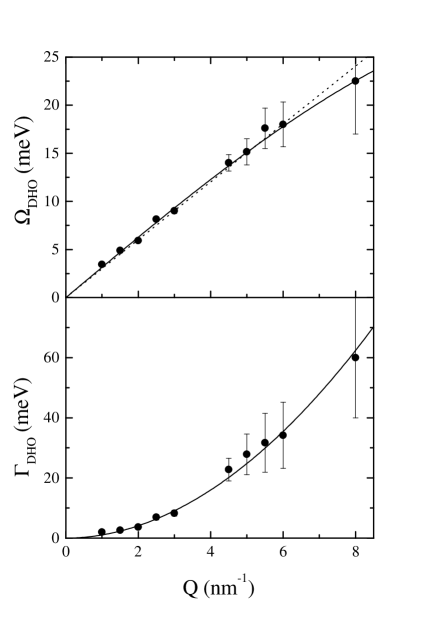
Fig. 2 - T. Scopigno et al, “High frequency acoustic modes…”
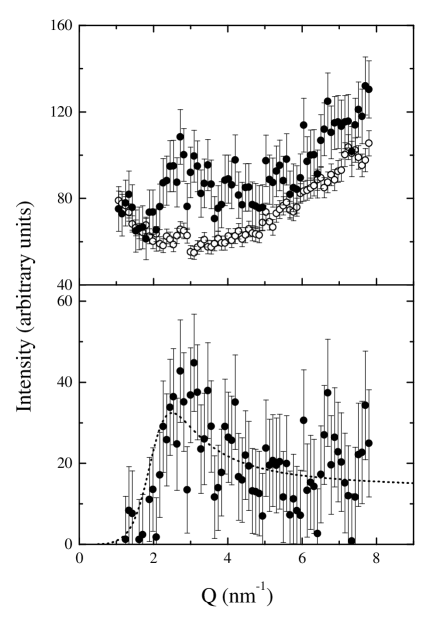
Fig. 3 - T. Scopigno et al, “High frequency acoustic modes…”
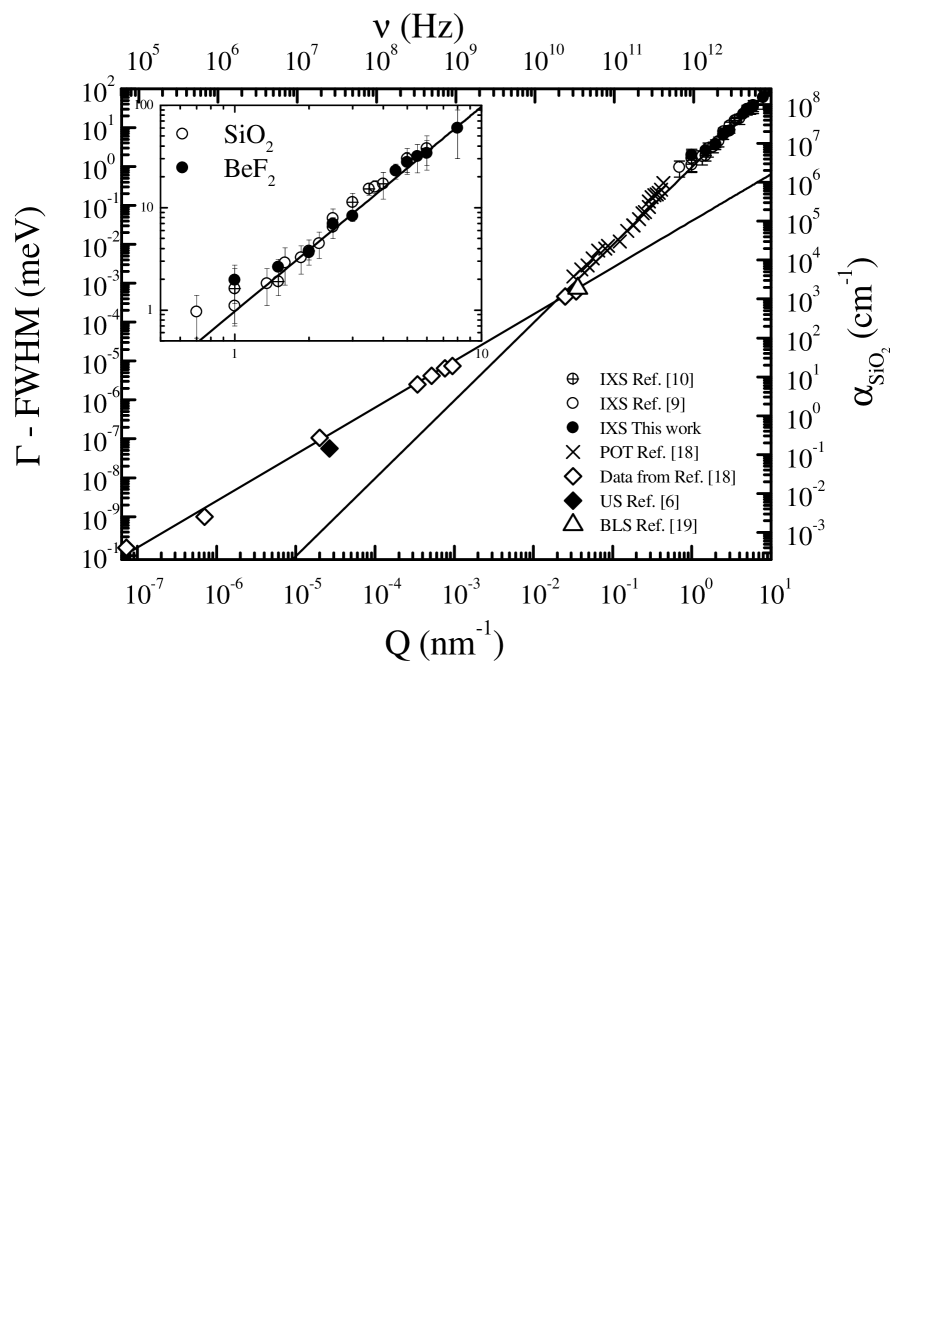
Fig. 4 - T. Scopigno et al, “High frequency acoustic modes…”
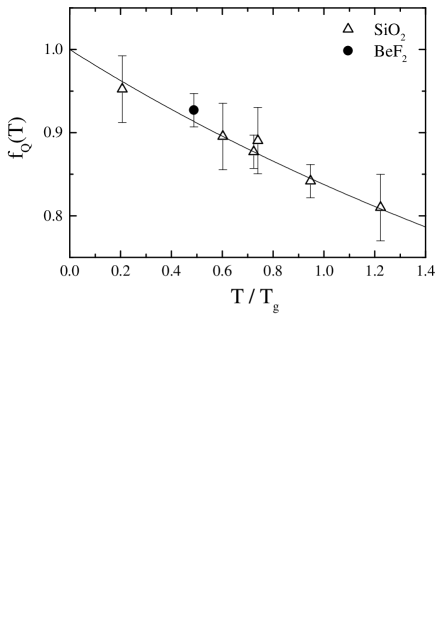
Fig. 5 - T. Scopigno et al, “High frequency acoustic modes…”