Liquid Crystal Foams: Formation and Coarsening
Abstract
Coarsening in foams made from the pure liquid crystal, 8CB, has been studied. The foam was made in the nematic phase () by bubbling nitrogen through the pure liquid crystal. The coarsening behavior was investigated at three temperatures; at and in the smectic phase and at in the nematic phase. In smectic and nematic phases the mean bubble radius has been measured as a function of time . In classical wet soap foams the growth exponent is typically where coarsening is by gas diffusion from bubbles with high curvature to bubbles with low curvature. In liquid crystal foams a growth exponent, is observed. This may be explained by the presence of defects at the surface of the bubbles which slow down the coarsening behaviour. This growth exponent can be observed in both nematic and smectic phases. At higher temperatures typically coalescence dominates the coarsening behaviour. In the isotropic state, , the foam is rapidly unstable.
pacs:
61.30.-v, 61.30.Pq, 61.30.Pa, 68.03.Cd, 82.70.RrThe dynamic behaviour of classical foams which are usually made with an aqueous solution of surfactant have been well studied. Coarsening, drainage, structure and rheology are of fundamental interest in the study of foams Stavans (1993); Durian and Weitz (1994); Rieser and Lemlich (1988); Magrabi et al. (1999); Bisperink et al. (1992); Monnereau and Vignes-Adler (1998). In this article we are primarily interested in the coarsening behaviour where the temporal evolution of the mean bubble size is expressed as where is the time and is the growth exponent. When coarsening is dominated by gas diffusion between bubbles the growth exponent depends on the liquid fraction of the foamHilgenfeldt et al. (2001); Cheng and Lemlich (1985); Lemlich (1978); De Vries (1972); Stavans (1993).
In dry foams, bubbles are polyhedral-like and separated by flat films and the growth exponent is due to gas diffusion through the filmsLiftshitz and Slezov (1959); Wagner (1961). In contrast in wet foams bubbles appear to be spherical and coarsening occurs by gas diffusion through the three dimensional continuum of the liquid phase. The growth exponent is slower and an exponent is observedKabalnov et al. (1990); Egelhaaf et al. (1999). Coarsening can also occur by film rupture leading to rapid coalescence of the bubbles and a growth exponent of Burnett et al. (1995).
In this paper we present a study of the coarsening behaviour of a foam made from a pure liquid crystal where neither solvent nor surfactant is present. Despite much previous work on soap foams there has never been any studies performed on foams which are made from a pure thermotropic liquid crystal.
An important difference between a classical foam and a liquid crystal foam is the role of elastic distortions due to defects near the surfaceOswald (1987); Zywocinski et al. (2000). Recent studies on films made from liquid crystals show that edge dislocations in a smectic film meniscus can influence its shape Picano et al. (2000, 2001). A coupling between defects and the surface energy of the film can influence the type of defect observed. This interaction exists due to the elastic distortion field exerted by the defect on the film surface.
In this study the foam was made from pure 8CB (4-n-octylcyanobiphenyl) liquid crystal. Below the liquid crystal is in the solid phase. The smectic phase exists between and and the nematic phase exists between and . Above the liquid crystal is an isotropic phase.
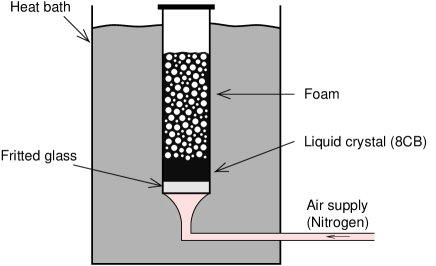
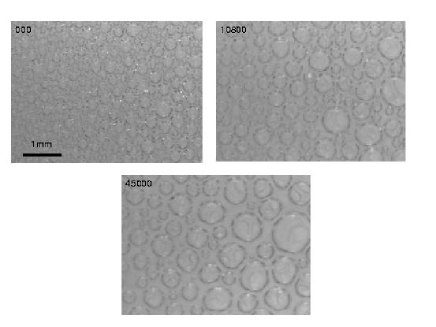
All foams were made in a glass cell with dimensions 1cm 1cm 10cm. The cell was immersed in a temperature controlled heat bath (Fig. 1). To make the foam the liquid crystal must first be heated into the nematic phase (). Then, nitrogen gas is passed through fritted glass at the base of the cell to form the foam until a sufficient amount is made (cm high). After making the foam the temperature is adjusted appropriately for the experiment. Then the evolution of bubble growth at the glass surface is followed with a time-lapse video recorder and a frame-grabbing PC (Fig. 2).
The evolution of the bubble growth was followed by observing the foam at the glass surface. Since the surface only represents a 2D slice of the foam small bubbles are under-counted. The bubble distribution can be corrected in order to obtain the true 3D bubble size distribution Cheng and Lemlich (1983). The mean bubble size can be determined using where N is the total number of bubbles measured each with radius a:bubble (21). This method to calculate the mean size was used for all experiments in this study.
The liquid volume fraction of the foam after fabrication can be roughly determined () by rapidly heating the foam and measuring the liquid recovered from a foam of known volume. The measured liquid fraction immediately after fabrication is approximately . It is easily observed from images that the bubbles are initially round and there is of distance between bubbles. The liquid fraction was measured at the end of the experiments and was observed to reduce to about . Throughout the coarsening the film thickness, i.e. the distance between bubbles, is approximately constant. In the nematic phase the foam is drier and hence bubbles are closer to each other than in the smectic phase.
The temporal evolution of the mean bubble radius was measured in smectic and nematic foams. In the smectic phase growth exponents were determined at and . In the nematic phase the growth exponent was measured at . In order to determine the growth exponent a log-log plot is generated. The mean radius varied over time such that . An exponent was determined from each run and an average exponent, was calculated.
Figures 3 - 5 show the temporal evolution of the mean bubble size for different runs, represented by different symbols on the graph, for , and . Large variations between runs is attributed to the difference in initial size distribution of the bubbles during preparation.
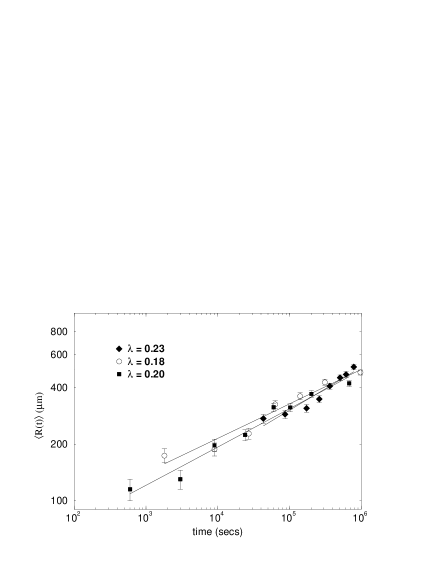
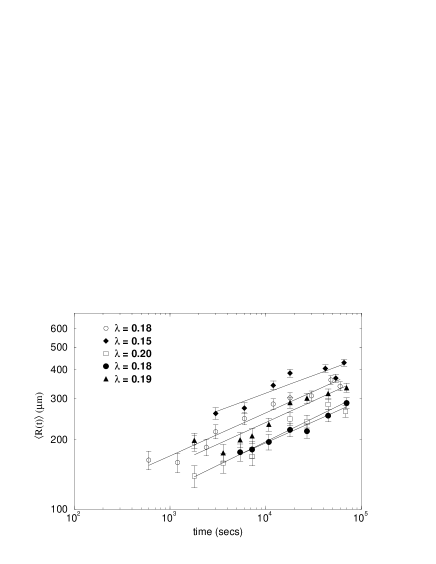
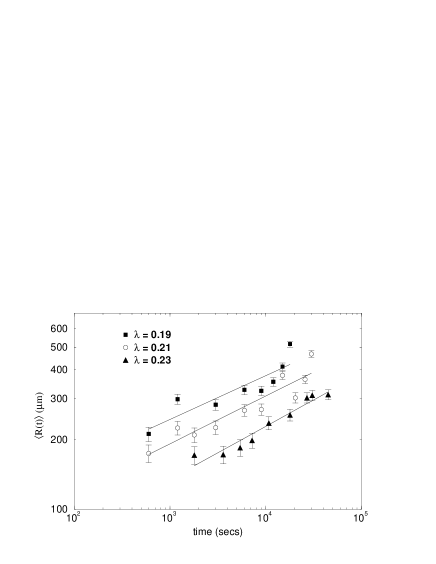
In the smectic phase at low temperature () the bubble growth was followed for 10 days. The best fits of the data for each run are plotted and the mean growth exponent averaged over all the runs are . In the smectic phase at high temperature () the mean bubble size is measured over 1 day. Again, several runs are represented by different symbols and a best fit plotted for each run. These results give an average mean growth exponent,. In the nematic phase () the growth exponent is measured to be . At all three temperatures we observe a growth exponent close to one fifth.
At temperatures between T the foam is very unstable and the main process responsible for the bubble growth is by rapid coalescence. If the foam is heated above it instantly collapses. This behaviour can be exploited when we require to destroy all of the foam before we make a new foam for the next experiment.
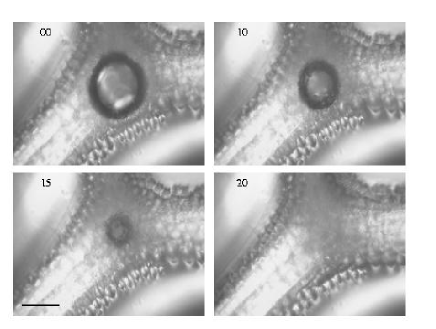
The dynamics of small bubbles has also been followed in smectic and nematic foams. In a smectic foam the small bubbles shrink and eventually disintegrate while remaining confined in the foam. However in the nematic phase small bubbles shrink and escape upon reaching a size of about (figure 6). They then rise to the top of the foam through the Plateau borders.

By removing the foam from the cell and placing it between a glass slide and a coverslip we were able to observe a 2D foam. The cell thickness was approximately m which allowed visualization of the bubble surface. In this geometry, defects at the surface of the bubbles were observed in a microscope with partially crossed polars. The time-evolutution of a small bubble shrinking in a 2D foam is shown in figure 7.
Above we have shown that liquid crystal foams can be prepared, and that they do not have the typical growth behavior observed in classical wet foams. For liquid crystal foams, growth exponents have been measured.
In the classical theoretical treatment, coarsening in foams follows from Lifshitz, Slezov and Wagner theory Liftshitz and Slezov (1959); Wagner (1961). Diffusion of gas is driven from small bubbles with higher excess chemical potential () to larger bubbles. The higher chemical potential is due to high curvature of smaller bubbles which leads to a higher concentration of gas being dissolved at the bubble surface
where is the bulk solubility of the gas, is the molar volume, is the gas constant, is the temperature and is the surface tension. Combining these two equation and linearizing we obtain
Using Ficks law with linear approximation for the concentration gradient near to the bubble surface we obtain an expression for the gas flux which can be expressed in terms of the bubble size and the mean radius, where ,
and is the diffusion coefficient of the gas in the solvent, is the density. From this the temporal evolution of the mean bubble radius in the foam can be determined
For the case of classical soap foam the surface tension is independent of the bubble size. If the energy per unit area on a bubble surface were to depend on such that , where is a constant, then a growth law could be predicted. A possible source of an dependent surface tension may come from the surface/defect interactions. For a liquid crystal foam the surface tension can be modified by the influence of defects near to the surface.
As bubbles shrink the elastic interaction of the defects with the surface would intensify due to an increase in defect density (number of defects per unit area) and hence leads to an increase in surface tension. This would be reasonable if the number of defects at the surface of the bubble remained constant. The defects at the bubble surface could either be giant edge dislocations or focal-conic defects. A change in the defect type is unlikely to lead to any significant change in the distortion field which affects the surface energy of the bubble. From these surface/defect interactions an R dependent surface tension can be assumed which may explain the observed growth law. This is the first time such a scaling law has been observed in the coarsening of foams. Furthermore this growth is significantly slower than other calculated growth exponents.
Although the coarsening may be explained from liquid crystal properties there are open questions regarding the stability and foamability. The stability of a foam will generally depend on its ability to avoid rapid coalescence, normally at temperatures close to the foaming temperature . When above this temperature bubbles rapidly coalesce and the foam collapses. One possible explanation could be that the viscosity reduces significantly to allow rapid drainage to dry the foam and hence coalescence is more possible. Another possible explanation is that the number of smectic layers at the bubble surface may also play a role in the foam stability. As the temperature is increased the thickness of the smectic skin reduces Picano et al. (2001). If the width of the smectic skin is sufficiently reduced then the gravitational effects could become significant in inducing coalescence of the bubbles.
In the field of liquid crystals, free standing films and single film bubbles Oswald (1987) made from pure liquid crystal have been studied. The ability to make a pure liquid crystal foam opens many doors for studying other foam properties such as drainage, structure and rheology in this novel system.
Acknowledgements.
I would like to acknowledge P. Poulin, P. Barois and D. Roux for their kind hospitality and support throughout my time at the CRPP and M. Cates, J. Leng, F. Nallet, J. Bibette, P. Oswald, I. Stewart, N. Mottram and D. Head for useful discussions.References
- Stavans (1993) J. Stavans, Rep. Prog. Phys. 56, 733 (1993).
- Durian and Weitz (1994) D. Durian and D. A. Weitz, in Kirk-Othmer Encyclopedia of Chemical Technology, edited by J. Kroschwitz (Wiley, New York, 1994), vol. 11, pp. 783 – 805, 4th ed.
- Rieser and Lemlich (1988) L. A. Rieser and R. Lemlich, Journal of Colloid and Interface Science 123, 299 (1988).
- Magrabi et al. (1999) S. A. Magrabi, B. Z. Dlugogorski, and G. L. Jameson, Chem. Eng. Sci. 54, 4007 (1999).
- Bisperink et al. (1992) C. G. J. Bisperink, A. D. Rolteltap, and A. Prins, Advances in colloid and interface science 38, 13 (1992).
- Monnereau and Vignes-Adler (1998) C. Monnereau and M. Vignes-Adler, Phys. Rev. Lett. 80, 5228 (1998).
- Hilgenfeldt et al. (2001) S. Hilgenfeldt, S. A. Koehler, and H. A. Stone, Phys. Rev. Lett. 86, 4704 (2001).
- Cheng and Lemlich (1985) H. C. Cheng and R. Lemlich, Ind. Eng. Chem. Fundam. 24, 44 (1985).
- Lemlich (1978) R. Lemlich, Ind. Eng. Chem. Fundam. 17, 89 (1978).
- De Vries (1972) A. J. De Vries, in Absorptive bubble separation techniques, edited by L. R. (Academic Press, New York, 1972), chap. 2, pp. 7 – 31.
- Liftshitz and Slezov (1959) I. Liftshitz and V. Slezov, Soviet Physics J.E.P. 62, 331 (1959).
- Wagner (1961) C. Wagner, Ber. Bunsenges. 65, 58 (1961).
- Kabalnov et al. (1990) A. Kabalnov, K. Makarov, A. Pertsov, and E. Shckukin, J. Colloid Inteface Sci. 138, 98 (1990).
- Egelhaaf et al. (1999) S. Egelhaaf, U. Olsson, P. Schurtenberger, J. Morris, and H. Wennerstrø̈m, Phys Rev E 60, 5681 (1999).
- Burnett et al. (1995) G. Burnett, J. Chae, and W. Tam, Phys. Rev. E 51, 5788 (1995).
- Oswald (1987) P. Oswald, J. Physique. 48, 897 (1987).
- Zywocinski et al. (2000) A. Zywocinski, F. Picano, and J. C. Geminard, Phys. Rev. E 62, 8133 (2000).
- Picano et al. (2000) F. Picano, R. Holyst, and P. Oswald, Phys. Rev. E 62, 3747 (2000).
- Picano et al. (2001) F. Picano, P. Oswald, and E. Kats, Phys. Rev. E 63, 21705 (2001).
- Cheng and Lemlich (1983) H. C. Cheng and R. Lemlich, Ind. Eng. Fundam. 22, 105 (1983).
-
(21)
This way of determining the real distribution of bubble size was
determined by Lemlich Cheng and Lemlich (1983). The relation between the size
distribution of bubbles in a 3D foam, , and with bubbles in a 2D
slice,, is
This can also apply to the distribution at the glass surface in the absence of counterbalancing local segregation.