Phase behaviour and thermodynamic anomalies of core-softened fluids
Abstract
We report extensive simulation studies of phase behaviour in single component systems of particles interacting via a core-softened interparticle potential. Two recently proposed examples of such potentials are considered; one in which the hard core exhibits a shoulder, (Sadr-Lahijany et al, Phys. Rev. Lett. 81, 4895 (1998)) and the other in which the softening takes the form of a linear ramp (Jagla, Phys. Rev. E63, 061501 (2001)). Using a combination of state-of-the-art Monte Carlo methods, we obtain the gas, liquid and solid phase behaviour of the shoulder model in two dimensions. We then focus on the thermodynamic anomalies of the liquid phase, namely maxima in the density and compressibility as a function of temperature. Analysis of the finite-size behaviour of these maxima suggests that, rather than stemming from a metastable liquid-liquid critical point, as previously supposed, they are actually induced by the quasi-continuous nature of the two dimensional freezing transition. For the ramp model in three dimensions, we confirm the existence of a stable liquid-liquid (“second”) critical point occurring at higher pressure and lower temperature than the liquid-gas critical point. Both these critical points and portions of their associated coexistence curves are located to high precision. In contrast to the shoulder model, the observed thermodynamic anomalies of this model are found to be authentic, i.e. they are not engendered by an incipient new phase. We trace the locus of density and compressibility maxima, the former of which appears to converge on the second critical point.
pacs:
PACS numbers: 64.60.Fr, 05.70.Jk, 68.35.Rh, 68.15.+eI Introduction
Much attention has been paid recently to the phase behaviour of single component systems of particles interacting via so-called core-softened (CS) potentials. These potentials possess a repulsive core that exhibits a region of “softening” in the form of a shoulder or a ramp. Physical motivation for such models derives from the desire to encapsulate within a simple two-body isotropic potential, the complicated features of systems interacting via anisotropic potentials. Notable examples of the latter include liquid metals [1], tetrahedrally bonded molecular liquids such as phosporous [2], and water [3]. Performing such simplifications yield models that are analytically and computationally tractable but which, one hopes, nevertheless retain the qualitative physical features of the real systems they seek to describe.
Notwithstanding their relevance to real anisotropic systems, model CS systems have long been studied for their intrinsic physical interest [4, 5, 6, 7, 8]. Indeed it is well established, that they exhibit significantly richer phase behaviour than conventional single component fluids. For instance, in certain CS models an isostructural solid-solid phase transition is observed, accompanied by a solid-solid critical point [5, 9]. But perhaps the most intriguing feature of core-softening is the prediction that it may engender a demixing transition between two liquids of different densities, distinct and additional to the usual liquid-gas phase transition.
The first suggestions along these lines came from the perturbative calculations of Stell and co-workers [4, 5] more than 30 years ago. Much more recently, Stanley and co-workers [10, 11, 12] have presented simulation evidence apparently supporting the existence of a liquid-liquid phase transition in a two-dimensional (2d) system of CS particles. These studies show that on reducing the temperature at constant pressure, a maximum occurs in the density, whilst the compressibility passes through a minimum before subsequently rising strongly as the system approaches the freezing transition. These thermodynamic anomalies, specifically the rise in the compressibility with decreasing temperature, were attributed to the existence of a liquid-liquid critical point (termed the “second critical point”). No direct evidence for this critical point was found in the stable liquid region. However, a power law extrapolation of the measured increase of the compressibility as a function of temperature, suggested that a critical point may lie hidden within the stable crystalline region. This proposal, that the thermodynamic anomalies are linked to a metastable second critical point, was reinforced by mean field calculations, based on a simple cell model. These were reported to indicate a critical point whose location was consistent with that found from extrapolation of the measured rise in the compressibility.
The discovery of thermodynamic anomalies in CS fluids mirrors similar findings in liquid water [13, 14] close to the freezing transition. The apparent connection with a second critical point lends weight to the hypothesis that a metastable liquid-liquid critical point may be responsible for the celebrated anomalous behaviour of water [13, 15, 16, 17]. Although no compelling evidence for a liquid-liquid phase transition in supercooled water has yet been reported, there does exist a variety of indirect experimental and theoretical data favouring the proposition [18, 19, 20]. Additionally, there is evidence for liquid-liquid phase transitions in a number of other single component systems such as liquid molecular phosporous [2], graphite [21], silica [22, 23], as well as certain molecular models that take directional bonding into account [24, 25].
To date, most studies of second critical points in CS systems appear to indicate a liquid-liquid transition that is metastable with respect to crystallization [12, 26, 27]. By contrast, Jagla [28] has recently presented Monte Carlo (MC) simulation results for a CS model which, he submits, provides evidence of a stable liquid-liquid critical point. This model differs from many other CS models (see eg. ref. [10]) in that rather than having a pronounced shoulder in the potential, the softening takes the form of an inclined linear ramp. Studies of the model found van-der-Waals type loops along isobars and evidence of a liquid-phase density anomaly.
Inspired by the above findings, we have attempted to gather further simulation evidence for the existence of liquid-liquid critical points in core softened models. Our approach employs a variety of Monte Carlo simulation methods tailored to the efficient study of liquid and solid phases and their critical points. We investigate two CS models, qualitatively distinct in character. The first is the “shoulder” potential initially proposed by Sadr-Lahijany et al [10], which we study in 2d. The other is Jagla’s “ramp” potential [28] which we study in 3d.
The main features of our results are as follows. In the 2d shoulder model we reproduce the phase diagram found in ref. [10] and present new results concerning the solid-solid phase transitions. We then proceed to a detailed study of the liquid phase, focusing attention on the density and compressibility anomalies and their finite-size behaviour. Our results show that rather than being linked to a metastable liquid-liquid critical point, these anomalies are instead associated with the freezing of the liquid to a 2d solid of lower density via a quasi-continuous phase transition. We also report cell model mean-field calculations for the shoulder model. These, however, do not support the existence of a liquid-liquid critical point reported on the basis of similar calculations in ref.[10].
Our studies of the 3d ramp model deploy isothermal-isobaric MC simulation methods to study the reported finding of a stable second critical point [28]. We indeed confirm the existence of this point, and determine its parameters to higher precision that obtained previously. Using multicanonical MC sampling and histogram reweighting techniques, we map the liquid-liquid and liquid-gas coexistence lines to high precision. Investigation of the low density liquid phase confirms the existence of maxima in the density and compressibility. In contrast to the shoulder model, these anomalies are found to be authentic i.e. they are not the result of an incipient new phase. We trace the locus of density and compressibility maxima and find that the former appears to converge on the liquid-liquid critical point, while the latter intersect the phase boundary somewhat below the critical temperature.
II Shoulder model
The first CS model we consider takes the form of a - Lennard Jones (LJ) potential whose attractive tail is modified by the addition of a Gaussian well centered on radius .
| (1) |
In common with ref. [10], we have studied this model in two-dimensions employing potential parameters values . Additionally, a cutoff was imposed at for which no correction was applied. The form of the resulting potential is shown in fig. 1. From the figure, one see that in the core and tail regions, the potential closely approximates the LJ form. Close to , however, the potential is dominated by the inverted Gaussian, the effect of which is to generate a shoulder in the core.
We have studied the gas, liquid and solid phases of this model using MC simulation techniques. In the following subsections we describe our results for each region of the phase diagram in turn.
A The liquid-gas and sublimation lines
In terms of computational tractability, the liquid-gas transition line is the most straightforwardly obtained feature of the phase diagram because it lies in a region of relatively elevated temperature, where acceptance rates for Monte Carlo moves are generally high. Experience with a variety of fluid models has shown [29, 30, 31] that a combination of grand canonical ensemble (GCE) simulations [32], multicanonical preweighting [33] and histogram reweighting [34] provides an efficient means of tracing a liquid-gas coexistence curve. Details of the implementation can be found in refs. [29, 31], but the basic strategy is to focus on the fluctuations of the number density ; more specifically, the number density probability distribution function . Precisely at coexistence, this distribution is doubly peaked with equal integrated weight (area) under each peak [35]. For each chosen value of the reduced temperature , coexistence is located by tuning until the measured satisfies this equal peak weight criterion.
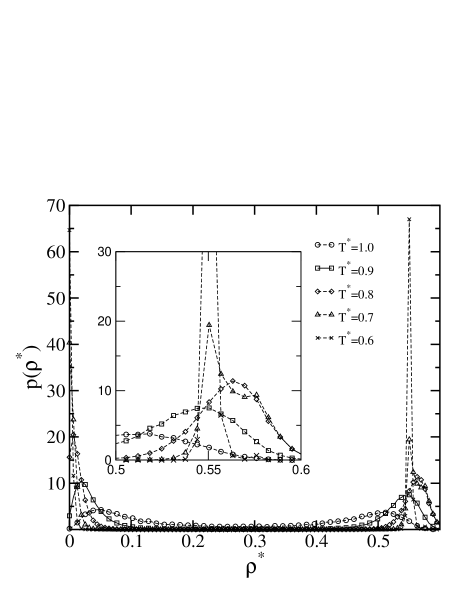
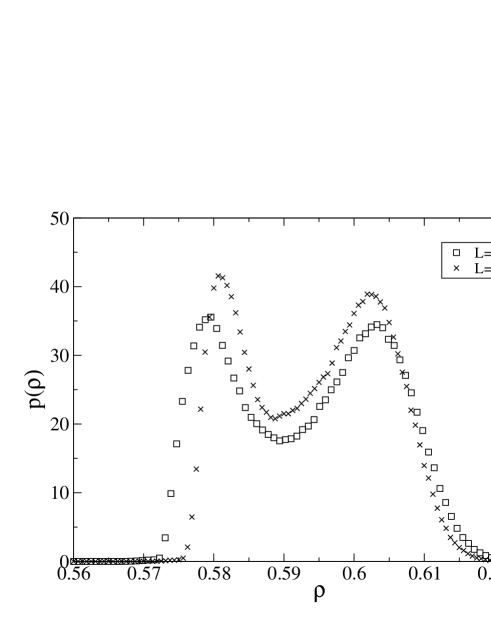
We have measured the form along the liquid-gas coexistence curve, starting near the critical point. The simulations were performed for systems of linear dimension and . A selection of coexistence distributions for the larger system size are presented in fig. 2(a). In the vicinity of the liquid-gas critical point the two peaks are quite close together and the trough separating them is shallow. In principle, the critical temperature can be estimated precisely by employing finite-size scaling (FSS) methods according to the approach described in [36, 29]. However, as the critical behaviour is not the principal focus of the present study we have not performed a full FSS analysis. Instead we obtained an approximate estimate of the critical parameters by tuning and until matches the known universal fixed point form of the order parameter distribution function appropriate to 2d Ising universality class [36]. This yielded the estimate .
As the temperature is decreased below its critical value, the trough separating the peaks deepens and the peak densities separate in the usual way [36]. On reaching , however, an interesting feature emerges–the liquid peak bifurcates, with a new narrow peak appearing on its low density side (fig. 2(a)). On further reducing temperature, this new peak grows at the expense of the original peak. Below only the new peak remains.
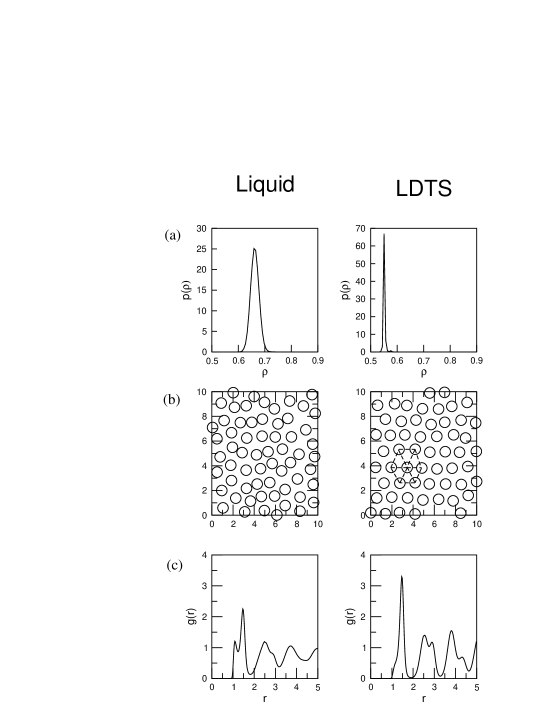
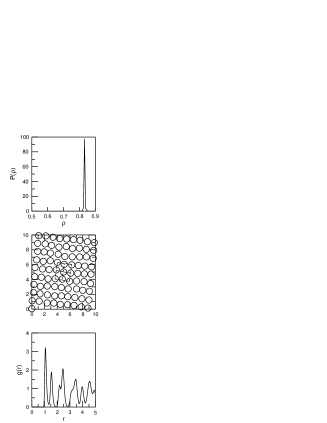
The appearance of three peaks in at is suggestive of a triple point. In order to identify the phases involved, we have examined the structure of configurations having densities close to those of the peaks. The lowest density phase, having is immediately identifiable as a gas phase. In order to isolate the two high density phases, we studied temperatures slightly above and below . Snapshot configurations and measurements of the radial distribution function for the system (fig. 3(a)) show that above the system is liquidlike, having a nearest neighbor distance corresponding to the radius of the shoulder in the potential. Below , the high density phase (which has a density less than that of the liquid, see fig. 3(a)) is a 2d solid of triangular symmetry, with a nearest neighbor distance consistent with the radius of the potential minimum (c.f. fig. 1). This is the low density triangular solid (LDTS) identified in ref. [10].
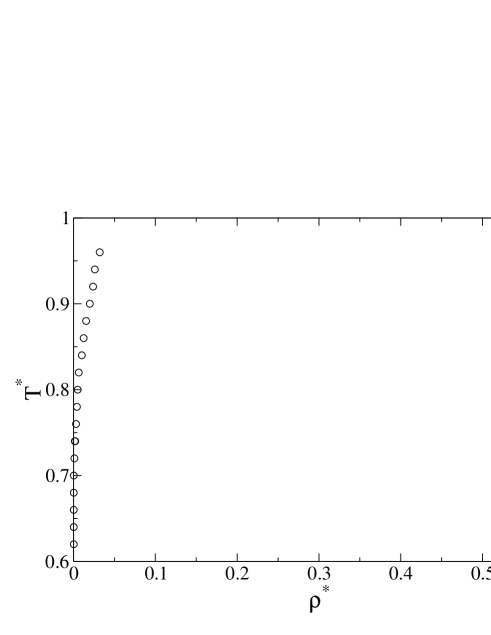
Generally speaking, GCE Monte Carlo is unable to deal well with solid phases due to the very low acceptance rate for particle exchange moves at typical solid densities. In the present case, however, it turned out to be possible to follow the sublimation line to temperatures considerably below that of the triple point because of the unusually low density of the LDTS. Our results (fig. 4(a)) show that the density of the LDTS remains constant within the resolution of our density scale. This finding would appear to reflect the fact that the functional form of the potential minimum in which the particles reside, is approximately symmetric (it is Gaussian), implying that there is no energetic advantage of contraction over expansion.
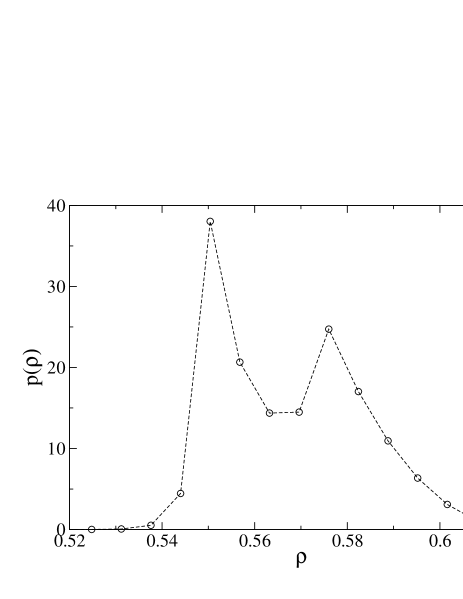
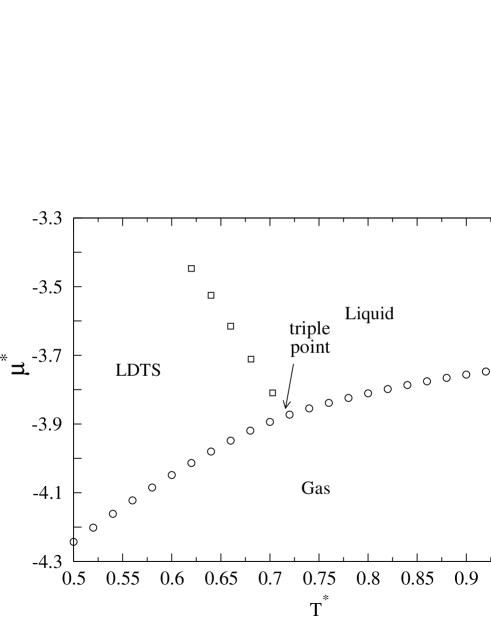
Figs. 4(b) show the liquid-gas and sublimation lines in the space of –. Overall, little system size dependence was observed in the locus of the liquid-gas and LDTS-gas coexistence lines. A notable exception was the neighborhood of the triple point at which the LDTS, liquid and the gas all coexist. This point marks the start of a coexistence line between the LDTS and the liquid. Because the solid is less dense than the liquid with which it coexists, the gradient of this coexistence line is negative, as mandated by the Clausius-Clapeyron equation. A portion of the LDTS-liquid coexistence line was estimated by histogram reweighting the triple point data for the system size. The results, (included in fig. 4(b)) were obtained by tuning and such as to maintain both a liquid and a solid peak in (cf. fig. 2(b)) for an example distribution) . It was subsequently found, however, that the locus of the LDTS-liquid line exhibits large finite-size effects; specifically it shifts to lower temperature with increasing system size. We shall address this matter in detail in sec. II B, where we also present a more accurate estimate for the LDTS-liquid coexistence boundary.
B Liquid-solid transitions and thermodynamic anomalies
In this section we consider the properties of the liquid phase and its freezing behaviour. These have been investigated by means of GCE simulations conducted along two lines of constant chemical potential, one having and the other having . Simulation runs were performed at a number of selected temperatures along both iso- lines, extending from the freezing point up to . The principal observable recorded in each run was the instantaneous density, the fluctuation spectrum of which permits construction of the density distribution (accumulated as a histogram) and thence evaluation of the average density and the compressibility .
The data from the complete set of runs performed along each iso- line, were combined self consistently within the multihistogram framework [34]. Histogram reweighting was then employed to accurately interpolate into the regions of temperature intermediate between the simulation state points. In order to allow assessment of finite-size effects in the results, this procedure was repeated for five system sizes: and . For the largest system sizes, reliable histogram extrapolation necessitated runs at ten different temperatures along an iso- line. For the smallest system sizes, five simulations proved sufficient.
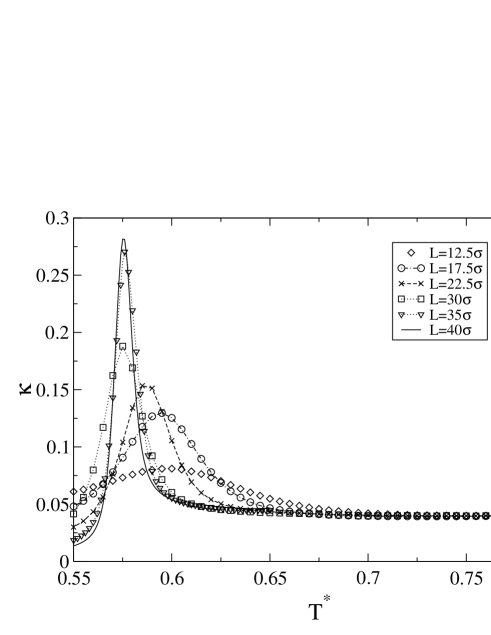
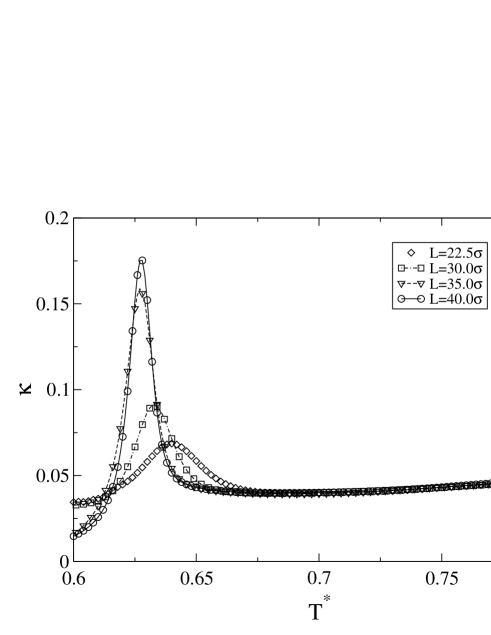
Fig. 5 shows the measured finite-size dependence of the compressibility for . One observes that on reducing the temperature, the compressibility passes through a shallow minimum at , before rising strongly to a peak. The position of this peak is, for the smaller system sizes, strongly finite-size dependent, moving both to lower temperature and becoming considerably sharper as increases. For the two largest system sizes ( and ) there is, however, relatively little difference in the peak height or position, which lies at . We postpone detailed discussion of this finite-size behaviour until sec. IV.
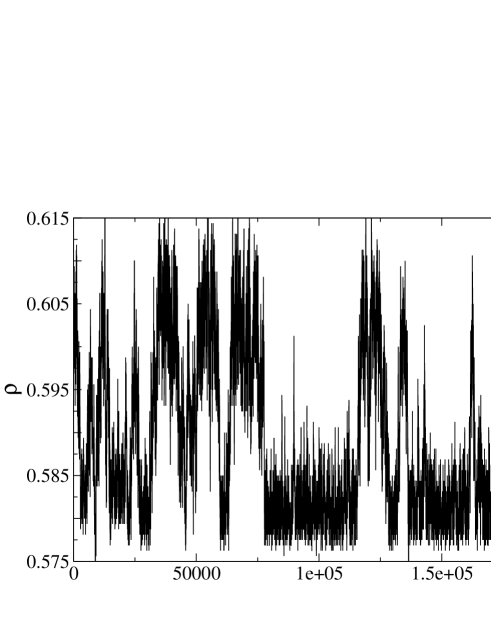
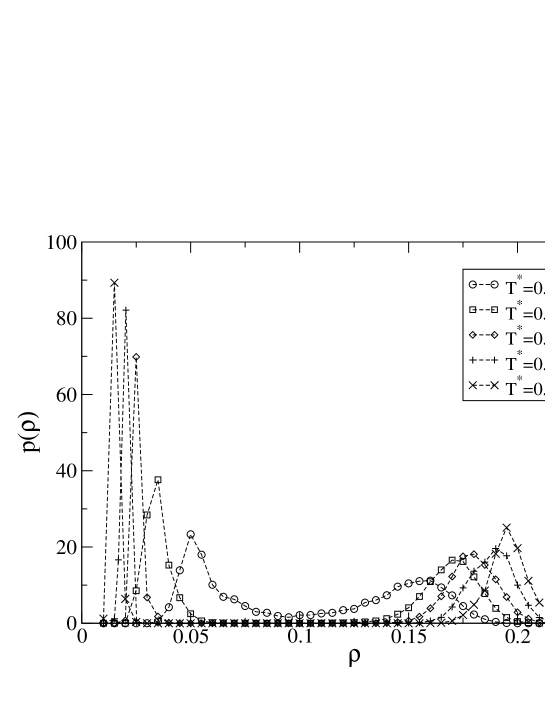
The increase in the compressibility is traceable to a widening of . In order to clarify the physical origin of this effect, it is instructive to examine the time evolution of the system density for the largest system size at the temperature for which the peak occurs. A representative portion of this evolution is shown in fig. 6(a). Clearly there are two regions of preferred density, and a substantial density autocorrelation time associated with each. Fig. 5(b) displays the density distribution , for the largest two system size. These exhibit a double peaked structure. The increase in the compressibility reflects the widening of as the double peaked structure develops.
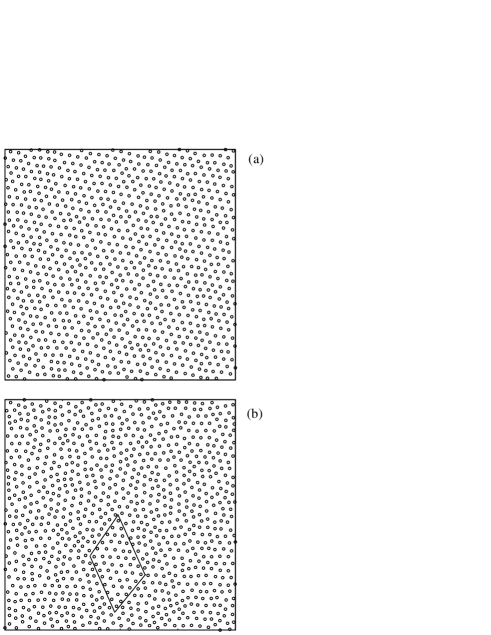
The double peaked form of suggests that two distinct phases coexist at the temperature of the compressibility peak. To investigate this matter further, we have studied the configurational structure at temperatures slightly below and above the peak temperature. Representative snapshots are shown in fig. 7. At a temperature, , below the transition, fig. 7(a) shows the presence of long ranged translational order (on the scale of our system size) in the form of a triangular lattice. This we associate with the LDTS. At , above the temperature of the compressibility maximum, fig. 7(b) shows that the system is clearly non-crystalline. There is, nevertheless, evidence for substantial clusters of LDTS-like structure, one of which we have indicated in the figure.
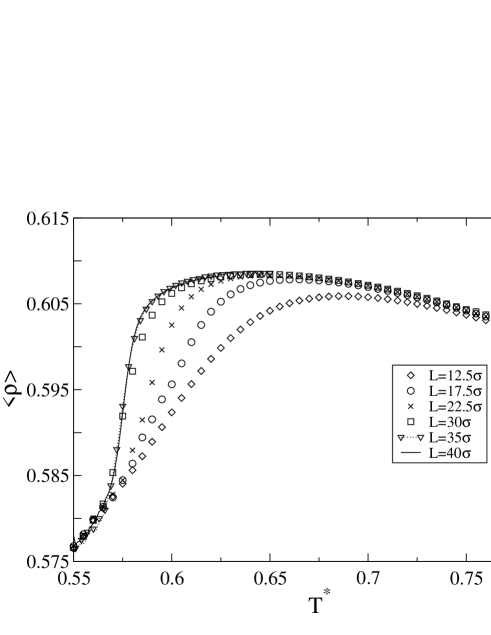
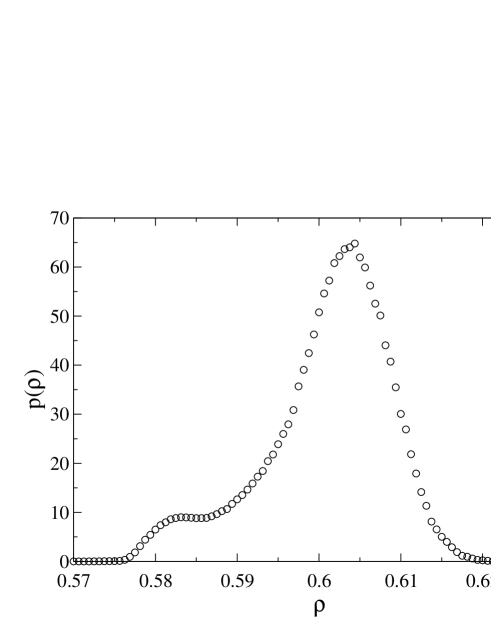
We have also obtained the temperature-dependence of the average density, the finite-size behaviour of which is shown in fig. 8(a). One sees that as temperature is decreased, the density rises to a peak, before falling rapidly to a lower value. The peak temperature initially shifts to lower values as the system size increases, but seems to converge for the largest systems to a value higher than that to which the compressibility maximum converges. We find that the temperature at which the density starts to fall rapidly, coincides with the first appearance of a subsidiary peak in the density distribution for all systems sizes (cf. fig. 8(b)). This peak occurs at the same density as the lower density (LDTS) peak in fig. 6(b) and is thus indicative of infrequent fluctuations of the system into the solid phase.
Taken together, the above findings suggest that the thermodynamic anomalies are tied to the liquid-LDTS freezing line and not a buried critical point. If so, then similar behaviour should be expected all along the freezing line. That this is indeed the case is confirmed by our results for . This line intersects the LDTS melting curve close to the gas-liquid-LDTS triple point at a temperature of . The associated measurements of the compressibility (fig. 9) display finite-size effects whose magnitude is comparable, if not greater than, those observed for . The main difference is that for a given system size, the height of the maximum in the compressibility is some less than at .
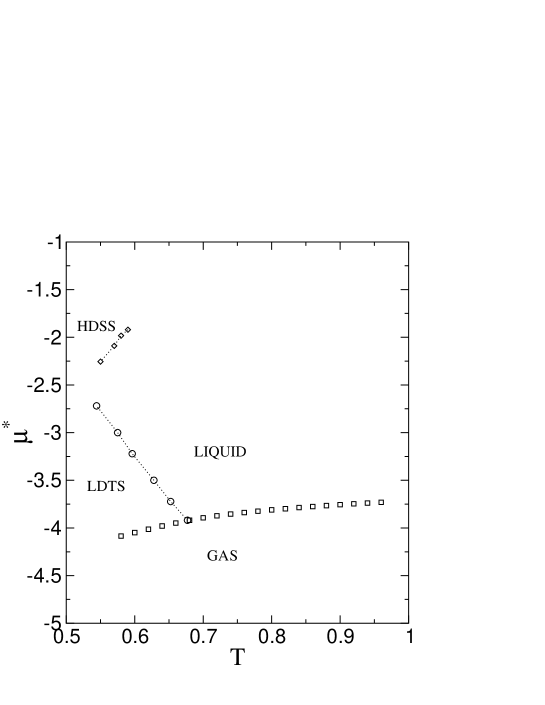
Having located two coexistence state point on the LDTS melting line, a number of further simulations were performed (for the system size) to trace out the whole coexistence line. This was identified as the locus of compressibility maxima. The choice of state points for these runs was guided by histogram extrapolation of the existing coexistence data. For each studied, visual checks were made of configurations at temperatures either side of the compressibility maximum in order to confirm that the line of maxima coincides with the freezing line. The results are shown in fig. 10, together with the liquid-gas and sublimation lines determined in sec. II A.
Fig. 10 shows that the LDTS melting line is bounded by two triple points: the gas-LDTS-liquid point at low end, and a triple point involving the liquid, LDTS and a high density square solid (HDSS) phase at high . The HDSS phase was first reported in ref. [10]. For values of exceeding that of the latter triple point, the liquid freezes into the HDSS rather than the LDTS. We attempted to map the liquid-HDSS coexistence curve. Unfortunately, at the densities prevailing near this line, our GCE algorithm becomes very inefficient due to a low acceptance rate for particle transfers. This prevented us from studying large system sizes and from determining the finite-size behaviour of the transition. We have therefore only be able to determine a limited portion of its locus for one small system of size . The results (fig. 11), confirm that the HDSS has a square lattice exhibiting quasi long ranged order. The associated estimate of the freezing line for this system size is included in fig. 10.
C Cell theory calculations
Ref. [10] offers direct evidence for the existence of a second critical point in the 2d shoulder model in the form of a mean-field cell theory calculation. This was reported to show a liquid-liquid critical point whose position was consistent with the extrapolation into the stable crystalline region of the simulation measurements of the compressibility. In this section we detail our attempts to follow up this finding.
Cell theory was first proposed by Lennard-Jones and Devonshire [37] and a description of the method can be found in refs. [38, 39]. Within the framework of the 3d model, particles are considered to be localized in singly occupied spherical “cells” of volume and radius , centered on the sites of a fully occupied lattice of some prescribed symmetry. A particle in its cell is considered to interact with its nearest neighbors “smeared” around the surface of a further sphere of radius concentric with the cell. The volume of this “interaction sphere” is related to the cell volume by where is a lattice-dependent constant, chosen so that for a primitive unit cell of volume the lattice parameter will be the radius of the interaction shell .
The Gibbs free energy per particle of the model is given by
| (2) |
Here is the “ground state energy” - the energy per particle if all occupied their lattice sites; is a constant “communal entropy” term [40], which attempts to account for the entropy lost due to the localization of particles within cells; and is the “free volume”,
| (3) |
with the “cell potential” the interaction energy of a particle at a position within its cell. If neighboring particles are assumed to be smeared over the interaction shell and the interparticle potential is given by , the total energy of the particle is given by
| (4) |
One normally performs this integration numerically with further numerical integration to calculate the free volume according to eq. 3 and Gibbs free energy for a given choice of number density .
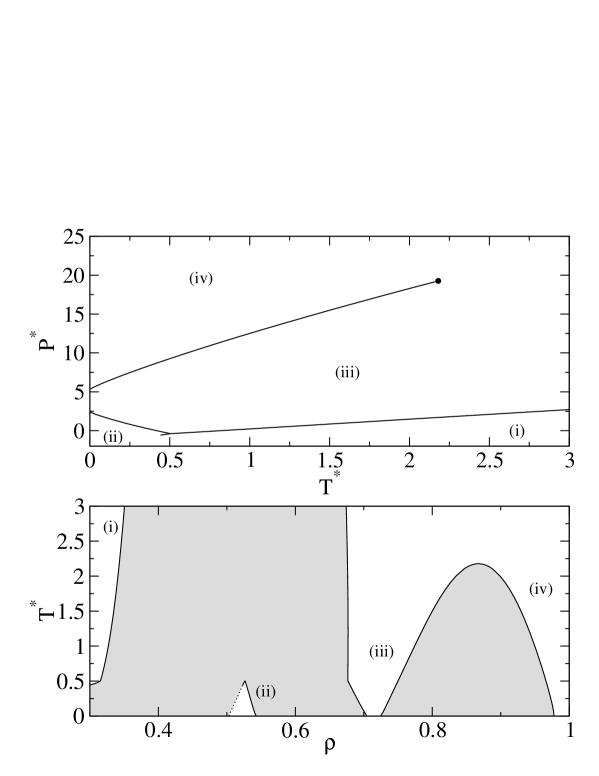
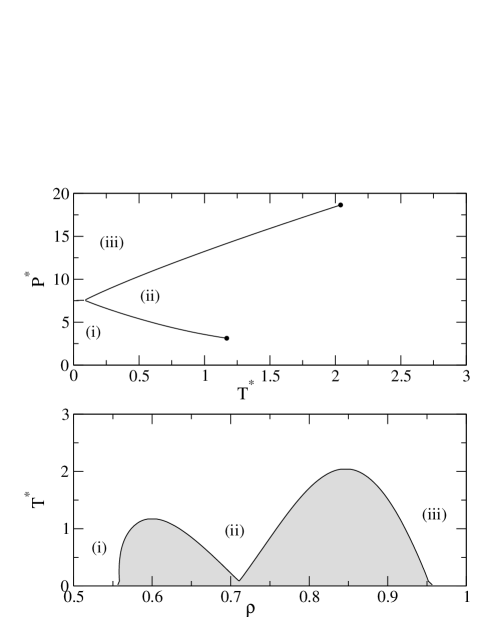
We have obtained the 2d cell theory phase diagram of the potential of equation 1 in order to compare with the results of [10]. Our study employed a triangular lattice of cells with parameters and . The results are shown in fig. 12(a). The phase diagram exhibits four separate phases, which we have labelled (i)-(iv), delineated by first order coexistence lines (solid curves). In the case of phases (i) and (ii), we were unable to follow the coexistence line right down to zero temperature, because phase (i) has a density lower than can be represented by the precision of our calculations. We have therefore simply extrapolated the measured portion using a linear fit (shown dotted).
While no theory based on a prescribed underlying lattice can provide an unambiguous representation of fluid phases or crystalline solids of arbitrary structure, a plausible identification of the phases can nevertheless be made by examining their associated cell potentials . For phases (i),(ii) and (iii), these have been calculated at their triple point, permitting a direct comparison under identical conditions of and . The results are shown in fig. 13(a)-(c). The cell potential at coexistence between phases (iii) and (iv) are compared in fig. 13(d)-(e). Inspection of fig. 13(e) shows that the cell potential for phase (iv) displays a strong minimum at the cell center (i.e. at the lattice site). allowing us to identify this phase as solidlike. By contrast, for phase (i), the cell potential (fig. 13(a)) has a non central minimum and, as such, would be unstable as a lattice phase. Since the density at which the minimum occurs is low, we tentatively assign this as gaslike. Similar arguments suggest that phase (iii) is a fluid (fig. 13(c)) and, because it is denser than phase (i), and separated from it by a first order phase transition, liquidlike in character. Additionally, at high temperature (off the scale of our figure), we find a critical point terminating the first order line of coexistence between phases (i) and (ii). Finally, the cell potential for phase (ii) shown in (fig. 13(b)) exhibits a deep minimum at the lattice site, suggesting it is solidlike.
Given these assignments, a resemblance is evident between fig. 12(a) and that found by simulation (fig 10). Most strikingly, the freezing transition between phases (iii) and (ii) displays a negative gradient as found in the simulations. Moreover, the phase diagram seems to exhibit a second critical point, terminating the line of coexistence between phases (iii) and (iv). However, given the previous identification of phase (iii) as liquidlike and phase (iv) as solidlike, such a second critical point has no physical counterpart. Furthermore, it should be stressed that its appearance is not a unique feature of the CS potential, as we have recently shown [39] in cell theory studies of the 12-6 Lennard-Jones (LJ) potential. Here too, two critical points we found; an artifact critical point terminating the liquid-solid transition and another, a liquid-gas critical point. The latter had not hitherto been reported in the literature, whilst the artifact critical point had previously been mistaken for the liquid-gas critical point. The appearance of artifact critical points appears to be symptomatic of the fact that, owing to its lattice-based character, cell theory cannot properly represent the inherently disordered nature of liquid phases.
We have found no evidence for a fluid-fluid phase transition additional to the liquid-gas transition in the core softened potential. The artifact critical point we do find is far removed in the phase diagram from the second critical point reported in ref [10]. However, the formulation of cell theory reported there, appears to differ from the traditional implementation in that it neglects ground state terms in the potential [42]. In view of this, we have also obtained the phase diagram for this version of the theory. The results (fig. 14) display qualitative differences from those of the more conventional formulation we have described. In particular there appears to be no liquid-vapor transition. There are, however, two critical points, although both appear to be artifacts of the cell theory, one terminating the low pressure solid-liquid coexistence and the other terminating the high-pressure solid-liquid line. Neither can be considered to terminate a liquid-liquid transition and neither is located in the general vicinity of that reported in ref [10].
D Solid-solid transitions
We have investigated the solid phases of the 2d shoulder model as a function of temperature and pressure using a combination of analytical and simulation methods. Our motivation for doing so was to check for the existence of an isostructural solid-solid critical point, such as that seen in other CS models [5, 9]. The large fluctuations associated with such a critical point (and with the associated hexatic phases known to occur in 2d systems [44]), might complicate the interpretation of liquid phase thermodynamic anomalies.
Our investigation of the solid phases begins by performing analytical calculation based on the harmonic approximation (HA). These supply results which, whilst exact in the low-temperature limit, lose accuracy with increasing temperature. They are thus used as a starting point for direct simulations of lattice-lattice phase coexistence using the Lattice Switch Monte Carlo (LSMC) method [45, 46, 47]. Whilst powerful, we found that for this particular model LSMC becomes inefficient as melting is approached owing to extended sampling times caused by a significant defect concentration. Thus we turn at high temperature to Gibbs-Duhem integration which provides a faster, though less accurate approach to tracing coexistence curves.
Both the HA and LSMC approaches are designed for studying solid phases. However they share a common problem, namely that rather than predicting which of the set of possible crystal lattice occurs, a chosen subset of lattices must be proposed and checked against one other for relative stability. In this work, we only consider the possibility of square and triangular (hexagonal) lattices, these being the ones observed in the original work [10]. It is, nevertheless, possible that other stable lattices may exist (see ref. [8] for an example).
Harmonic approximation studies
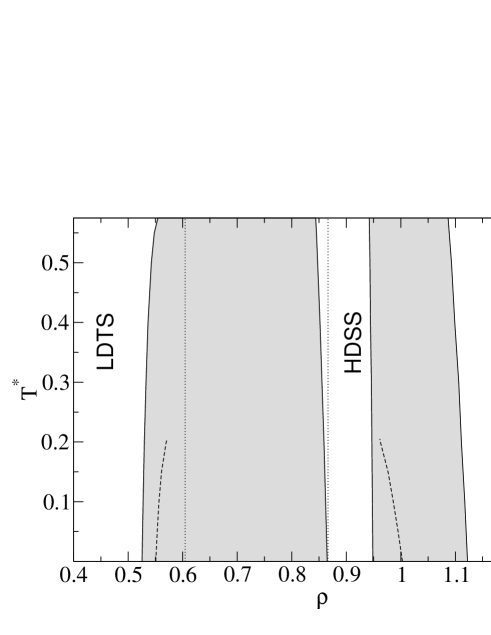
Harmonic approximation (HA) calculations [43] have been performed for a system of particles on both square and triangular lattices. Coexistence lines were located by using a Newton-Raphson root-finding algorithm [41] to solve for conditions of equal pressure and Gibbs free energy. The results are presented in figs. 15 and 16 and show three transition lines. At very low pressure, an open triangular lattice phase (LDTS) is stable, which transforms to a dense square lattice phase (HDSS) on increasing pressure, in line with the results of ref. [10]. At very high pressure, this dense square lattice undergoes a transition to a new dense triangular lattice phase (HDTS). The third transition line occurs at intermediate pressure, and is isostructural, separating LDTS and HDTS phases, both metastable with respect to the square lattice phase.
The existence of a stable square lattice phase is unusual. In the case of the shoulder potential, however, the lattice has nearest neighbors sitting in the minimum of the Lennard-Jones part of the interaction potentials, and is stabilized through second-nearest neighbors sitting in the deep Gaussian well part (cf. fig. 11(c) and fig. 1). We find that if second-nearest neighbor interactions are “turned off”, the presence of the square lattice is completely suppressed.
We have calculated the coexistence lines for reduced temperatures up to . The “hidden” isostructural line finishes at , whilst the LDTS-HDSS line ends at . In both these cases, the transition line ends because the root finding algorithm cannot identify a coexistence volume for the LDTS phase which is mechanically stable within the approximation. In the case of the LDTS-HDSS transition, this probably indicates approach to melting and the associated breakdown of the approximation. In the case of the hidden isostructural transition, this could simply be a point beyond which the LDTS phase loses mechanical stability, or it could indicate approach to a hidden isostructural critical point (the associated fluctuations of which would also cause breakdown of the approximation). If there is a hidden isostructural critical point, with any associated region of hexatic phase stability [44], we note that it would be at far too high a pressure to be in any way associated with the thermodynamic anomalies noted in the liquid phase.
The HDTS-HDSS coexistence line continues across the region we have checked; its only peculiarity is that it passes through a pressure maximum at around . From the Clausius-Clapeyron equation, , we know that passing through this point with increasing temperature, the entropy difference between the HDSS and HDTS phases changes sign. We suggest that at low temperatures (where particles remain close to their lattice sites) the greater entropy of the square lattice reflects its larger volume. With increasing temperature, however, particles in the triangular lattice will be free to explore an ever greater region of configuration space, whilst those in the square lattice will be constrained by the conditions on the positions of second-nearest neighbors necessary to maintain mechanical stability. Accordingly the square lattice will have lower entropy.
Lattice Switch Monte Carlo and Gibbs-Duhem integration studies
At high temperature, or on approaching the melting transition, the HA breaks down. We have therefore used our HA results as the starting point for a method which uses direct two-phase simulation of coexisting solid phases - Lattice Switch Monte Carlo (LSMC) [45, 46, 47]. Our implementation of LSMC is similar to that described in reference [47], except that we operate in the constant- ensemble [32], and as such our order parameter is the difference in enthalpy, , between conjugate pairs of configurations. In addition to alternating between different sets of lattice vectors, our lattice switch move also alters the aspect ratio of the box between (for a square lattice) and (for a triangular lattice)[50], and adds a lattice-dependent scaling factor to move between the different characteristic volumes for each phase (determined by two short single-phase simulations at the state point).
LSMC simulations were performed for both the LDTS-HDSS and HDSS-HDTS coexistence lines for a system of particles. Whilst metastable triangular phases of the correct volumes for the hidden isostructural transition were found at low pressure, their lifetime in a Monte Carlo run was insufficient for simulation of coexistence. For the HDSS-HDTS transition, simulations were performed at two low-temperature state points on the phase boundary to verify its existence; coexistence was found at and . These results agree well with those from the HA.
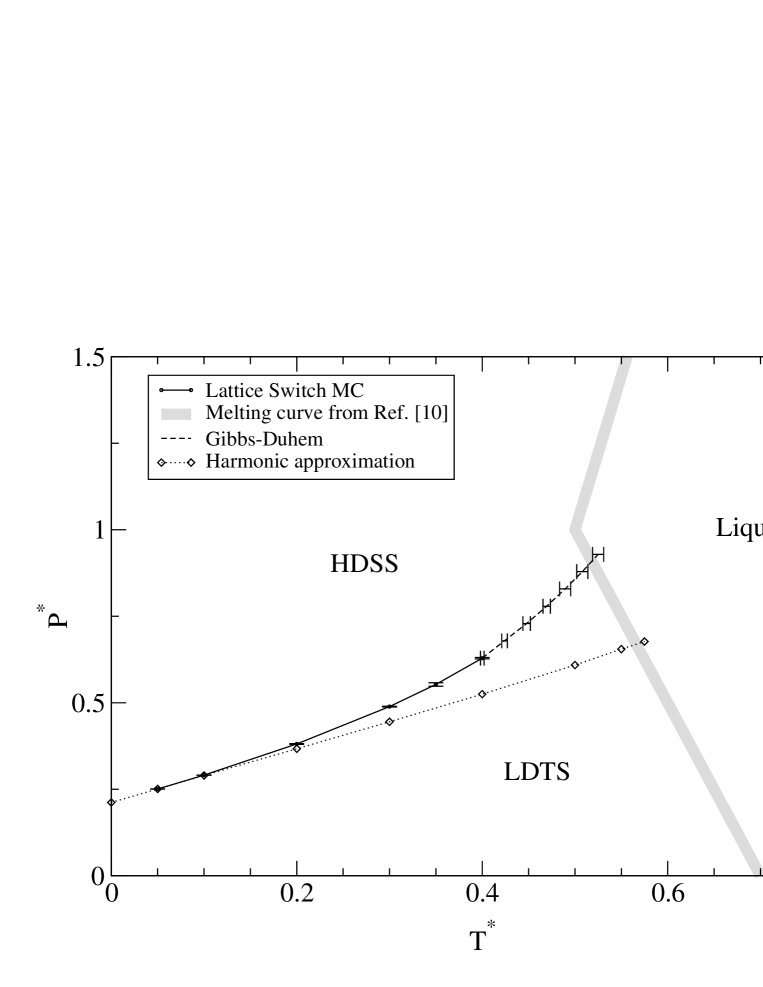
Results from our LSMC simulations for the LDTS-HDTS line are shown in fig. 17. Up to a reduced temperature of , these agree well with the HA results, but above this temperature the simulation coexistence line lies at higher pressures than the HA coexistence line. This is to be expected, since the HA is unlikely to deal well with the very low density of the LDTS phase.
As the temperature was raised above , the LSMC method was found to become increasingly less efficient. An essential aspect of the method is to bias the phase space sampling such that the system regularly samples configurations in which the particles are very close to their lattice sites. As the melting temperature was approached, this became progressively more problematic, due to an increase in the defect concentration. Indeed the presence of such defects is well known to be a feature of 2d melting [48]. Once the reduced temperature was reached, the problem became so severe that use of LSMC was no longer feasible. It was therefore decided to continue tracing the coexistence curve to higher temperatures using Gibbs-Duhem (G-D) integration [49, 32]. This involves performing separate single phase simulations at a coexistence state point, from which the slope of the coexistence curve is estimated via the Clausius-Clapeyron equation. Integration of this equation allows the locus of the coexistence line to be tracked. The G-D method assumes nothing about the coexisting phases apart from that they are (meta)stable over the timescale of the simulations, and is both efficient and easy to perform. Our G-D implementation employed a simple two-step trapezoid predictor-corrector integrator [41]; the results are shown as the dashed line in fig. 17. We see that the G-D estimated coexistence line smoothly extends the LSMC line, up to a temperature ; above this temperature, the triangular lattice phase was observed to melt. This coexistence line terminates at a temperature which agrees (within error) with the melting curve estimated by Sadr-Lahijany et al [10], but at a pressure significantly less than their estimate for the triple point.
III Ramp model
Jagla [28] has recently presented a MC simulation study of a 3d CS fluid described by the potential
| (5) | |||||
| (6) | |||||
| (7) | |||||
| (8) |
with . The form of this potential is depicted in fig. 1.
Using canonical ensemble (constant-NVT) MC simulation, Jagla obtained the pressure as a function of system volume for a 3d system of particles. Van der Waals loops were observed in the measured curves, suggestive of the existence of a phase separation between a low density liquid (LDL) and a high density liquid (HDL). The critical point of this transition (measured as the temperature above which the loops disappear) was reported to occur at the low temperature of . Additionally an anomalous increase in the density of the low density liquid was observed with increasing temperature.
A loop in a curve below the critical temperature, instead of a flat region, is a finite-size artifact of the constant- ensemble and as such cannot be regarded as an unambiguous indicator of a phase transition. In view of this, we have attempted to corroborate Jagla’s findings for the 3d ramp model in greater detail, using simulation methods designed for studies of fluid phase coexistence. Initially we sought to perform GCE simulations, close to the reported location of the LDL-HDL critical point. Unfortunately, these proved extremely inefficient due to a very low acceptance rate for particle transfers at these parameters. The results we report here instead derive from simulations within the isothermal-isobaric (constant-) ensemble [32] which, in the low temperature regime, proved considerably more efficient than the GCE. Notwithstanding its greater efficiency, use of the constant- ensemble did not permit the study of very large system sizes. This problem is traceable to the method’s general inefficiency in the context of hard-core fluids, and stems from the necessity of rejecting all proposed volume contractions that result in a hard core overlap. Consequently, we were able to study only three system sizes, comprising , and particles respectively.
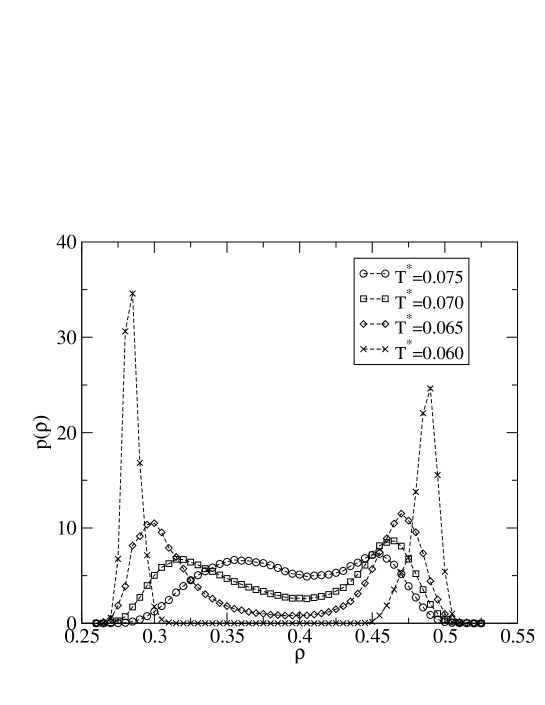
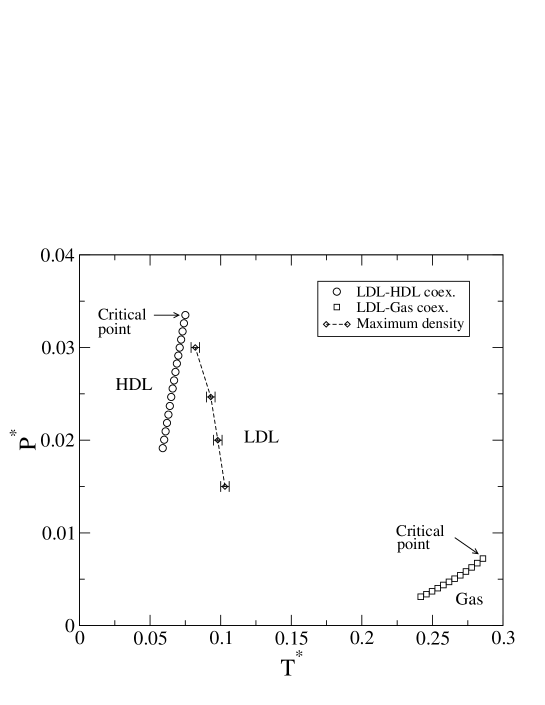
Our studies revealed two fluid-fluid phase boundaries. One, a liquid-gas line occurs at high temperature and low pressure; the other separates an LDL phase from a HDL phase, as previously reported by Jagla [28]. To track these boundaries, we utilized multicanonical sampling and histogram reweighting techniques in the manner described in ref. [29] to yield the coexistence forms of the density distribution (cf. sec. II A). The tracking procedure was initialized near the critical point and followed the phase boundary down in temperature until the simulations became too slow to continue. A selection of coexistence density distributions from each phase boundary is shown in figure 18. The associated phase diagram in the plane appears in fig. 19. Matching to the known universal form of the order parameter distribution [36, 29] allows us to estimate the critical parameters. The LDL-gas critical point lies at , and has an unusually low critical density of . The critical point of the LDL-HDL boundary lies at . We note that to within the precision of our measurements, the LDL-HDL phase boundary is linear, while the LDL-gas phase boundary exhibits a positive curvature. It is also apparent that the two phase boundaries are very well separated in the phase diagram. Since we were unable to probe the region of very low temperature, we cannot say whether or not there exists a triple point between the gas, low density liquid and the high density liquid. It seems more likely that both phase boundaries terminate in solid phases.
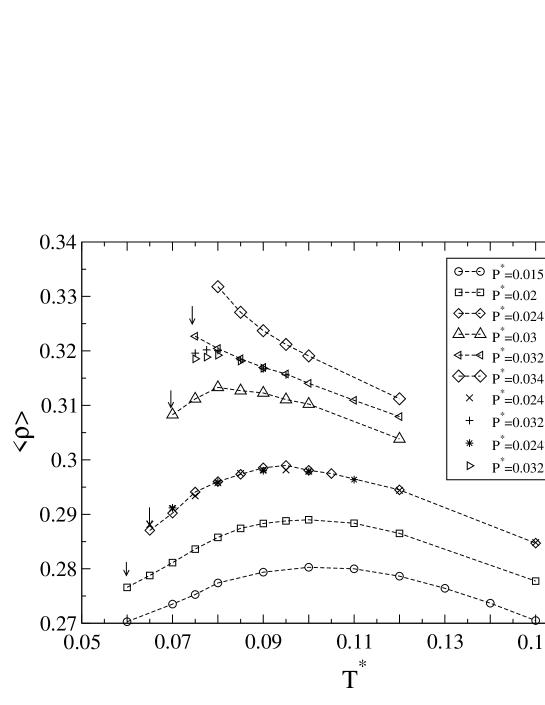
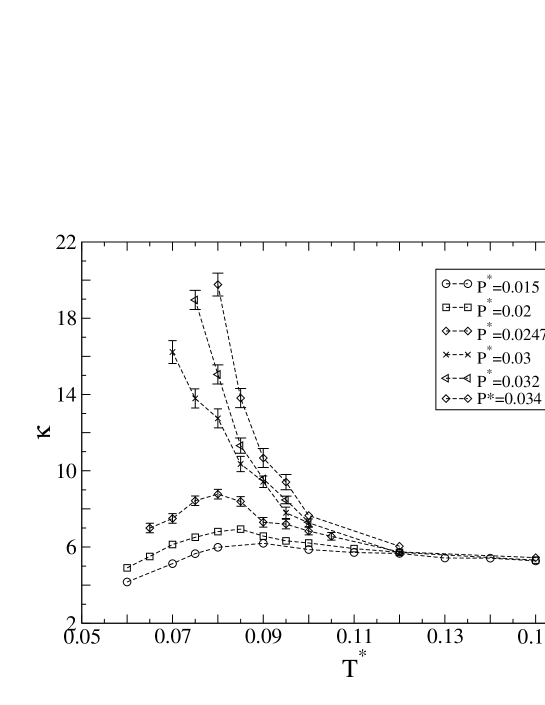
Jagla [28] observed thermodynamic anomalies in his curves of the LDL phase, but did not trace their path through the phase diagram. We have sought to do so by measuring the number density and compressibility along isobars, starting at the LDL-HDL transition and increasing in temperature. The results can be seen in fig. 20(a) and (b) respectively. One observes that for there is both a density and a compressibility maximum at temperatures well in excess of the LDL-HDL coexistence values. Well away from the critical point (at ), comparison of the data for the three system sizes indicates no significant finite-size effects in the form of the density maximum [51].
On increasing the pressure towards its critical value, the height of the compressibility peak grows. Additionally, the temperature at which the maxima occur shifts closer to the coexistence curve. In this regime, we do see finite-size differences in the form of the density maximum. In particular, the density maximum which is not visible at for , reappears very close to the coexistence curve for and (fig. 20(a)). The line of density maxima as a function of pressure for , is included on the phase diagram of fig. 19. The line intersects the coexistence curve slightly below the second critical point. In view of the observed finite-size dependence of the density maximum, it seem likely that in the thermodynamic limit, the maximum will intersect the liquid-liquid line even closer to the critical point, and might even converge on the second critical point itself. It should be stressed however, that this can only be confirmed via a full finite-size scaling analysis of the critical region, the computational requirements of which exceeded the available resources.
As regards the temperature behaviour of the compressibility, obtaining good statistics for this quantity is harder, because it is measured via the second moment of the density distribution. However, in contrast to the density, its maximum clearly vanishes well before the critical pressure is reached (fig. 20(b)). A likely explanation for this difference is to be found in the fact that the compressibility exhibits a critical point divergence. This presumably swamps the anomalous compressibility maximum well before the critical point is reached.
IV Summary, discussion and conclusions
In this paper we have investigated the phase behaviour and liquid state anomalies of two distinct CS models. Below, we summarize and discuss our results for each model in turn.
For the 2d shoulder potential, we obtained the liquid-gas coexistence curve and studied how it evolves into the LDTS sublimation line at the gas-liquid-LDTS triple point. In the solid region of the phase diagram we employed Lattice Switch MC techniques and Gibbs-Duhem integration to map the phase boundary between the LDTS and the HDSS from very low temperatures up to the melting point. Analytical calculations within the harmonic approximation suggested the existence of a reentrant triangular solid phase at very high pressures, the HDTS. The existence of this phase was confirmed using Lattice Switch MC. Evidence was also found for a metastable LDTS-HDTS and associated critical point lying at low temperatures and high pressures, well below LDTS melting temperature.
Considerable effort was devoted to probing the behaviour of the liquid state anomalies in the number density and compressibility in the liquid phase. Maxima in the density and compressibility were observed along two widely separated isobars. An inspection of configurations either side of the compressibility maximum indicated that its presence is associated with the freezing of the liquid to the LDTS. The double peaked nature of the density distribution function at the temperature of the compressibility maximum confirmed the existence of two distinct favored regions of density.
Measurements of the temperature dependence of the compressibility and density maxima for a wide range of system sizes revealed pronounced finite-size effects. For small to medium system sizes, these took the form of systematic changes in the peak heights and peak temperatures. Interestingly, however, the differences between the results for the largest systems were much less pronounced than for the smallest systems. Finite-size difference between the smallest and largest systems, of the magnitude observed, are strongly indicative of a large correlation length . The apparent convergence of the results for the compressibility peak suggests that this correlation length is large but finite at the transition. In such circumstances one would expect that in the regime , finite-size effects are great, while for system sizes , they begin to die away. In support of this, we remark that it is widely believed that the 2d freezing transition has a pseudo-continuous character, although the precise nature of the transition remains the subject of some debate [48, 52].
Our results for the density distribution suggest that the density maximum, (whilst clearly occurring at temperatures in excess of the freezing temperature), is associated with the first appearance of clusters of LDTS crystalline structure within the liquid phase [53]. This is evidenced by the subsidiary peak occurring at the LDTS density, (cf. fig. 8(b)) and by the liquid phase snapshots just above the melting temperature, fig. 7(b), at the point where the density starts to fall rapidly. Since these solidlike clusters possess a lower local density than that of the coexisting liquid, their presence reduces the average density. As the temperature is lowered towards the freezing transition, the size and persistence of the solid-like clusters increases, causing the average density to fall ever more rapidly, (cf. fig. 8(b)). The shift of the peak in the average density to lower temperatures with increasing is a natural consequence of the fact that for , the apparent freezing point will occur at higher temperatures than in the thermodynamic limit.
We have also addressed reports of a liquid-liquid critical point within cell theory for the 2d shoulder model. Our own cell model study (sec. II C), does reveal a second critical point, but at parameters far removed from those quoted in ref. [10]. We stress, however, that the appearance of a second critical point within cell theory is not a feature peculiar to CS potentials. Indeed in a recent reappraisal of cell theory for the Lennard-Jones fluid [39], we have shown that this model also exhibits a second critical point. Moreover, the second critical point occurring in both the Lennard-Jones and CS models appears to be an artifact of the lattice-based nature of cell theory, terminating as it does a phase boundary between a liquidlike and a solidlike phase. In view of this it seems unlikely that cell theory will ever represent a useful approach for investigating the liquid phase behaviour of CS systems.
Taken together, our results lead us to conclude that the thermodynamic anomalies of the 2d shoulder model are not caused by strong liquid-state fluctuations associated with the proximity of a liquid-liquid critical point (metastable or otherwise). Instead we attribute them to the strong pseudo-critical fluctuations associated with the 2d freezing transition and the fact that the density of the LDTS is lower than that of the liquid. Whilst we do not discount the possibility of a metastable liquid-liquid critical point somewhere within the LDTS phase, it is difficult to see how it could (in the interpretation of ref. [10]) give rise to a compressibility maximum of the scale we observe on two such widely separated isobars. We further remark that our interpretation of the origin of the anomalies is consistent with the recently reported failure to observe their presence in 3d versions of shoulder models [12, 54]. Here the freezing transition is expected to be sharply first order in character, with no large fluctuating clusters of the solid phase within the liquid. As such there will be little or no sign of the approach to freezing.
Turning now to our results for Jagla’s ramp potential in 3d, we find a liquid-gas coexistence curve at high temperature and low pressure, and confirm the existence of a stable transition between a high density liquid and a low density liquid at lower temperature and higher pressure. For both transitions we have mapped a portion of the coexistence curve and determined the critical parameters. Within the LDL phase, and below the temperature of the second critical point, we find maxima in the density and compressibility as a function of temperature. In contrast to the 2d shoulder model, these anomalies are authentic, i.e. they are not associated with the formation of an incipient phase. The locus of density maxima appears to converge on the second critical point.
Finally, with regard to the general issues raised by our findings, the presence of a stable second critical point in the ramp model begs the question as to what features of this potential are responsible for its existence, when none is observed in other single component fluids such as the Lennard-Jones fluid. Although we have not yet studied this matter in detail, it seems likely that the potential minimum must be located at a sufficiently large radius relative to the hard core, otherwise the LDL-HDL transition is preempted by the freezing transition. This mirrors the known requirements for the existence of a liquid-gas transition, which is stable with respect to the crystalline phases only for an attractive potential of sufficiently large range [55]. It would be of considerable interest to examine the precise role of the interaction range on the stability of the LDL-HDL critical point, as well as other factors such as the steepness of the soft core and the depth of the minimum. Such a study could benefit the general understanding of the relationship between waterlike anomalies in real systems and second critical points, whether metastable or otherwise [56]. We hope to report on this matter in future work.
Acknowledgements.
The authors thank A.D. Bruce for numerous helpful conversations and suggestions. NBW is grateful to G. Stell for introducing him to the topic of core-softened potentials. JEM acknowledges an EPSRC studentship.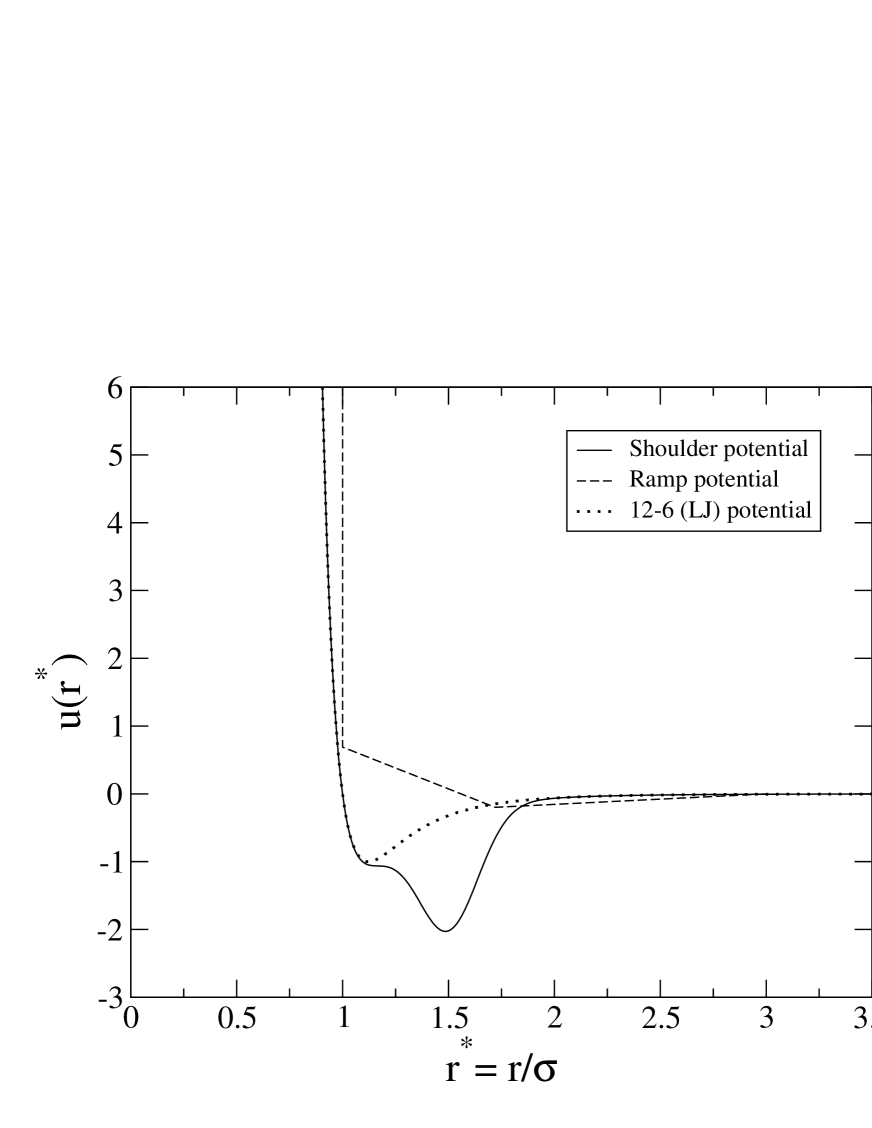


REFERENCES
- [1] P.T. Cummings and G. Stell, Mol. Phys. 43, 1267 (1981).
- [2] Y. Katayama, T. Mizutani, W. Utsumi, O. Shimomura, M. Yamakata, K. Funakoshi; Nature 403 170 (2000).
- [3] F.H. Stillinger and T. Head-Gordon, Phys. Rev. E47, 2484 (1993).
- [4] P.C. Hemmer and G. Stell. Phys. Rev. Lett. 24, 1284 (1970).
- [5] J.M. Kincaid, G. Stell, C.K. Hall; J. Chem. Phys. 65, 2161 (1976); J.M. Kincaid, G. Stell, E. Goldmark; J. Chem. Phys. 65, 2172 (1976); J.M. Kincaid, G. Stell; J. Chem. Phys. 67, 420 (1977).
- [6] P.G. Debenedetti, V.S. Raghavan and S.S. Borick, J. Phys. Chem. 95, 4540 (1991).
- [7] S.S. Borick and P.G. Debenedetti; J. Chem. Phys. 97, 6292 (1993).
- [8] E.A. Jagla, Phys. Rev. E58, 1478 (1998).
- [9] P. Bolhuis and D. Frenkel, J. Phys. Condens. Matter. 9, 381 (1997).
- [10] M.R. Sadr-Lahijany, A. Scala, S.V. Buldyrev, H.E. Stanley; Phys. Rev. Lett. 81, 4895 (1998).
- [11] A. Scala, M.R. Sadr-Lahijany, N. Giovambattista, S.V. Buldyrev, H.E. Stanley Phys. Rev. E63, 041202 (2001).
- [12] S.V. Buldyrev, G. Franzese, N. Giovambattista, G. Malescio, M.R. Sadr-Lahijany, A. Scala, A. Skibinsky, H.E. Stanley, Physica A304, 23, (2002).
- [13] F. Sciortino, P.H. Poole, U. Essmann and H.E. Stanley; Phys. Rev. E55, 727 (1997).
- [14] R.J. Speedy and C.A. Angell, J. Chem. Phys. 65, 851 (1976).
- [15] H.E. Stanley, C.A. Angell, U. Essmann, M. Hemmati, P.H. Poole and F. Sciortino; Physica A205, 122 (1994).
- [16] O. Mishima and H.E. Stanley; Nature 396, 329 (1998).
- [17] A. Scala, F.W. Starr , E. La Nave, H.E. Stanley, F. Sciortino Phys. Rev. E62, 8016 (2000).
- [18] V.V. Brazhkin, E.L. Gromnitskaya, O.V. Stalgorova and A.G. Lyapin. High Pressure. Res. 15, 267 (1997).
- [19] O. Mishima Phys. Rev. Lett. 85, 334 (2000).
- [20] A.K. Soper and M.A. Ricci, Phys. Rev. Lett. 84, 2881 (2000).
- [21] M. Togaya, Phys. Rev. Lett. 79, 2474 (1997).
- [22] D.J. Lacks, Phys. Rev. Lett. 84, 4629 (2000); See also the comments by E.A. Jagla, Phys. Rev. Lett. 86, 3206 (2001); D.J. Lacks, Phys. Rev. Lett. 86, 3207 (2001);
- [23] I. Saika-Voivod, F. Sciortino and P.H. Poole, Phys. Rev. Lett. E63, 011202 (2001).
- [24] C.J. Roberts, A.Z. Panagiotopoulos and P.G. Debenedetti; Phys. Rev. Lett. 77, 4386 (1996).
- [25] C. Vega and P.A. Monson, J. Chem. Phys. 109, 9938 (1998).
- [26] G. Malescio and G. Pellicane, Phys. Rev. E63, 020501(R) 2001.
- [27] E.A. Jagla, J. Chem. Phys. 111, 8980 (1999)
- [28] E.A. Jagla, Phys. Rev. E63, 061509 (2001).
- [29] N.B. Wilding, Phys. Rev. E52, 602 (1995).
- [30] A.Z. Panagiotopoulos; J. Phys. Condens. Matter 12, R25 (2000).
- [31] N.B. Wilding, Am. J. Phys. 69, 1147 (2001).
- [32] D. Frenkel and B. Smit, Understanding Molecular Simulation, Academic Press, Boston (1996).
- [33] B.A. Berg and T. Neuhaus; Phys. Rev. Lett. 68, 9 (1992).
- [34] A.M. Ferrenberg and R.H. Swendsen, Phys. Rev. Lett. 61, 2635 (1988); ibid 63, 1195 (1989); A.M. Ferrenberg and R.H. Swendsen, Computers in Physics, 3(5), 101 (1989).
- [35] C. Borgs, R. Kotecky, Phys. Rev. Lett 68, 1734 (1992).
- [36] A.D. Bruce and N.B. Wilding, 68, 193 (1992); N.B. Wilding and A.D. Bruce, J. Phys. Condens. Matt. 4, 3087 (1992).
- [37] Lennard-Jones, J.E., Devonshire, A.F., Proc. Roy. Soc. London A163, 53 (1937); ibid A165, 1 (1938).
- [38] Hill, T.L., Statistical Mechanics - Principles and Selected Applications, McGraw-Hill (1956).
- [39] J.E. Magee and N.B. Wilding; Mol. Phys. 100 1641 (2002).
- [40] Reference [37] assigns , although the exact value chosen for has no impact upon phase coexistence so long as it is independent of volume.
- [41] Press, W.H., Teukolsky, S.A., Vetterling, W.T., Flannery, B.P., Numerical Recipes in C, Cambridge University Press (1992).
- [42] The only precedent for neglecting ground state terms, of which we are aware, is D.A. Young, J. Chem. Phys. 58, 1647 (1973).
- [43] N.W. Ashcroft, N.D. Mermin, Solid State Physics, (Saunders) (1976).
- [44] P. Bladon, D. Frenkel, Phys. Rev. Lett. 74, 2519 (1995)
- [45] A.D. Bruce, N.B. Wilding, G.J. Ackland, Phys. Rev. Lett. 79, 3002 (1997).
- [46] A.D. Bruce, A.N. Jackson, G.J. Ackland, N.B. Wilding, Phys. Rev. E61, 906 (2000).
- [47] A.N. Jackson, A.D. Bruce, G.J. Ackland, Phys. Rev. E65, 036710 (2002).
- [48] H. Weber, D. Marx and K. Binder, Phys. Rev. E51, 14636 (1995); S. Sengupta, P. Nielaba, and K. Binder, Phys. Rev. E61, 6294 (2000); A. Jaster, Phys. Rev. E59, 2594 (1999).
- [49] D.A. Kofke, J. Chem. Phys. 98, 4149 (1993).
- [50] This aspect ratio change, which leaves the volume unaltered, is necessary since a triangular lattice is not commensurate with a square box.
- [51] This suggests that there exists a non-critical contribution to the density anomaly, which presumably modulates the critical anomalies.
- [52] F.L. Somer,Jr., G.S. Canright, T. Kaplan, Phys. Rev. E58, 5748 (1998).
- [53] We note that if the correlation length of the pseudo critical freezing transition is finite, then in the thermodynamic limit, the form of at the transition point must be Gaussian. The double peaked structure we observe therefore indicates that for the system sizes studied in this work, the limit has not been reached.
- [54] G. Franzese, G. Malescio, A. Skibinsky,, S.V. Buldyrev, H.E. Stanley; cond-mat/0111239;
- [55] See D. Frenkel in Soft and Fragile Matter, IOP publishing, M.E. Cates and M.R. Evans (eds). pp134-144, (2000).
- [56] Recent steps towards elucidating this matter have been reported by G. Franzese, G. Malescio, A. Skibinsky, S.V. Buldyrev, H.E. Stanley; Nature 409, 692 (2001).