[
Charge dynamics and “ferromagnetism” of A1-xLaxB6 (A=Ca and Sr)
Abstract
Ferromagnetism has been reported recently in La-doped alkaline-earth hexaborides, A1-xLaxB6 (A=Ca, Sr, and Ba). We have performed the reflectivity, Hall resistivity, and magnetization measurements of A1-xLaxB6. The results indicate that A1-xLaxB6 can be regarded as a simple doped semimetal, with no signature of an excitonic state as suggested by several theories. It is also found that the surface of as-grown samples ( 10 m in thickness) has a different electronic structure from a bulk one, and a fairly large number of paramagnetic moments are confined in this region. After eliminating these paramagnetic moments at the surface, we could not find any evidence of an intrinsic ferromagnetic moment in our samples, implying the possibility that the ferromagnetism of A1-xLaxB6 reported so far is neither intrinsic.
pacs:
PACS numbers : 78.30.-j, 72.20.My, 75.50.Cc]
I Introduction
Recently, ferromagnetism with high ( K) has been reported in alkaline-earth hexaborides doped with La, A1-xLaxB6 (A=Ca, Sr, and Ba). [1] According to the study, the magnitude of ferromagnetic moment varies with La concentration, , and is maximum at , though very tiny (/unit cell). Since this series of compounds have no magnetic elements, the appearance of ferromagnetism is quite surprising and has stimulated a number of studies on the mechanism of ferromagnetism. The parent compound, alkaline-earth hexaboride, AB6, contains the CsCl arrangement of divalent alkaline-earth ions and B6 clusters, and early theoretical work on the cluster calculation of B6 indicates that a B6 cluster with a transfer of two electrons (from the divalent alkaline-earth ion) takes a closed-shell electronic structure. [2] More detailed band calculations [3, 4, 5] indicate that there is a band overlap at the X points of the Brillouin zone between the valence band formed by the B 2 state and the conduction band strongly hybridized with the alkaline-earth , and thus AB6 is a semimetal. Many theoretical models [6, 7, 8] for the ferromagnetism put their basis on an “excitonic” state of AB6, where the electrons and the holes in a semimetal form triplet excitons as binding states. Extra electrons introduced by La substitution into such a state favors parallel spin configuration to gain paring energy of excitons, and yields a ferromagnetic state as a result.
One of the important aspects of these theories is that the magnetic properties of A1-xLaxB6 are dominated by carrier doping. Such a doping-dependent ferromagnetism is analogous to the ferromagnetism of perovskite manganites, and experimental studies of charge dynamics are indispensable to clarify such ferromagnetism caused by carrier doping. However, there has been little systematic investigation of the electronic structure of A1-xLaxB6 as a function of La concentration. It should be stressed here that to know how electronic states evolve with La doping is the first step to experimentally understand possible relationship between ferromagnetism and charge dynamics in A1-xLaxB6.
Another important issue from the experimental viewpoint is how to characterize samples properly. Recent studies on A1-xLaxB6 suggests strong sample dependence as well as spatial inhomogeneity of ferromagnetism.[9, 10, 11, 12] Here, we have to be careful about the fact that the magnitude of the ferromagnetic moment is so tiny and can be easily affected by a small amount of impurities. It is very important, therefore, to characterize samples properly in terms of carrier concentration, possible spatial inhomogeneity, and impurity.
In the present study, we carried out optical reflectivity measurement as well as Hall measurement of A1-xLaxB6 with systematically changing . These measurements are very powerful technique to obtain basic parameters for charge dynamics, for example, the effective mass and the concentration of carriers. Furthermore, the inhomogeneity of the sample can easily be checked by utilizing microscopy technique of reflectivity measurement. The aim of the present study is to investigate the evolution of electronic structures as well as the variation of magnetic properties with La doping, and to clarify whether the charge dynamics is really related to the “ferromagnetism” of A1-xLaxB6.
II Experiment
Single crystals of A1-xLaxB6 (A=Ca and Sr, ) were grown by an Al flux method. CaCO3 (4N), SrCO3(4N), LaB6 (3N), boron (5N), and Al (4N) were used as starting materials and flux. CaB6 or SrB6 was made by borothermal reduction, and was put into an alumina crucible together with LaB6 and Al. The materials were heated up to 1500 ∘C and slowly cooled down under Ar atmosphere. [13] Plate-like samples with (100) surface with a typical dimension of 1 mm 1 mm 0.1 mm were obtained. The detail of the sample characterization is discussed in Sec. V. Hall measurement was performed by applying magnetic field between -5 and 5 T. The electrode was attached by directly melting and bonding Au wire onto the sample surface. Reflectivity was measured between 0.07 and 0.6 eV using a Fourier-transform infrared spectrometer equipped with a microscope. We checked the dependence of the spectra on surface treatment, and the result is discussed in details in Sec. IV. Magnetization was measured by a superconducting quantum interference device (SQUID) magnetometer. Since the volume of each single crystal was too small, more than 10 pieces were combined for the magnetization measurement. In each measurement, a background signal was measured separately and subtracted from a total signal.
III Hall measurement
Hall resistivity vs. magnetic field for Sr1-xLaxB6 at room temperature is shown in Fig. 1.
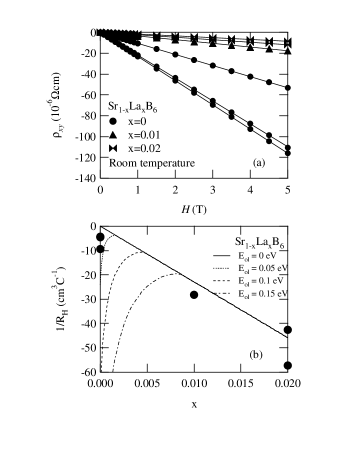
In usual ferromagnetic metals, nonlinear behaviors of are often observed (the so-called anomalous Hall effect), particularly around . This effect comes from the anomalous term of Hall resistivity proportional to magnetization, . [14] However, of Sr1-xLaxB6 shows a linear dependence with no sign of the anomalous Hall effect for any composition, as shown in Fig. 1(a).
When the anomalous term does not exist, Hall resistivity is given only by an ordinary term proportional to magnetic field, . Figure 1(b) plots the inverse Hall coefficient as a function of . The negative values of mean that the majority carriers are electrons. The solid line gives the relation . The agreement between the experimental results and the simple relation indicates that La doping introduces the same number of electrons into the conduction band. If the effect of band overlap in a semimetal is taken into account, the relation between Hall coefficient and becomes more complicated. This issue will be discussed in the next section.
IV Reflectivity measurement
Hall coefficients are dominated only by the number of carriers but do not reflect their effective mass . On the other hand, a reflectivity spectrum can reveal the value of through its plasma frequency, , where is the dielectric constant at higher than the plasma frequency.
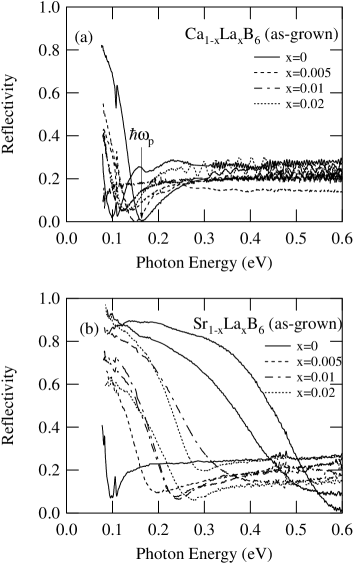
Figure 2 shows the reflectivity spectra of Ca1-xLaxB6 and Sr1-xLaxB6 on as-grown surface as well as on slightly polished surface (by m in depth). As can be seen, almost all the spectra have a clear plasma edge, as typically shown by an arrow, but the values of with the same composition are fairly scattered. In fact, it is found that even pieces from the same crucible show different values. As a result, a systematic variation of with , which is expected from the Hall-coefficient measurement, is barely observed. As an overall feature, the Sr series have larger values of than the Ca series, similarly with the previous reports. [11, 15]
It should be noted here that reflectivity measurements detect only the sample surface with the penetration depth of light (the order of m). Thus, if the sample surface with several m in thickness has a different characteristic from the bulk one, the optical result can be inconsistent with the Hall measurement.
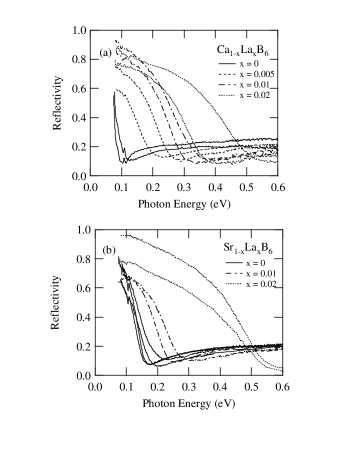
To check for this possibility, we have filed the sample surface by m in depth, then polished it, and measured its reflectivity again. The reflectivity spectra after such surface treatment are shown in Fig. 3. The scattering of the values with the same composition is drastically suppressed, and it is clearly observed that shifts to higher energy with increasing . We have also checked that there is almost no position dependence of the spectra along the sample surface.
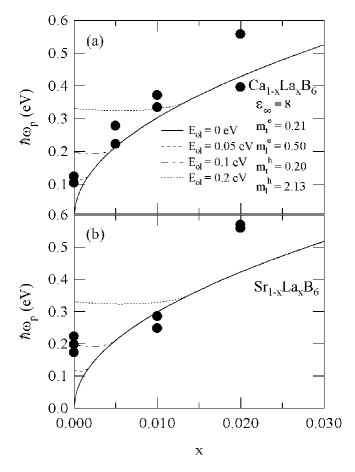
To compare the experimental results with theoretical models, the value has been calculated based on the parameters from a band calculation. [5] First, holes in the valence band are ignored and only electrons in the conduction band are taken into account. The band structure of AB6 has electron pockets at the triply degenerate X point [(100), (010), (001)], and the effective mass of the pocket is anisotropic between the longitudinal direction (parallel to the X direction) and the transverse direction (perpendicular to the X direction). According to a band calculation, [5] the longitudinal mass () is ( is the free electron mass) and the transverse mass () is . In this case, the plasma frequency is given by the following equation,
| (1) |
where is the number of electrons. is estimated to be 8 from a band calculation, which is consistent with the reflectivity value far above in the experiment (). The dependence of calculated from Eq. 1 assuming (solid lines) as well as the experimental values of (closed circles) are plotted in Fig. 4. The agreement between the experiment and the calculation is quite satisfactory (except for =0 as discussed later), indicating that the effective mass of the conduction band by the band calculation describes the charge dynamics of these compounds correctly.
One may notice an evident discrepancy at between the experiment (finite values of ) and the calculation (.) To calculate the value at , holes on the valence band, which exist even for in a semimetallic state, have to be taken into account. For the calculation, the effective mass of the valence band by the band calculation was used [the longitudinal mass () is and the transverse mass () ], but the band overlap () was taken as a free parameter. In this case, the plasma frequency is given by the sum of the contribution from electrons and holes as follows;
| (2) |
where is the number of holes, and . The result of the calculation is shown in Fig. 4 for eV (the dotted line) , 0.1 eV (the dashed line), and 0.2 eV (the dot-dashed line). From the comparison between the experiment and the calculation, the band overlap is estimated to be eV for CaB6, and eV for SrB6.
A similar calculation taking account of both electrons and holes can be made for Hall coefficients. In this case, the total Hall coefficient is given by the subtraction of the hole contribution from the electron contribution. The result is shown in Fig. 1 (b), and from the comparison in Hall coefficients, is estimated to be eV for SrB6. The discrepancy of the values from reflectivity and Hall coefficients can be attributed to the deviation of the band structure from simple parabolic ones.
V Magnetization measurement
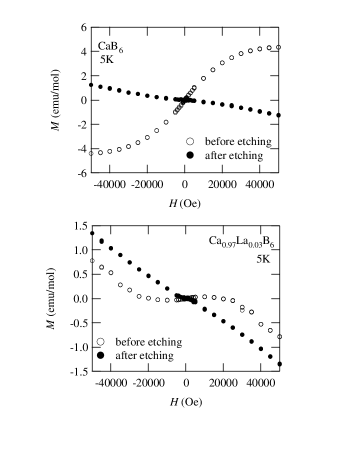
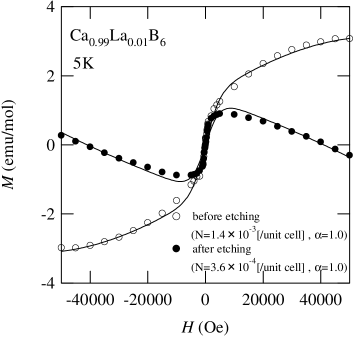
Since it has been clarified that the sample surface with 10 m in thickness has a different electronic structure from the bulk one, the next question is how the magnetic properties of this part is different from the bulk magnetic properties. To answer this question, we first measured the magnetization of A1-xLaxB6, then etched the surface of the sample by HNO3, and measured its magnetization again. Figure 5 shows the magnetization of Ca1-xLaxB6 as a function of magnetic field before and after etching the sample. A drastic change of the magnetization before and after etching is clearly observed. Roughly speaking, a positive component (a ferromagnetic or a paramagnetic component) decreases and a diamagnetic component survives with etching the sample surface. As most clearly seen in Fig. 6, the positive component is likely composed of both a ferromagnetic, which saturates far below 10000 Oe, and a paramagnetic component, which gradually saturates up to 50000 Oe. To know which component changes most with etching, the magnetization curve has been fitted by the sum of three components, a paramagnetic, a ferromagnetic, and a diamagnetic component as follows:
| (3) | |||||
| (4) |
where is the number of paramagnetic moments, the g-factor of spin, the Bohr magneton, the Brillouin function, the amount of ferromagnetic moments, the magnetization curve for a ferromagnet, and the diamagnetic susceptibility of core electrons. was fixed to the value calculated from the diamagnetic susceptibility of Ca and six B ( cm3/mol). Figure 6 shows one of the fitting results. Here, for is adopted, which fits the data best. From this fitting, it is found that parameter , representing the amount of ferromagnetic moments, does not change by etching, but , the number of paramagnetic moments, decreases to 40 %. Similar results were obtained for other samples. Therefore, it can be concluded that the ferromagnetic moments are distributed over the sample uniformly, whereas the paramagnetic moments are localized at the sample surface.
This result implies the importance of removing sample surface when one correctly estimates the bulk ferromagnetic moment of A1-xLaxB6. Therefore, we carefully removed the sample surface by HNO3 etching, and measured the magnetization curve of A1-xLaxB6 with various values of and estimated the ferromagnetic moment. The size of the ferromagnetic moment as a function of in the present experiment is shown by closed circles in Fig. 7, where the data from Ref. [1] are also plotted by closed squares. As can be seen, the ferromagnetic moment in the present experiment is substantially smaller than that of Ref. [1], except for one sample (), the same one shown in Fig. 6. These results suggest that the ferromagnetic moment is not intrinsic but is caused by some impurities in the sample.

To investigate what kind of and how much impurities exist in the sample, we took the following way. First, the magnetic impurities were searched qualitatively by X-ray fluorescence spectrometry. It was found from this technique that Fe is the main magnetic impurity in the sample. Then, we quantitatively determined the amount of Fe impurity by inductively coupled plasma atomic emission spectrometry (ICP-AES). Figure 8 shows the amount of Fe impurity (closed triangles), as well as the experimentally observed ferromagnetic moment of the same samples (closed circles). As can be seen, there is a rough correspondence between the amount of Fe impurity and the ferromagnetic moment. The x=0.01 sample with the largest ferromagnetic moment (as shown in Fig. 7) turned out to be the one containing the largest amount of Fe impurity ( ppm, more than one order of magnitude larger than other samples). Furthermore, if we assume 1 moment per Fe, 7.3 emu/mol is expected in total, which exceeds the experimentally observed ferromagnetic moment, 1.4 emu/mol. On the other hand, other samples showing much smaller sizes of ferromagnetic moment (less than 0.1 emu/mol) have much smaller amounts of Fe impurity (less than 50 ppm), but they are also enough to produce the observed ferromagnetic moment. Therefore, we conclude that the ferromagnetic moment observed in the present experiment is caused by Fe impurity. [16]

VI Discussion
One of the conclusions from the reflectivity measurement is that A1-xLaxB6 can be regarded as simple doped semimetals, and no signature of an “excitonic state” has been observed in our reflectivity spectra for any . Though we cannot completely exclude the possibility that such a feature exists out of our experimental range ( eV), further evidence against the excitonic state in the doped samples can be derived in the following way: The calculated lines for the finite values of in Fig. 4 merge into the solid line (for ) at large , where the Fermi level is located higher than the top of the valence band and the holes in the valence band are filled up. As can be seen in Fig. 4, the values in the experiment for is in such a region, indicating that 0.5 % La doping is enough to fill up the holes on the valence band. This indicates that the excitonic state, even if it exits for , has already disappeared for .
Recent band calculation by the so-called GW approximation indicates that stoichiometric CaB6 is not a semimetal but a narrow-gap band insulator,[17] and an angle-resolved photoemission experiment indicates the existence of a band gap and the Fermi level located at the conduction band, resulting in only electron pockets. [18] These results are inconsistent with the interpretation of our experimental results based on a semimetal model. For this issue, we cannot exclude the possibility that the plasma edge for comes from the doped electrons into a conduction band of a band insulator. In other words, it is possible that the size of the band overlap is zero (solid lines in Fig. 4), but the axis in Fig. 4 is shifted by for Ca series and by for Sr series because of offstoichiometry (most probably B defect). However, it should be pointed out that we measured a number of pieces of the same composition, and found that is eV for all CaB6 samples and eV for all SrB6 samples. This can be easily explained by a semimetal model, as discussed in Sec. IV. By the doped insulator model, on the other hand, we have to assume that the amount of defects barely depend on samples, which seems fairly unlikely.
It is also found from the reflectivity measurement that the sample surface with 10 m in thickness has a different electronic structure from the bulk one. This phenomenon seems generic for single crystals of these compounds grown in Al flux, judging from the results of previous optical studies by other groups. [11, 15] Since the phonon peak in the optical spectra around 0.11 eV, which is assigned to an internal mode of the B6 cluster, [19] is the same in energy before and after surface treatment, the surface state should be close to the bulk A1-xLaxB6 in terms of crystal structure. Possible origins of the surface state are such as a slightly oxidized phase or an offstoiciometric phase precipitated at low temperatures during single-crystal growth. Whichever is the case, such an effect changes the Fermi level, or even changes the band structure, and thus, varies the plasma frequency.
Let us move on to the magnetism of A1-xLaxB6. As discussed in Sec. V, both a ferromagnetic and a paramagnetic component coexist in the magnetization. The existence of a paramagnetic component in addition to a ferromagnetic component has not been explicitly discussed so far, but has already been observed in various experiments, for example, high-field magnetizations in Ref. [20]. It is found from the present experiment that the paramagnetic moments are confined to the sample surface. What is the origin of these paramagnetic moments at the surface? The amount of Fe impurity at the surface is estimated from ICP-AES, but the value is not large enough to explain the experimentally obtained size of the paramagnetic moment. It is reasonable to think that the electronic structure of the surface, which is different from the bulk one as shown in the reflectivity spectrum, is related to the appearance of the paramagnetic moment. One possibility is that the defect of Ca or B at the sample surface @yields a local magnetic moment, as suggested by a recent calculation.[21] However, further studies are necessary to understand the origin of the paramagnetic moment at the sample surface.
Regarding the ferromagnetism of A1-xLaxB6, the conclusion of the present experiment is that there is no intrinsic bulk ferromagnetic moment in our samples, but there is ferromagnetic moments caused by Fe impurity. It should be stressed here again that our sample is well characterized in terms of carrier concentration, and it is unlikely that we missed the concentration range for an intrinsic ferromagnetic phase, if there is such a phase. Therefore, our best statement on this issue is that the ferromagnetism of A1-xLaxB6 is not dominated by carrier doping. A plausible explanation is that any “ferromagnetism” of A1-xLaxB6 reported so far is caused by Fe impurity, as is the case for our samples.
VII Summary
We have investigated the charge dynamics of A1-xLaxB6 by reflectivity and Hall measurement. It is found that La doping introduces the same number of electrons into a semimetallic state, and its effective mass is consistent with a band calculation. No evidence of an excitonic state is observed, but the system should be regarded as a simple doped semimental. It is also found that the as-grown sample surface with 10 m in thickness has a different electronic structure from a bulk one. From magnetization measurements, it is found that this surface part contains a large number of paramagnetic moments. We have carefully measured the ferromagnetic moment of A1-xLaxB6 after removing the surface part by etching process, and have found that the ferromagnetic moments in our samples are substantially smaller than those observed so far. This result, together with a good correspondence between the size of the ferromagnetic moment and the amount of Fe impurity in the sample, indicates that the “ferromagnetism” of A1-xLaxB6 is not intrinsic, but most probably caused by Fe impurity.
VIII Acknowledgment
We thank M. Nohara, Z. Hiroi, and S. Horii for their help with sample growth at the early stage of this study, and Z. Fisk, S. Fujiyama and M. Takigawa for helpful discussions. The present work was partly supported by a Grant-In-Aid for Scientific Research from Ministry of Education, Culture, Sports, Science and Technology, Japan.
REFERENCES
- [1] D. P. Young, D. Hall, E. Torelli, Z. Fisk, J. L. Sarrao, J. D. Thompson, H. R. Ott, S. B. Oseroff, R. G. Goodrich, and R. Zysler, Nature (London) 397, 412 (1999).
- [2] H. C. L. Higgins and M. de V. Roberts, Proc. Royal Soc. A 224, 336 (1954).
- [3] A. Hasegawa and A. Yanase, J. Phys. C 12, 5431 (1979).
- [4] S. Massidda, A. Continenza, T. M. de Pascale, and R. Monnier, Z. Phys. B 102, 83 (1997).
- [5] C. O. Rodriguez, R. Weht, and W. E. Pickett, Phys. Rev. Lett. 84, 3903 (2000).
- [6] M. E. Zhitomirsky, T. M. Rice, and V. I. Anisimov, Nature 402, 251 (1999).
- [7] L. Balents and C. M. Varma, Phys. Rev. Lett. 84, 1264 (2000).
- [8] V. Barzykin and L. P. Gor’kov, Phys. Rev. Lett. 84, 2207 (2000).
- [9] S. Kunii, J. Phys. Soc. Jpn. 68, 3189 (1999).
- [10] T. Terashima, C. Terakura, Y. Umeda, N. Kimura, H. Aoki, and ,S. Kunii, J. Phys. Soc. Jpn. 69, 2423 (2000).
- [11] P. Vonlanthen, E. Felder, L. Degiorgi, H. R. Ott, D. P. Young, A. D. Bianchi, and Z. Fisk, Phys. Rev. B 62, 10076 (2000).
- [12] R. R. Urbano, C. Rettori, G. E. Barberis, M. Torelli, A. Bianchi, Z. Fisk, P. G. Pagliuso, A. Malinowski, M. F. Hundley, J. L. Sarrao, and S. B. Oseroff, Phys. Rev. B 65, 180407(R) (2002).
- [13] Another possible way of growing single crystals is to synthesize Ca1-xLaxB6 powder by borothermal reduction and to put it in Al flux. We believe that the difference should not affect the physical properties of the sample, as long as the carrier concentration is characterized correctly.
- [14] For example, J. J. Rhyne, Phys. Rev. 172, 523 (1968), and references therein.
- [15] H. R. Ott, M. Chernikov, E. Felder, L. Degiorgi, E. G. Moshopoulou, J. L. Sarro, and Z. Fisk, Z. Phys. B 102, 337 (1997)
- [16] To investigate where these Fe impurities come from, we also determined the amounts of Fe impurity of the starting materials by ICP-AES. The amounts of Fe impurity are 6 ppm for CaCO3, 2 ppm for B, 1040 ppm for LaB6, and 2 ppm for Al. On the basis of these values, we can explain Fe impurity less than 50 ppm in the single crystals by assuming that the Fe impurity of starting materials was slightly condensed to the crystals in the process of flux growth. However, for the one with the largest ferromagnetic moment (1emu/mol), which has 1000 ppm Fe impurity, we guess that it is owing to an accidental contamination during synthesis.
- [17] H. J. Tromp, P. van Gelderen, P. J. Kelly, G. Brocks, and P. A. Bobbert, Phys. Rev. Lett. 87, 016401 (2001).
- [18] J. D. Denlinger, J. A. Clack, J. W. Allen, G.-H. Gweon, D. M. Poirier, C. G. Olson, J. L. Sarrao, A. D. Bianchi, and Z. Fisk, cond-mat/0107429.
- [19] L. Degiorgi, E. Felder, H. R. Ott, J. L. Sarrao, and Z. Fisk, Phys. Rev. Lett. 79, 5134 (1997).
- [20] D. Hall, D. P. Young, Z. Fisk, T. P. Murphy, E. C. Palm, A. Teklu, and R. G. Goodrich, Phys. Rev. B 64, 233105 (2001).
- [21] R. Monnier and B. Delley, Phys. Rev. Lett. 87, 157204 (2001).