[
Optical evidence for mass enhancement of quasiparticles in pyrochlore Cd2Re2O7
Abstract
We report on the results of optical studies of the newly discovered superconductor Cd2Re2O7 in the normal state. We show that the compound has an exotic metallic state at low temperature. The optical conductivity spectrum exhibits two distinct features: a sharp renormalized resonance mode at zero frequency and a broad mid-infrared excitation band. Detailed analysis reveals a moderate enhancement of the effective mass at low temperature and low frequency.
pacs:
PACS numbers: 71.27.+a, 74.25.Gz, 74.70.Tx]
The magnetically frustrated pyrochlore oxides, which have a general formula A2B2O7 where B stands for a transition metal, have attracted considerable interest recently. The B cations are six-fold coordinated and located within distorted octahedra. Those octahedra are corner-sharing and form a three-dimensional network.[1] Many of the compounds undergo a metal to non-metal transition without an associated structural change. Cd2Re2O7 is one of a few exceptions, which displays solely metallic behavior below room temperature. This compound undergoes a second-order phase transition at around 200 K and enters a better metallic state in low temperature.[2] Very recently it was found that Cd2Re2O7 becomes superconducting below 2 K. This makes this compound the first superconductor in the pyrochlore family.[3, 4, 5] It is of great interest to investigate the peculiar electronic state lying behind the superconductivity. For this purpose we have investigated the optical properties of the compound at different temperatures in the normal state. An exotic metallic phase with strongly correlated electrons was revealed in the study.
The single crystals of Cd2Re2O7 were grown using a vapor-transport method described in detail in ref [6]. They were well characterized by x-ray diffraction, electron diffraction, resistivity, specific heat and magnetic susceptibility measurements, showing superconductivity below T 1.5 K.[2, 5, 6] The crystal structure is face-centered cubic. Near normal incidence reflectivity spectra, R(), were measured from 30 to 40000 cm-1 on a natural growth surface normal to the a-axis. Standard Kramers-Kronig transformations were employed to derive the frequency-dependent conductivity and dielectric function.
Cd2Re2O7 exhibits an unusual temperature-dependent dc resistivity in the normal-state: it is almost T-independent at high temperature but decreases rapidly below 200 K. The behavior, displayed in the inset of Fig. 1, is inconsistent with the traditional electron-phonon scattering mechanism, which should yield a linear T-dependent behavior at high temperature. Below 50 K, the dc resistivity follows an approximately quadratic T-dependence, implying electron-electron scattering and a Fermi-liquid-like state at low temperature. The reflectivity data at 300 K, 150 K and 24 K are shown in Fig. 1. We note immediately that the reflectivity in the far-infrared spectral range increases with decreasing temperature, characteristic of metallic response. However, the reflectivity in the mid-infrared range decreases with decreasing temperature. This suggests a redistribution of spectral weight with decreasing temperature, which should be seen more clearly in the frequency-dependent conductivity spectra. The reflectivity at high frequency is -independent. A plasma edge minimum is seen at frequency close to 15000 cm-1.
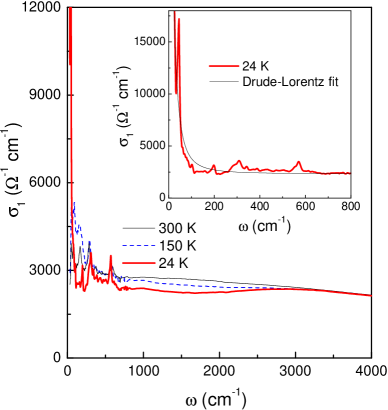
The real part of the conductivity, , is shown in Fig. 2. We use the Hagen-Rubens relation for the low frequency extrapolation in the Kramers-Kronig analysis. The conductivity spectrum at room temperature exhibits a number of phonon modes (170 cm-1, 280 cm-1, 372 cm-1, 570 cm-1) together with broad electronic excitations.[7] As temperature decreases, is significantly enhanced in the far-infrared range through spectral weight shifted from mid-infrared electronic excitations below 3300 cm-1. From the spectrum at 24 K, one can identify two distinct features: a narrow Drude-like resonance at =0 and very broad mid-infrared excitations. We emphasize here that the Drude-like peak is not a consequence of the low-frequency extrapolation since it is found that different extrapolations almost do not affect the spectra in the measured frequency range. The conductivity spectra differ markedly from the optical response for a simple metal. The observation highlights the many-body nature in the coherent metallic state of Cd2Re2O7 at low temperature. We noticed that the conductivity spectra resemble those of heavy-Fermion (HF) systems where similar and even narrower resonances are found in the low frequency conductivity in nearly all HF metals. In addition to the effect induced by the electron-electron correlation, the electron-phonon interaction seems to be strong at low temperature as well. Except for the phonon mode at 570 cm-1, almost all other phonon modes shift to higher frequencies (hardening) in low temperature metallic state. A new phonon mode appears at 340 cm-1 at 150 K and 24 K. This is consistent with the electron diffraction measurement which indicated a structural modulation associated with the phase transition at 200 K.[2]
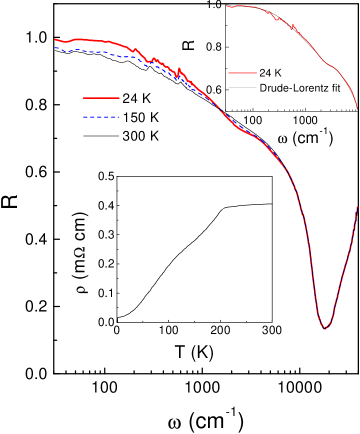
To isolate the different components of the electronic excitations, we fit simultaneously R() and at 24 K to a sum of a Drude term and Lorentz oscillators. This will reduce the uncertainty caused by the extrapolation in Kramers-Kronig analysis. The general formula for the complex dielectric function is[8]
| (1) |
where is the dielectric constant at high frequency, and in the Drude term are the plasma frequency and the relaxation rate of the free charge carriers, while , , and are the resonance frequency, the damping, and the mode strength of the Lorentz oscillators, respectively. As shown in the inset of fig. 1 and fig.2, both the R() and can be well fit to a Drude part and two Lorentz oscillators over a broad frequency range.[9] The Drude component has a plasma frequency of =6800 cm-1 and width 21 cm-1. The Lorentz parameters are =35350 cm-1, =9000 cm-1, =400 cm-1, and =5500 cm-1, =1910 cm-1, =3270 cm-1. We can see that the Drude part, though dominating the static conductivity, has only a fraction of the total spectral weight below the frequency of reflectivity minimum.
From the fitting parameters of the Drude component, the estimated conductivity at static limit, in terms of the simple Drude model, is around 38500 . This is in agreement with the reported dc resistitivity data.[3] The dc experimental data at 24 K in our measurement (see the inset of fig. 1) is about 34000 , which is a bit smaller than the zero-frequency extrapolation of the optical data. However, such discrepancy is within the systematic errors of experiments. Since the reflectance at far-infrared region is close to unit, the uncertainty of the reflectance even within 0.5 could give substantial difference of conductivity in static limit. In addition, the uncertainty of the geometric factors also adds some errors to the dc resistivity data .
An alternative way of making quantitative comparisons between the low-frequency resonance mode and overall spectral weight below the interband transition is to sum the spectral weight under the conductivity spectrum. The unscreened optical plasma frequency can be estimated by summing the spectral weight below the frequency of interband transition, , where is a cutoff frequency. By integrating the conductivity to 15000 cm-1 where the conductivity spectrum shows a well-defined minimum, we get =3 104 cm-1. This value is approximately the same for calculations at the three different temperatures. This plasma mode is clearly seen in the optical reflectivity as the high frequency plasma edge and in the real part of dielectric function as a zero-crossing at high frequency. Similarly, by applying sum-rule arguments, we can calculate the spectral weight below the narrow Drude-like mode and obtain another plasma frequency as = 4 = 8, where m∗ is the effective mass at low frequency and is another cutoff frequency only for the narrow Drude-like mode. The value of we obtained is 6720 cm-1. This value is close to the one we obtained from the above Drude-Lorentz fit, but is significantly smaller than the unscreened plasma frequency.
The occurrence of a sharp and narrow resonance mode at =0 together with very broad mid-infrared excitations in the optical conductivity of strongly correlated systems was widely explained in terms of the renormalized quasi-particles in the many-body picture.[10, 11, 12] It was suggested that the finite energy modes, basically containing all the spectral weight at high temperature, are associated with the unrenormalized band mass mB. As the temperature is lowered, correlation effects dressing the free charge carriers are manifested through the redistribution of the spectral weight between the higher and lower frequency. The sharp and narrow Drude-like component appears as a consequence of the enhancement of both the effective mass and the scattering time. With the assumption that the total charge-carrier density does not change with temperature, it is possible to directly estimate the enhancement of the effective mass by m∗/ = /, which gives value of 20. Indeed, specific heat measurements on Cd2Re2O7 indicated an enhanced electronic specific heat coefficient, 30 mJ/mol-K2.[5, 3] The behavior of the upper critical field Hc2 vs T also indicates that the Cooper pairs are composed of rather heavy quasiparticles. Qualitatively, the optical measurement is in agreement with the enhancement picture of effective mass.
It should be noted that the enhancement factor m∗/ refers to the enhanced effective mass in relation to the band mass, which could be significantly larger than the free-electron mass .[12, 14] According to the available band structure calculation of this material,[15] the Fermi surfaces consist of nearly spherical electron pockets centered at point and very heavy hole section at the zone boundary. The calculated density of states near EF is derived mainly from the heavy hole bands, which produces the bare band specific heat coefficient as large as =12.4 mJ/mol K2. Comparing with the measured value of 30 mJ/mol K2, we obtain a mass enhancement due to many-body effect m∗/=2.4. However, this value is much smaller than the value of 20 obtained from optical conductivity analysis which is solely due to the electron correlation effects. One possible explanation for the contradiction is that the mass enhancements in specific heat and transport are associated with different bands in the electronic structure. The mass enhancement in specific heat mainly comes from the heavy hole sheets with small correlation effect, on the other hand, the transport is dominated by the light electron band with strong renormalization effect by electron correlations. The later argument is also supported by Hall effect measurement.[5]
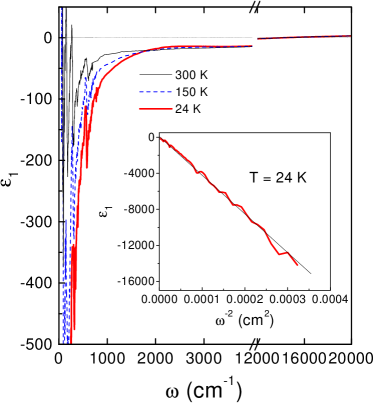
Fig. 3 shows the real part of the dielectric function, , as a function of frequency. The zero-crossing frequency at around 15000 cm-1, corresponding to the plasma edge in the reflectance spectrum, represents the screened overall plasma frequency. The contribution of the broad mid-infrared bands to the real part of the dielectric function, , varies very slowly with over a large frequency range below the frequency of zero-crossing. The low-frequency at high temperature can become even positive because of the contributions from phonon modes and some localized effect of quasiparticles.
Let us analyze the low-T spectrum of in the low frequency range due to the contribution from the renormalized Drude-like component. Because the contribution of the broad mid-infrared bands to varies slowly in , in the case of the real part of dielectric function, in terms of equation (1), can be approximated as , where represents a background dielectric constant at a high frequency determined by and contributions from broad mid-infrared excitations. Then, the slope in a vs plot will provide the value of the for the renormalized Drude-like component. The inset of Fig.3 shows the vs plot. The solid and dash lines are the experimental and the linear fit to the data. The value of extracted is 6620 cm-1, which is in good agreement with those determined in the above analysis.
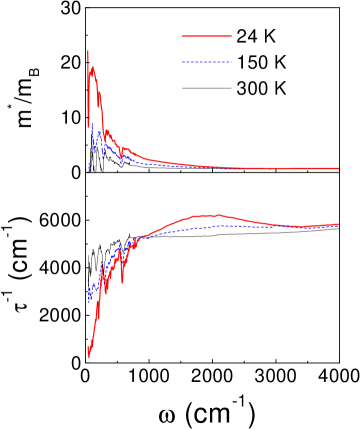
The frequency-dependence of the scattering rate as well as of the effective mass can be alternatively determined by using the generalized Drude model by
| (2) |
| (3) |
where is the unscreened overall plasma frequency. This analysis is also quite often used to quantify the renormalization effect of electronic correlation in HF materials.[12, 13, 16] The derived spectra of the effective mass and of the scattering rate with =3 104 cm-1 are plotted in Fig.4. At room T, the spectra of 1/ depends weakly on . As T lowered, the 1/ is suppressed at low-. In accord with this, the effective mass is enhanced. We observed m∗/mB 20 for T=24 K, which is well in agreement with the value obtained above.
Our study revealed unambiguously the renormalization effect by strong electron correlation in Cd2Re2O7, which makes the optical response quite similar to other HF materials. The major difference is that here the effective mass is relatively smaller than typical HF metals with 4f and 5f electrons. This is understandable considering the fact that the heavy electrons in correlated system originate, in general, from the interaction of the localized f or d electrons with the bands of delocalized electrons. This leads to the strong mixing, or hybridization, of the Fermi electrons with the localized f or d electrons. The final result is a renormalization of the Fermi surface and a drastic enhancement of the effective mass of free band electrons at EF. Cd2Re2O7 is a transition-metal system with 5d electrons. The 5d wave function is much more spatially extended than 4f or 5f electrons, which naturally results in a relatively smaller m∗/mB. We speculate that, similar to other heavy Fermion superconducting materials, the superconductivity observed in this material is due to the condensate of those relatively heavy electrons.
Finally we remark that Cd2Re2O7 is not the unique oxide material exhibiting an enhancement of the effective mass at low temperature. The metallic mixed-valent compound LiVO4, which also has the pyrochlore lattice of transition metal V, is another example showing unusual and strong HF behavior at low T. It should be noted that, in such oxide materials, both the localized electrons and delocalized band electrons should originate from the d electrons of the transition metals. At present, the physical origin of the heavy quasiparticle excitations is far from clear. It is suggested that it differs considerably from that of other known HF systems.[17, 18]
In conclusion, our optical study reveals that the low-T metallic state of Cd2Re2O7 is quite different from a simple metal. The spectra consist of two distinct charge excitations: a sharp renormalized resonance mode at zero frequency and broad mid-infrared excitation. The analysis reveals a moderate enhancement of the effective mass at low temperature and frequency. We compare the optical effective mass enhancement with that from thermodynamical data. Our analysis suggests that different bands in the electronic structure are associated with the enhancements of specific heat and transport.
Wang was in part supported by National Science Foundation of China (No.10025418). The work at McMaster University was supported by the Natural Sciences and Engineering Research Council of Canada. Oak Ridge National laboratory is managed by UT-Battelle, LLC, for the U.S. Department of Energy under contract DE–Ac05-00OR22725.
REFERENCES
- [1] M.A. Subramanian, G. Aravamudan and G.V. Subba Rao, Prog. Solid State Chem. 15, 55 (1983).
- [2] R. Jin, J. He, J. R. Thompson, M. F. Chisholm, B. C. Sales, and D. Mandrus, cond-mat/0108402
- [3] M. Hanawa, Y. Muraoka, T. Tayama, T. Sakakibara, J. Yamaura, and Z. Hiroi, Phys. Rev. Lett. 87, 187001 (2001)
- [4] H. Sakai, K. Yoshimura, H. Ohno, H. Kato, S. Kambe, R. E. Walstedt, T. D. Matsuda, Y. Haga, and Y. Onuki, J. Phys.-Condensed Matter 13, L785 (2001)
- [5] R. Jin, J. He, S. McCall, C.S. Alexander, F. Drymiotis, D. Mandrus, Phys. Rev. B 64, R180503 (2001)
- [6] J. He, R. Jin, and D. Mandrus, submitted to J. Crystal growth.
- [7] There is a strong peak in at low temperature in frequency around 40 cm-1. The peak originates from a small dip in the reflectance spectrum R() which is close to unit. Since the uncertainty of the measured reflectance in low frequencies is higher, we are not certain whether this peak represents a real phonon mode.
- [8] T. Timusk and D. Tanner, in Physical Properties of high temperature superconductors I, editor D. M. Ginsberg, World Scientific Publishing Co. Pte. Ltd., (1989).
- [9] The phonon modes are not our focus in this work, so we did not try to fit the phonon modes to Lorentz oscillators.
- [10] J.W. Allen and J.C. Mikkelsen, Phys. Rev. B 15, 2952, 1977
- [11] D. A. Bonn, J. D. Garrett, and T. Timusk, Phys. Rev. Lett. 61, 1305 (1988).
- [12] L. Degiorgi, Rev. Mod. Phys. 71, 687 (1999).
- [13] L. Degiorgi, P. Wachter, M. B. Maple, M. C. de Andrade, and J. Herrmann, Phys. Rev. B 54, 6065 (1996).
- [14] A. M. Awasthi, W. P. Beyermann, J. P. Carini, and G. Gruner, Phys. Rev. B 39, 2377 (1989).
- [15] D. J. Singh, P. Blaha, K. Schwarz, and J. O. Sofo, cond-mat/0108226
- [16] S. V. Dordevic, D. N. Basov, N. R. Dilley, E. D. Bauer, and M. B. Maple, Phys. Rev. Lett. 86, 684 (2001).
- [17] P. Fulde, A. N. Yaresko, A. A. Zvyagin, and Y. Grin, Europhys. Lett. 54, 779 (2001).
- [18] M. S. Laad, L. Craco, and E. Muller-Hartmann, Cond-mat/0202531.