Two-Phase Regime in the Magnetic Field-Temperature Phase Diagram of a Type-II Superconductor
Abstract
The magnetic field and temperature dependencies of the magnetic moments of superconducting crystals of have been studied. In a constant magnetic field and at temperatures somewhat below the superconducting transition temperature, the moments are hysteretic in temperature. However the magnetic moment-magnetic field isotherms are reversible and exhibit features that formally resemble the pressure-volume isotherms of the liquid-gas transition. This suggests the existence of a first-order phase transition, a two-phase regime, and a critical point in the superconducting phase diagram. The entropy change, determined from the data using the Clausius-Clapeyron equation, is consistent with estimates based on the difference in the vortex densities of the two phases.
pacs:
74.25.Dw, 74.25.Ha, 74.60.GeThe study of magnetic field-temperature phase diagrams of type-II superconductors has revealed a rich range of behaviors, with the various transitions between vortex configurations, i.e., from lattice to liquid, glass to liquid, etc., resembling those found in ordinary matter. As a consequence, the study of thermodynamic properties of “vortex matter” has emerged as an important field of research[1]. The richness of the physics became apparent only after high-quality single-crystal samples of high temperature superconductors became available [2]. Conventional superconductors that were subsequently studied, were also found to exhibit related phenomena, examples of which are phase transitions [3] associated with the peak effect [4] in Nb, and coexistent vortex phases in the peak effect regime of NbSe2[5]. The work on Nb combined magnetic measurements with small angle neutron scattering studies, and that on NbSe2 involved a direct map of the local ac induction using a variant of scanning Hall-probe microscopy. Domains of differing pinning strength remained distinct during the transformation from stronger pinning and higher critical current at high temperature to weaker pinning and lower critical current at low temperature. Such behavior is a hallmark of a first order transition. In this Letter we report measurements of the equilibrium magnetic moments of V3Si crystals as a function of magnetic field and temperature. We provide an interpretation of the results using an analogy with the phase diagram of the liquid-gas system that further supports the existence of coexistent phases in addition to the existence of a critical point. Our approach, being based on a thermodynamic analysis of magnetization data alone, does not reveal the nature of the phases.
The intermetallic compound V3Si is a type-II superconductor that has been known since the 1950s[6]. Stoichiometric and near-stoichiometric samples form in the A15 crystal structure. The crystals used in the present work were prepared using an electron-beam floating zone technique [7]. They were characterized by metallographic and lattice parameter measurements. Also their resistivity ratios, superconducting transition temperatures, and structural transition temperatures were cataloged. The samples were flat wafers cut from the V3Si rods produced in the floating zone process, and polished using standard abrasives. Superconducting transition temperatures ranged from 16.52 K to 16.97 K, and resistivity ratios from 2.6, for the lowest transition temperature sample, up to 30 to 40 for samples with transition temperatures the order of 16.95 K. Lattice parameters ranged from 4.7300 Å for disordered samples down to 4.7242 Å for the most ordered ones. Although some wafers were single crystals, most of them were polycrystalline with large crystallites.
Measurements of magnetization were made using a Quantum Design Magnetic Properties Measurement System (MPMS). Samples, with their flat sections parallel to the magnetic field direction, were attached to a stepper-motor controlled platform and driven through a superconducting detection coil, which is a second-order gradiometer connected to a superconducting quantum interference device (SQUID). Standard software was used to determine the magnetic moment from the SQUID output signal. Although this is a conventional system for the determination of the properties of superconducting and magnetic materials, some detail is relevant, as the on-axis field homogeneity of the particular system (serial #1 of the MPMS instruments) is only 4 parts in 10,000 over a distance of 3 cm. This means that during a 3 cm scan at a field of 15 kOe, the sample in effect will be subject to a variation of magnetic field of order 6 Oe. Much has been written about the effect on the reversibility of measurements of field inhomogeneity in this instrument [8, 9]. We do not believe that much of this is relevant for this particular set of studies with these samples as the m vs. H curves that were obtained were reversible under most conditions. It is likely that the variation of the field during a scan is too small a fraction of the total field to introduce any significant additional irreversibility.
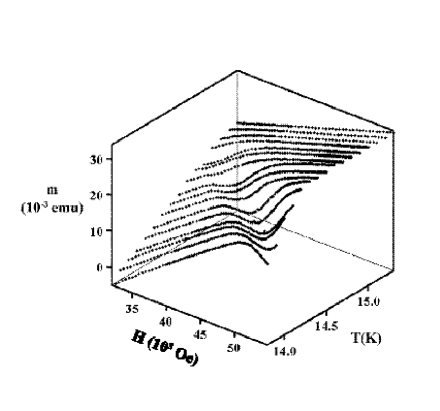
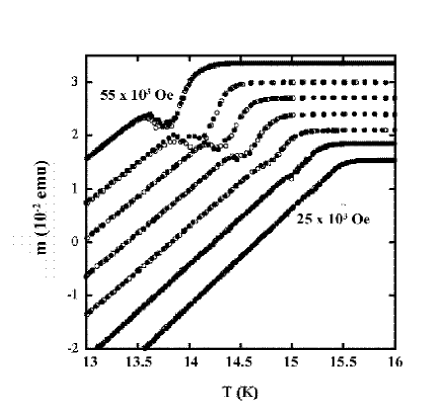
Standard plots of the magnetic moment vs. magnetic field, , for these V3Si wafers were consistent with the usual results for type II superconductors, with measured to be 700 Oe. Because the upper limit on the magnetic field in this apparatus was 55 kOe, and the upper critical field of at low temperatures is 200 kOe, there was a relatively high lower bound on the temperature at which a complete set of data could be obtained. In Fig. 1 we show a three-dimensional plot of raw data of at different fixed temperatures, for a temperature regime relatively close to the zero-field critical temperature. This particular sample was a wafer that was 0.76 cm x 0.48 cm in area and 0.053 cm thick. Below a characteristic temperature, flat sections appear in isotherms, and as temperature is decreased further these deform into structures which appear to oscillate reversibly (without hysteresis). The flat and oscillatory regimes separate regions which are distinguished by different values of the susceptibility, . In Fig. 2 we show at fixed , for a range of magnetic fields spanning the regime of and in which there are nontrivial features in the isotherms. For this mode of data acquisition, hysteretic behavior in temperature is clearly observed. This occurs even though there is no apparent hysteresis in the isotherms over the same range of temperatures.
The above-described behavior was observed in five out of seven V3Si samples. It was always seen if the samples are cooled in zero field to low temperatures, and the field and curves are obtained with increasing temperature. On the other hand, reversibility was lost in most of the samples if they were cooled in high fields before a measurement cycle was initiated. Even in this circumstance curves of in increasing field were the same as those obtained on cooling in zero field.
It is apparent from the isotherms shown in Fig. 1 that the thermodynamics of the system may best be described by considering the magnetic work done by the system when is varied at constant , [10]. This also corresponds to the choice in which the internal energy does not include the field energy. The magnetic moment, , in this instance is analogous to the pressure whereas the magnetic field, , is analogous to the volume . The variables and are used to describe mechanical work in liquids. Thus isotherms are analogs of isotherms. The data exhibit features that resemble those found in liquid-gas transitions. There are isotherms in which there are regimes in which is independent of . As the temperature is lowered, the “flat” region is replaced by a regime in which rises and falls. This is reminiscent of the behavior of the van der Waals equation for a fluid, which can describe metastable persistence of the low and high density regimes, into what is usually a two-phase region, when the pressure is constant over a range of volumes. Only in this instance the magnetic moment appears to move smoothly and reversibly between the phases, without abrupt nucleation phenomena. Perhaps the appearance, with decreasing temperature, of a continuous transformation between the two states, has to do with the growth of barriers to changing the vortex configuration and moving vortices.
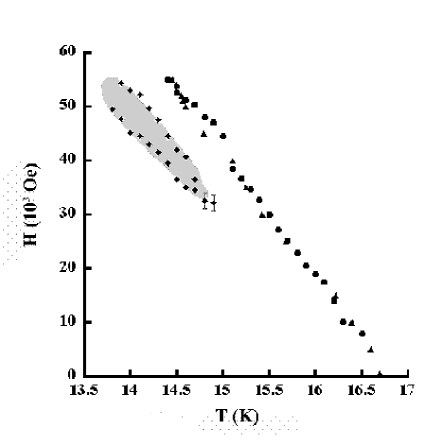
The existence of flat isotherms and the analogy with van der Waals isotherms for the oscillatory isotherms suggests a two-phase regime with an endpoint [11]. The analogy with the fluid system suggests that there is a first order transition line terminating at a critical point. The two phases associated with the first order phase transition would have to have the same symmetry[12]. In Fig. 3 we show a phase diagram for the behavior of this sample. The figure includes , in addition to lines denoting the high and low-field limits of the two-phase regime, delineated by the shaded region. Because of the limitation to 55 kOe on the highest field achievable with this apparatus, we were not able to explore this behavior to lower temperatures than shown in Fig. 1. As a consequence we do not know whether the two-phase regime terminates at a second critical point as the temperature is reduced, or persists to arbitrarily low temperatures.
The results discussed here are very different from those that have been reported previously for V3Si [13, 14]. Their isotherms were always hysteretic, exhibiting peaks and dips with decreasing and increasing magnetic field, respectively. Similar behavior was found in our most disordered samples, in our thick samples, and in our less disordered samples when their flat parts were rotated such that they were at an angle with respect to the field direction. The details of curves would thus appear to depend critically on the geometry of measurement, and the degree of disorder, although a detailed mechanism is not known. (The fact that the samples in which these effects were seen were very thin wafers may account for our results as this might minimize demagnetizing effects as well as the role of off-axis field inhomogeneities.) We must emphasize that our samples also have dislocations and defects, and are usually not single crystals, so our observations cannot be a consequence of having samples of “superior” quality. We believe that some combination of defects and geometry allow a two-phase equilibrium state to be achieved for some, but not for the full range of parameters.
There have been many discussions of nonlinear features of type-II superconductors. In fact there has been somewhat of a debate as to whether in paramagnetic materials such as V3Si these features are a signature of a generalized Fulde-Ferrell- Larkin-Ovchinnikov (GFFLO) phase [15] which can appear at high rather than at low temperatures as originally predicted. In this phase, the superconductivity becomes spatially inhomogeneous, with a wavelength that diverges at the transition to the normal state. The transition to the GFFLO phase with increasing temperature is predicted to be first order. There are no obvious features of the data that would support this interpretation.
An alternative explanation is that our observations are associated with the peak effect, a phenomenon known for many decades in conventional superconductors [4]. In the peak effect, the critical current, instead of decreasing as the superconductor-normal phase boundary is approached, increases before falling to zero at the transition. The reversibility of our isotherms would seem to rule out our observations as being attributable to dynamical effects associated with the critical current. Our previous discussion points to two distinct equilibrium vortex phases, possibly glass phases, or disordered lattice phases separated by a first order transition, which terminates at a critical point. It is conceivable that in a dynamical regime these phases could have different pinning currents as reported in Ref. [5].
An important issue is the question of what distinguishes the two phases whose thermodynamic signature is inferred in our interpretation of isotherms. The high- and low-field regimes on either side of the “two-phase” regime have different magnetic susceptibilities and their vortex densities are different. Thus the two coexisting phases would have different degrees of screening as is fixed with changing, so that would have to change. In equilibrium the free energies of the two phases at constant and would be the same. With our choice of dependent and independent variables, this leads to a Clausius-Clapeyron equation [16] of the form .
A thermodynamic consistency check of a picture in which the two phases are distinguished by their vortex densities is possible. One can determine from measured quantities and compare this value with an estimate obtained from the change in the number of states associated with the change in the vortex density across the transition. To obtain from the isotherms, we first estimate from the data of Fig. 1. (For the oscillatory isotherms we use the average moment.) We find to be 0.005 emu/K, and relatively constant over the accessible range of temperatures. The change in field across the “flat” region is about 3000 Oe. Using these values is found to be approximately
Then, the entropy per configuration in the vortex state, , is given by , where the number of configurations . Here is the number of vortices threading the sample, and the number of configurations of a single vortex. The number of vortices is given by the flux divided by the flux quantum. Taking the relevant area of the crystal to be 0.05 x 0.5 cm2, and the average magnetic field to be 40,000 Oe, we find = 5 x 10⁹ vortices. The number can be estimated as the number of vibrational modes of a vortex line. Thus is of the order of the number of unit cell layers, which with a sample of length 0.7 cm, is 1.4 x 10⁷ unit cell layers. Then the change in entropy associated with the change in field between values 1 and 2 is given by Here and are the numbers of vortices associated with the two fields, and is the average number of vortices in the two-phase regime. With an average field of 40,000 Oe, and a field change of 3,000 Oe in the case of the data in question, is found to be 2.2 x 1017kB in remarkable agreement with the value estimated from the data. If the coherence length, estimated from to be approximately 27Å, determines the cutoff in the number of modes, this estimate would be a factor of five lower. Estimates of the entropy change taking into account only the entropy of the vortex cores yield a somewhat smaller estimate of the entropy change.
In summary, magnetic moment -magnetic field isotherms of crystals of superconducting V3Si have been found to resemble the pressure-volume isotherms of the liquid-gas transition. We have suggested that this is evidence of a first-order phase transition and a two-phase regime, with a critical point in the superconducting phase diagram. As mentioned, in this instance, the two phases would have to possess the same symmetry. The precise nature of vortex phases in the presence of weak disorder is quite complicated [17], so that further studies such as measurements of specific heat, ac magnetic susceptibility, and small angle neutron scattering would be needed to resolve this issue. This work was supported in part by the National Science Foundation under grant NSF/DMR- 0138209.
REFERENCES
- [1] G. Crabtree and D. Nelson, Physics Today 50, 38 (April 1997); Defects and Geometry in Condensed Matter Physics, by David R. Nelson, Cambridge University Press, Cambridge, (2002).
- [2] For a review, see: G. Blatter, M. V. Feigel’man, V. B. Geshkenbein, A. I. Larkin, and V. M. Vinokur, Rev. Mod. Phys. 66, 1125 (1994).
- [3] X. S. Ling, S. R. Park, B. A. McClain, S. M. Choi, D. C. Denber, J. W. Lynn, Phys. Rev. Lett. 86, 712 (2001).
- [4] A. B. Pippard, Phil. Mag. 19, 217 (1969).
- [5] M. Marchevsky, M. J. Higgins, and S. Bhattacharya, Nature 409, 591 (2001).
- [6] G. F. Hardy and J. K. Hulm, Phys. Rev. 89, 884 (1953); G. F. Hardy and J. K. Hulm, Phys. Rev. 93, 1004 (1954).
- [7] T. Callaghan, J. Schwanebeck, L. E. Toth, M. Dayan and A. M. Goldman, J. Appl. Phys., 49, 2523 (1978); Meichao Hu Chiang, Masters Thesis, University of Minnesota, 1978, unpublished.
- [8] M. Suenaga, D. O. Welch, and R. Budhani, Supercond. Sci. Technol. 5, S1 (1992).
- [9] G. Ravikumar, et al., Physica C 298, 122 (1998) and references cited therein.
- [10] For a physical discussion of the difference between and work terms, see: Elementary Statistical Physics, by C. Kittel, John Wiley and Sons, Inc, New York (1958).
- [11] Jan Kierfield and Valerii Vinokur, Phys. Rev. B 61 , R14928 (2000).
- [12] See: Statistical Physics, Part 1, by E. M. Lifshitz and L. P. Pitaevskii, Pergamon Press, Oxford (1980), p. 257.
- [13] M. Isino, T. Kobayashi, N. Toyota, T. Fukase, and Y. Muto Phys Rev. B38, 4457 (1988).
- [14] S. Chaudhary, A. K. Rajarajan, K. J. Singh, S. B. Roy, and P. Chaddah, Physica C353, 29 (2001).
- [15] M. Tachiki, et al., Z. Phys. B 100, 369-380 (1996); P. Gegenwart, P. et al., Ann. Physik 5, 307 (1996).
- [16] U. Welp, J. Fendrich, W. K. Kwok, G. W. Crabtree, and B. W. Veal, Phys. Rev. Lett. 76, 4809 (1996).
- [17] T. Giamarchi and P. Le Doussal, Phys. Rev. B 52, 1242 (1995).