Permanent address: ]CNRS and Université P. et M. Curie, Laboratoire d’Optique des Solides UMR7601, T13 - C80, 4 pl. Jussieu, 75252 Paris - Cédex 05, France.
Crystal structure and lattice dynamics of AlB2 under pressure
and implications for MgB2
Abstract
The effect of high pressures to 40 GPa on the crystal structure and lattice dynamics of AlB2 was studied by synchrotron x-ray powder diffraction, Raman spectroscopy, and first-principles calculations. There are no indications for a pressure-induced structural phase transition. The Raman spectra of the metallic sample exhibit a well-defined peak near 980 cm-1 at 0 GPa which can be attributed to the Raman-active zone-center phonon. Al deficiency of 11% in AlB2, as indicated by the x-ray data, changes qualitatively the electronic structure, and there are indications that it may have a sizable effect on the pressure dependence of the phonon frequency. Similar changes of the pressure dependence of phonon frequencies, caused by non-stoichiometry, are proposed as an explanation for the unusually large variation of the pressure dependence of for different samples of MgB2.
pacs:
PACS: 63.20.-e, 74.25.Kc, 78.30.-j, 71.15.Nc, 62.50.+pI Introduction
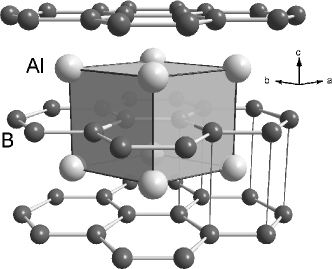
The AlB2 structure type and derivatives thereof are among the most frequently occurring ones for intermetallic binary and ternary compounds VC97 ; HP01 . Transition metal diborides, belonging to this family, have been studied in some detail because of their potential application in electronic devices Will97 to overcome current problems of electromigration, corrosion, and diffusion into the semiconductor substrate. The largest interest, however, has undoubtedly received the recently discovered superconductor MgB2 which also crystallizes in the simple AlB2 structure depicted in Fig. 1.
AlB2-type compounds have not been studied systematically at high pressures. There seem to exist no confirmed reports on pressure-induced structural phase transitions in metal diborides. There are, however, structural studies of the rare-earth metal digallides GdGa2, HoGa2, ErGa2, and TmGa2 at high pressures SBBS01 ; SBGS98 ; BSS02p ; SBGS96 . With the lighter rare earth elements La—Er the digallides crystallize in the AlB2 structure at ambient pressure. In essence, all of the rare-earth metal digallides studied so far show a transition to the UHg2 structure which is isotypic to AlB2 but with a lower ratio.
The superconductor MgB2 was studied at high pressures with regard to its superconducting transition temperature STII01 ; MNRR01 ; LMC01 ; THSH01 ; TNKK01 ; LMC01ap , crystal structure VSHY01 ; PIIC01 ; JHS01 ; GSGH01 ; BMNM01 , and lattice dynamics GSGH01 ; KLSK01 . The pressure dependence of could well be explained in the framework of phonon-mediated, i.e. BCS, superconductivity LS01 ; VSHY01 ; CZH02 . An isostructural transition near 30 GPa was reported LKQZ01 but could not be reproduced in another study up to 40 GPa BMNM01 . Much higher pressures may be necessary to induce transitions possibly towards the UHg2 structure.
We study here the effect of hydrostatic pressure on the crystal structure and lattice dynamics of AlB2. Synchrotron x-ray powder diffraction and Raman scattering experiments are complemented by first-principles calculations. The present high-pressure study was in part motivated by the question whether some of the unusual physical properties of MgB2 – such as the sizable anharmonicity YGLB01 ; KLSK01 ; LMK01 or the remarkably large calculated pressure dependence KLSK01 of the phonon – are specific to MgB2 or whether they are characteristic of other AlB2-type metal diborides as well. It aims at providing high-pressure structural and lattice dynamical information for comparison with corresponding data on MgB2. Finally, Al deficiency appears to be hardly avoidable in the growth of AlB2 MEG64 ; BGSB00 . We show that it has significant effect on the electronic structure of AlB2 and may also influence its lattice dynamics. We will discuss possible consequences of metal deficiency for the superconductor MgB2 where this issue is also of relevance.
II Experiments
II.1 Experimental Details
The structural properties of AlB2 under pressure were studied up to 40 GPa by monochromatic ( Å) x-ray powder diffraction at the European Synchrotron Radiation Facility (ESRF Grenoble, beamline ID30). Commercially available AlB2 powder (Alfa Aesar, 99%) was placed in a diamond anvil cell (DAC) for pressure generation. Nitrogen was employed as a pressure medium to provide nearly hydrostatic conditions. Diffraction patterns were recorded on image plates and then integrated soft:fit2d to yield intensity vs. diagrams.
Raman spectra of AlB2 up to 25 GPa (DAC, 4:1 methanol/ethanol mixture as a pressure medium) were excited at 633 nm utilizing a long-distance microscope objective. They were recorded in back-scattering geometry using a single-grating spectrometer with a multi-channel CCD detector and a holographic notch filter for suppression of the laser line (Dilor Labram). For the Raman experiments the DAC was equipped with synthetic diamonds (Sumitomo type IIa) which emit only minimal luminescence. In all experiments pressures were measured with the ruby luminescence method MXB86 .
II.2 X-ray diffraction under pressure
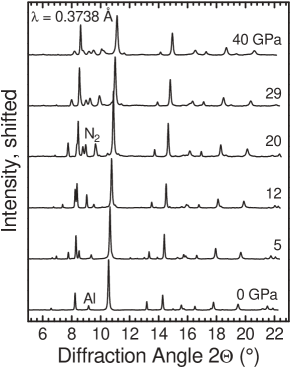
Figure 2 shows x-ray diffraction patterns of AlB2 for increasing pressures up to 40 GPa. The diagrams evidence small amounts of Al metal as a secondary phase. At pressures above 2 GPa additional reflections are observed due to various phases of solid nitrogen. There are no indications for a pressure-induced structural phase transition in AlB2 up to 40 GPa.
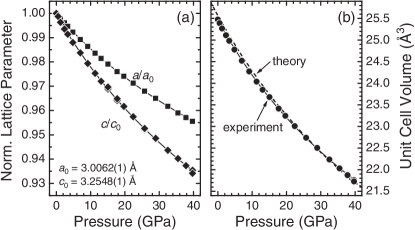
Lattice parameters as a function of pressure were determined from Rietveld-type fits of the diffraction diagrams. The compressibility of AlB2 is moderately anisotropic as illustrated in Fig. 3(a) with the softer direction being parallel to the axis. Up to 40 GPa, compression along is 47% larger than along . The ratio decreases from 1.083 (0 GPa) to 1.060 at 40 GPa. From the lattice parameters we determine the unit cell volume as a function of pressure as shown in Fig. 3(b). The data are well represented by the Murnaghan relation Mur44 . With Å3 fixed at the value determined from the zero-pressure data we obtain by least-squares fitting the bulk modulus and its pressure derivative at zero pressure as listed in Table 1.
| (Å3) | (Å) | (Å) | (GPa) | (GPa-1) | (GPa-2) | |||
|---|---|---|---|---|---|---|---|---|
| AlB2, Exp. (300 K) | 25.473(1) | 3.0062(1) | 3.2548(1) | 170(1) | 4.8(1) | 1.0827(1) | ||
| AlB2, Calc. (DFT/GGA) | 25.565 | 2.9977 | 3.2855 | 176.8 | 3.64 | 1.096 | ||
| MgB2, Exp. (300 K)JM54 | 28.99(1) | 3.0834(3) | 3.5213(6) | 147–155a | (4.0)a |
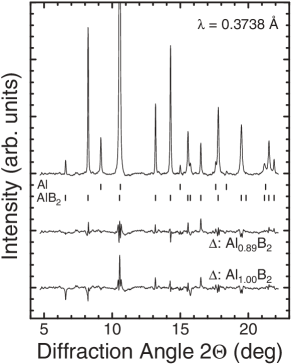
Rietveld refinements of the crystal structure with the Al site occupation as a free parameter indicate that the sample studied here has an Al deficiency of 11%. This is illustrated in Fig. 4 where difference curves for refinements of Al1.00B2 and Al0.89B2 are shown together with the experimental diffraction pattern. A Stephens peak profile Ste99 was used and a common isotropic thermal parameter for Al and B was optimized. The weighted profile value (without background) reduces from for Al1.00B2 to for Al0.89B2. This indication of substantial Al deficiency in AlB2 is in agreement with density measurements MEG64 ; BGSB00 and recent single-crystal x-ray diffraction results BGSB00 .
II.3 Raman spectra at ambient conditions
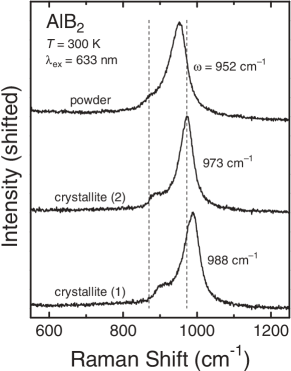
AlB2 has one Raman-active zone-center phonon mode BHR01 . It is an in-plane vibration of the B atoms with symmetry, where neighboring B atoms move out of phaseKLSK01 . The powder sample we investigated contained some small shiny crystallites up to 10 m in size. Figure 5 shows Raman spectra recorded on two different crystallites and at a sample spot where no crystallites were discernible with an optical microscope. Besides a Lorentzian-shaped peak (FWHM of 40–50 cm-1) which was attributed to the mode previously BHR01 we observe an additional step-like feature at the lower-energy side of the main peak. It is clearly visible in the single-crystal spectra and reduces to a weak shoulder in the powder spectrum. The powder spectrum resembles that reported by Bohnen et al. BHR01 . The peak position of the mode of the two crystallites differs by 15 cm-1 ( and 988 cm-1). In the powder spectrum the main peak occurs at an even lower energy of 952 cm-1. The step-like feature in the spectra of the crystallites shifts by the same amount as the main peak indicating that it is intrinsic to AlB2. It appears likely that it is related to a peak in the calculated phonon density of statesBHR01 which exists slightly below the energy of the mode.
II.4 Raman spectra under pressure
Raman spectra of AlB2 were recorded for increasing pressures up to 25 GPa. Since the sample is somewhat deformed when pressure is applied and there seems to be some inhomogeneity of the powder, several spectra were collected at different locations of the sample. The spectra shown in Fig. 6(a) result from averaging about five spectra recorded at different spots that were selected for a narrow peak and low background. The zero-pressure frequency of the mode in these averaged diagrams amounts to 981(1) cm-1. Two additional peaks near 875 and 1025 cm-1 (at 0 GPa) are due to the methanol/ethanol pressure medium.
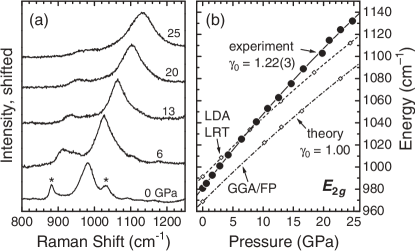
The phonon frequency increases continuously with increasing pressure, but with slightly decreasing slope . The zero-pressure mode-Grüneisen parameter amounts to (based on GPa). Up to 10 GPa the peak width (FWHM) is essentially constant at cm-1 while at higher pressures it increases to 90 cm-1 at 25 GPa. This is most likely related to the solidification of the pressure medium near 10 GPa. From the Raman data there are no indications for a structural phase transition.
III Calculations
III.1 Theoretical Method
The theoretical methods employed here were described in detail in the context of our recent work on MgB2 KLSK01 . In summary, first-principles calculations of the total energy of the solid are the basis for the determination of the equation of state (EOS) and of the phonon frequencies. The energy is computed within the density functional theory (DFT) using a plane-wave basis and pseudopotentials.
For part of the actual calculations (equation of state and phonon frequencies in the frozen-phonon approach) we employed the VASP codes KH93 ; Kre93 ; KF96a ; KF96b within the generalized gradient approximation (GGA) PW92 . The ultra-soft Vanderbilt-type pseudopotentials Van90 were supplied by Kresse and Hafner KH94 . The pseudopotential for Al treats explicitly three valence electrons (); no semi-core states are included. A ‘harder’ variant of the potential was chosen and the nonlinear core correction LFC82 is applied in order to improve the transferability. The calculations are carried out with a plane-wave cutoff energy of 23.6 Ry, and the Brillouin zone sampling is based on a -centered uniform mesh, yielding 270 to 1170 -points in the irreducible wedge of the Brillouin zone, depending on the symmetry of the lattice (equilibrium structure or crystal with the displacements of the E phonon). As the system is metallic, the -space integration with the incompletely filled orbitals uses the tetrahedron method JA71 with Blöchl’s corrections BJA94 .
Phonon frequencies were independently verified using the linear response theory Gon97 ; GL97 as implemented in the ABINIT package soft:abinit within the local density approximation (LDA) Sla51 ; KS65 to the DFT. We used Hartwigsen-Goedecker-Hutter pseudopotentials HGH98 treating Al() and B() levels as valence states, a plane-wave cut-off of 60 Ry, and a -point mesh. A Gaussian smearing with a broadening parameter of 0.04 Ry was applied to improve -point sampling in the special points method. The structural parameters were optimized for each volume/pressure such that the stress tensor components and agreed within GPa.
III.2 Structural Properties
For fourteen unit cell volumes in the range 21.8–26.2 Å3 we calculated (with the VASP codes) the total energy for different values, thus determining the optimized structures [, ] and minimized total energies. The latter data were fitted by the Murnaghan relation for Mur44
| (1) |
which provided the static equilibrium volume as well as the bulk modulus and its pressure derivative at zero pressure. The structural parameters are summarized in Table 1. The pressure–volume relation, shown in Fig. 3(b), compares well with the experimental data. The calculated equilibrium volume is 0.4% larger than the volume measured at 300 K. The individual lattice parameters are % off the experiment for , % for , and consequently +1.2% for . The variation of under pressure can be represented by a quadratic function and its coefficients are given in Table 1.
III.3 Phonon frequencies
Energies of the phonon mode as a function of pressure were initially calculated in the frozen-phonon (FP) approach using the VASP codes and the GGA. For each phonon and pressure, the atoms are given six different displacements ranging from to 0.035 and the calculated energy values are fitted with a quartic polynomial. The resulting harmonic phonon frequencies and their respective pressure dependencies are listed in Table 2 together with the experimental data for the mode and our previous FP-GGA results for MgB2KLSK01 . As illustrated in Fig. 6(b) the calculated zero-pressure frequency is only 1% lower than the experimental value, which is in the typical range for the difference between experiment and calculations of this type. Regarding the pressure dependence of the phonon frequency, however, we find an unusually large deviation of the theoretical results from the experiment. From the variation of the calculated phonon frequency with volume we obtain a zero-pressure mode-Grüneisen parameter of whereas the experimental value amounts to .
| Compound | Mode | ||||
|---|---|---|---|---|---|
| (cm-1) | (cm-1/GPa) | (cm-1/GPa2) | |||
| AlB2 | 969 | 5.425 | 1.00 | ||
| (exp.) | 981(1) | 7.027 | 1.22(3) | ||
| 490 | 2.968 | 1.06 | |||
| MgB2 | 535 | 8.974 | 2.5 | ||
| 695 | 3.065 | 0.6 |
Since the deviation of the theoretical results from the experimental data is larger than usual we performed a second calculation of the frequency under pressure using a rather different approach, namely linear-response-theory (LRT) in the LDA with the ABINIT package. Consistent with the common overestimation of bond strengths in the LDA we obtain here a somewhat larger zero-pressure phonon frequency, such that the two theoretical values bracket the experimental data at zero pressure. Over the whole pressure range the LDA/LRT calculation gives phonon frequencies which are consistently 2.4% larger than the corresponding GGA/FP results. Consequently, we obtain essentially the same pressure dependence for the two calculations. The deviation of the calculations from the experimental data is far beyond the typical uncertainty of such computations. The important difference between theory and experiment could be that the former is based on the ideal stoichiometry Al1B2 whereas the real sample is Al deficient.
For comparison with previous calculations for MgB2 we have also calculated the frequency of the phonon in AlB2 (out-plane motion of the boron atoms KLSK01 ), see Table 2. The pressure dependence is characterized by a mode-Grüneisen parameter . In case of a constant, i.e., pressure-independent the relation holds. Thus, for both the and the mode in AlB2 with there is a nearly inverse-proportional relation between the phonon frequency and volume. This is quite different from the situation in MgB2 where we do not only have the very large for the mode as noted before but also a rather small for the phonon (Table 2).
The frozen phonon calculations also yield information on the anharmonicity of the phonon modes as described in the context of our MgB2 calculations KLSK01 . In essence, the variation of the total energy with atomic displacement, , can be represented by a polynomial where the ratio of the quartic to squared quadratic coefficients is a measure of anharmonicity. In the harmonic limit . For the mode in AlB2 we obtain eV-1 which is about three orders of magnitude lower than the corresponding values for MgB2 of –8 eV-1 (see Refs. YGLB01, ; KLSK01, ). Small anharmonicities are calculated for the modes of both compounds: for AlB2 and for MgB2.
IV Discussion
IV.1 Structural stability
In our x-ray diffraction and Raman experiments we do not find any indication for a structural phase transition or modulation of the structure. Group-subgroup symmetry considerations HP01 indicate numerous possible distortions of the aristotype AlB2 most of which are realized in intermetallic compounds at ambient pressure. Pressure-induced structural phase transitions of XY2 intermetallic compounds have not been studied systematically. In the context of the AlB2 structure a number of rare-earth metal digallides SBBS01 ; SBGS98 ; BSS02p ; SBGS96 , KHg2 BSDT93 , and LaCu2 LHKR00 were investigated at high pressures. From the available data a transition between the structure types AlB2 and UHg2 appears as a typical route. The KHg2 (CeCu2) structure type may occur as an intermediate phase. AlB2 and UHg2 are isopointal structures, distinguished only by their ratios. Two clearly separated groups of compounds of AlB2 and UHg2 type are observed when plotting the ratio versus ratio of the metallic radii of XY2 intermetallic compounds Pea72 ; Pea79 ; BSS02p . The AlB2 and UHg2 type branches are characterized by ratios of 0.95–1.20 and 0.60–0.85, respectively. The compound AlB2 with (at 0 GPa) is located near the center of the former branch. In the pressure range to 40 GPa explored here it decreases only to 1.060. Pressures well above 1 Mbar may therefore be needed for a possible transition towards the UHg2 structure. At lower pressures a transition involving a buckling of the boron honeycomb layers may occur which could lead to phases of the CeCu2, CeCd2, or CaIn2 type HP01 ; BSS02p .
IV.2 Raman spectra of AlB2 vs. MgB2
Raman spectroscopy is commonly applied to semiconductors and insulators but only to a much smaller extend to metals. It is essentially the group of elemental hcp metals that has been studied systematically, already in the late 1960s at ambient pressure PFA69 and more recently at high pressures (see e.g. Refs. OJR01, ; OJ00b, and references therein). It may therefore be attributed to a lack of reference data that in case of MgB2 the observation of a very broad Raman feature (FWHM of 300 cm-1) near 600 cm-1 lead to a still unresolved controversy over the origin of this peak. It has initially been attributed BHR01 to the Raman-active mode which immediately raises the question of the large linewidth. The large peak width has been related to both strong electron phonon coupling and to structural disorder. The latter now appears less likely because Raman spectra of MgB2 powders are quite similar to those of recently available small single crystals HGPP01 ; MMRL01pv4 which are presumably less disordered. High-pressure Raman experiments KLSK01 have cast doubt on the assignment to the phonon. They revealed a double-peak structure with peaks at 603(6) cm-1 and 750(20) cm-1. Neither of the two peaks could be attributed to the mode because of severe deviations from calculated phonon frequencies in terms of zero-pressure frequencies and/or the pressure dependences.
The present Raman data of AlB2 show that it is possible to obtain Raman spectra with a well-defined peak from metallic samples of the AlB2 structure. The difficulties encountered in case of MgB2 are therefore not likely related to the metallicity of the sample nor intrinsic to the structure type. Crystallinity also appears to have only a small effect on the Raman spectrum as the Raman linewidth of the AlB2 powder sample is comparable to that of the AlB2 crystallites.
There are two properties of MgB2 with regard to phonons which make it distinct from AlB2. First, the whole phonon branch along the – direction in the Brillouin zone exhibits very strong electron-phonon coupling in MgB2 KMBA01 ; AP01 ; KDJA01 ; YGLB01 . Second, the mode shows pronounced anharmonicity YGLB01 ; KLSK01 . Both electron-phonon and phonon-phonon interaction decrease the phonon lifetime and hence increase the phonon linewidth RDT02 . They are therefore the most likely causes for the absence of a well-defined Raman peak in MgB2.
IV.3 Metal deficiency in AlB2
Our x-ray diffraction data indicate an Al deficiency of 11% in AlB2 in accord with previous density measurements and chemical analysis MEG64 ; BGSB00 as well as recent single-crystal x-ray diffraction results BGSB00 . Although the change of the phonon frequency at different sample spots suggests that there is some variation of the Al content, there is no indication that growth of aluminum diboride in the composition Al1.0B2 is possible. The occurrence of substantial metal deficiency appears to be common to many (transition) metal diborides PLBD96 .
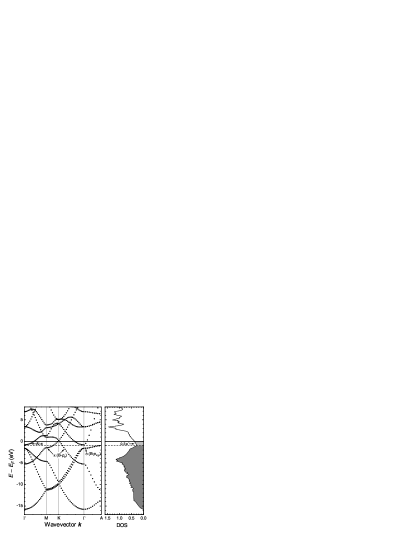
In case of AlB2 this metal deficiency has important influence on the electronic structure. A comparison of the calculated bandstructures of AlB2 and MgB2 shows that the relative ordering and dispersions of the bands near the Fermi level are very similar. The difference between AlB2 and MgB2 can largely be treated in a rigid-band picture with a higher band filling for AlB2. It is therefore justified to discuss the observed Al deficiency of 10% in a rigid-band picture, too. Figure 7 shows the calculated electronic bandstructure Wien97:AlB2 and density of states of AlB2. In case of the stoichiometric compound the -type bands derived from boron states and the bands with Al- character (near ) are partially filled and give rise to the metallic state. 10% deficiency of Al removes 0.3 valence electrons and consequently lowers by 0.9 eV which leads to a complete depletion of the band with Al- character. In other words, the experimentally observed Al deficiency is expected to lead to a qualitative change in the electronic structure compared to the ideal case of Al1B2. In terms of the Fermi surface this change means a removal of the electron pocket around .
The measured mode-Grüneisen parameter of the Al0.9B2 sample is 20% larger than calculated for Al1.0B2, a deviation which is far beyond the typical uncertainty of such computations. The zero-pressure phonon frequency, on the other hand, seems to be hardly affected. The apparent difference between experiment and calculation is the Al deficiency of the sample which was not taken into account in the theory. We tentatively attribute the discrepancy between the experimental and calculated mode-Grüneisen parameters to the Al-deficiency-induced electronic changes discussed above. However, it cannot be excluded at this point that other effects are also at work. A more detailed analysis of the effect of Al deficiency on the electronic and lattice dynamical properties of AlB2 is, however, beyond the scope of this work.
IV.4 Metal deficiency in MgB2
Mg deficiency in MgB2 was often indicated by the occurrence of MgO as a secondary phase in MgB2 samples that were grown from a molar 1:2 mixture of Mg and B. Variations of and even more of the pressure dependence of for different samples appeared to be related to non-stoichiometry of the material. The correlation between composition, structural parameters and has been established in an experiment by Indenbom et al. IUKB01 . By diffusion of Mg into a boron cylinder they produced a sample with a composition changing gradually between Mg1.0B2 and Mg0.8B2. With decreasing Mg content the lattice parameter increased by 0.003 Å (0.1%) and increased from 37.2 to 39.0 K.
Tissen et al. TNKK01 furthermore pointed out a correlation between the zero-pressure critical temperature and the pressure derivative : As increases from 37.3 to 39.2 K for various samples, changes from to K/GPa. Monteverde et al. MNRR01 discussed a similar observation on a smaller number of samples in terms of the electronic band structure and band-filling effects related to the Mg non-stoichiometry. On the other hand, the pressure-induced changes of the electronic density of states calculated for MgB2 are too small to account for the observed decrease of under compression LS01 . It is rather the increase in the relevant phonon frequencies which provides the main contribution to the pressure dependence of LS01 ; VSHY01 ; CZH02 . It would therefore be rather surprising if electronic density effects – i.e., the electronic density at the Fermi level – were responsible for the large sensitivity of on Mg non-stoichiometry.
The indications that Al deficiency in AlB2 may affect the pressure dependence of the phonon frequency hints at an alternative possible explanation for the large sensitivity of on Mg deficiency in MgB2. It was first pointed out by Yilderim et al. YGLB01 that the phonon mode in MgB2 exhibits a very large anharmonicity. Boeri et al. BBCP01pv1 showed theoretically that this effect arises in MgB2 because here the Fermi level is located only 0.5 eV below the top of bands of the equilibrium structure. The lattice distortion of the mode induces a splitting of these bands large enough that the lower split-off band sinks completely below AP01 ; BBCP01pv1 . This does not happen in AlB2 and graphite, and anharmonicity is indeed negligible.
It is also noteworthy that the mode in AlB2 is much higher in energy than the phonon whereas the reversed order is calculated for MgB2 (see Table 2) although both compounds are structurally quite similar. This effect was pointed out before and studied in Mg1-xAlxB2 mixed crystals by Renker et al. RBH02 . The interchange, which occurs only in undoped or moderately substituted material (), was also attributed to the electronic changes, especially the disappearance of the hole pockets from the Fermi surface for .
The metal content in MgB2 affects the band filling, a larger Mg deficiency moving the Fermi level further below the top of the bands. It is therefore to be expected that the anharmonicity of the mode should decrease with decreasing Mg content. Lattice dynamical calculations showed that the anharmonicity decreases with increasing pressure KLSK01 and the initially very large mode-Grüneisen parameter decreases too KLSK01 . If the mode-Grüneisen parameters decreases as function of band filling at ambient pressure, i.e., due to non-stoichiometry of MgB2, it would, qualitatively, lead to the observed relation between and Mg deficiency. This effect would be a manifestation of the changes of the lattice dynamics rather than changes of the electronic density of states. A more detailed and quantitative analysis is certainly needed, but the present results are indication of the importance of stoichiometry with regard to the superconducting properties of MgB2, specifically the pressure dependence of .
V Conclusions
We have studied the crystal structure of AlB2 by x-ray powder diffraction to 40 GPa. The compressibility is moderately anisotropic consistent with the anisotropic bonding properties. In the pressure range studied here we did not observe a structural phase transition. Our x-ray diffraction data indicate an Al deficiency of 11% in agreement with previous reports. Despite the neglect of this non-stoichiometry in our first-principles calculations, the calculated structural properties are in good agreement with the experiment.
The zone-center phonon in metallic AlB2 can be observed as a well-defined Raman peak. We conclude that the lack of such a Raman feature in MgB2 is neither related to the metallicity or disorder of the sample nor is it a generic property of AlB2-type compounds. Our observations rather support the view that it is due to the strong electron-phonon coupling and/or anharmonicity which are distinct properties of MgB2. We found some deviation of the calculated pressure dependence of the phonon frequency of AlB2 from the experimental data and tentatively attributed this to the Al deficiency of the AlB2 sample which was not taken into account in the theory.
Correlations between non-stoichiometry of MgB2 and its superconducting properties have been pointed out previously. Here we considered possible effects of Mg deficiency in MgB2 on its electronic structure and lattice dynamics. The anticipated changes are consistent with the available experimental data on the correlation between Mg content and the pressure dependence of . This leads us to propose that the large variation of the pressure dependence of ( to K/GPa) in MgB2 in various experiments may be caused by the effect of non-stoichiometry on the lattice dynamics, mediated via changes in the electronic structure of MgB2.
Acknowledgements.
We thank Yu. Grin for calling our attention to the issue of the non-stoichiometry of AlB2. The computer resources used in this work were in part provided by the Scientific Committee of IDRIS, Orsay (France).References
- (1) P. Villars and L. D. Calvert, Persons’s Handbook of Crystallographic Data for Intermetallic Phases (American Society for Metals, Materials Park, OH 44073, 1991 & 1997), second Edition, 1991, and Desk Edition, 1997.
- (2) R.-D. Hoffman and R. Pöttgen, Z. Kristallogr. 216, 127 (2001).
- (3) W. S. Williams, JOM-J. Miner. Met. Mater. Soc. 49, 38 (1997).
- (4) U. Schwarz et al., Z. Kristallogr. 216, 331 (2001).
- (5) U. Schwarz et al., J. Alloys Comp. 268, 161 (1998).
- (6) S. Bräuninger, U. Schwarz, and K. Syassen (unpublished).
- (7) U. Schwarz, S. Bräuninger, Y. Grin, and K. Syassen, J. Alloys Comp. 245, 23 (1996), ibid. 256, 279 (1997).
- (8) A. Saito et al., J. Phys.: Cond. Matter 13, L267 (2001).
- (9) M. Monteverde et al., Science 292, 75 (2001).
- (10) B. Lorenz, R. L. Meng, and C. W. Chu, Phys. Rev. B 64, 012507 (2001).
- (11) T. Tomita et al., Phys. Rev. B 64, 092505 (2001).
- (12) V. G. Tissen, M. V. Nefedova, N. N. Kolesnikov, and M. P. Kulakov, Physica C 363, 194 (2001).
- (13) B. Lorenz, R. L. Meng, and C. W. Chu, cond-mat/0104303 (unpublished).
- (14) T. Vogt et al., Phys. Rev. B 63, 220505 (2001).
- (15) K. Prassides et al., Phys. Rev. B 64, 012509 (2001).
- (16) J. D. Jorgensen, D. G. Hinks, and S. Short, Phys. Rev. B 63, 224522 (2001).
- (17) A. F. Goncharov et al., Phys. Rev. B 64, 100509 (2001).
- (18) P. Bordet et al., Phys. Rev. B 64, 172502 (2001).
- (19) K. Kunc et al., J. Phys.: Cond. Matter 13, 9945 (2001).
- (20) I. Loa and K. Syassen, Solid State Commun. 118, 279 (2001).
- (21) X. J. Chen, H. Zhang, and H.-U. Habermeier, Phys. Rev. B 65, 144514 (2002).
- (22) S. Li-Ling et al., Chin. Phys. Lett. 18, 1401 (2001).
- (23) T. Yildirim et al., Phys. Rev. Lett. 87, 037001 (2001).
- (24) A. Y. Liu, I. I. Mazin, and J. Kortus, Phys. Rev. Lett. 87, 087005 (2001).
- (25) V. I. Matkovich, J. Economy, and R. F. Giese, Jr., J. Am. Chem. Soc. 84, 2337 (1964).
- (26) U. Burkhardt et al., Annual Report 2000 of the Max-Planck-Institut für Chemische Physik fester Stoffe, Dresden, Germany.
- (27) A. Hammersley, computer program Fit2D (ESRF, Grenoble), 1998.
- (28) H. K. Mao, J. Xu, and P. M. Bell, J. Geophys. Res. 91, 4673 (1986).
- (29) F. D. Murnaghan, Proc. Natl. Acad. Sci. U.S.A. 30, 244 (1944).
- (30) M. E. Jones and R. E. Marsh, J. Am. Chem. Soc. 76, 1434 (1954), ICSD Collection Code 26675.
- (31) P. W. Stephens, J. Appl. Cryst. 32, 281 (1999).
- (32) K.-P. Bohnen, R. Heid, and B. Renker, Phys. Rev. Lett. 86, 5771 (2001).
- (33) G. Kresse and J. Hafner, Phys. Rev. B 47, R558 (1993).
- (34) G. Kresse, Ph.D. thesis, Technische Universität Wien, 1993.
- (35) G. Kresse and J. Furthmüller, Comput. Mat. Sci. 6, 15 (1996).
- (36) G. Kresse and J. Furthmüller, Phys. Rev. B 54, 11169 (1996).
- (37) J. P. Perdew and Y. Wang, Phys. Rev. B 45, 13244 (1992).
- (38) D. Vanderbilt, Phys. Rev. B 41, 7892 (1990).
- (39) G. Kresse and J. Hafner, J. Phys.: Cond. Matter 6, 8245 (1994).
- (40) S. G. Louie, S. Froyen, and M. L. Cohen, Phys. Rev. B 26, 1738 (1982).
- (41) O. Jepsen and O. K. Andersen, Solid State Commun. 9, 1763 (1971).
- (42) P. E. Blöchl, O. Jepsen, and O. K. Andersen, Phys. Rev. B 49, 16223 (1994).
- (43) X. Gonze, Phys. Rev. B 55, 10337 (1997).
- (44) X. Gonze and C. Lee, Phys. Rev. B 55, 10355 (1997).
- (45) The ABINIT code is a common project of the Université Catholique de Louvain, Corning Incorporated, and other contributors (URL http://www.abinit.org). It relies on an efficient Fast Fourier Transform algorithm Goe97 for the conversion of wavefunctions between real and reciprocal space, on the adaptation to a fixed potential of the band-by-band conjugate gradient method PTAA92 and on a potential-based conjugate-gradient algorithm for the determination of the self-consistent potential Gon96 .
- (46) J. C. Slater, Phys. Rev. 81, 385 (1951).
- (47) W. Kohn and L. J. Sham, Phys. Rev. 140, A1133 (1965).
- (48) C. Hartwigsen, S. Goedecker, and J. Hutter, Phys. Rev. B 58, 3641 (1998).
- (49) H.-J. Beister, K. Syassen, H.-J. Deiseroth, and D. Toelstede, Z. Naturforsch. 48b, 11 (1993).
- (50) A. Lindbaum et al., J. Phys.: Cond. Matter 12, 3219 (2000).
- (51) W. B. Pearson, The Crystal Chemistry and Physics of Metals and Alloys (Wiley Intersciences, New York, 1972).
- (52) W. B. Pearson, Proc. R. Soc. Lond. A365, 523 (1979).
- (53) J. H. Parker, Jr., D. W. Feldman, and M. Ashkin, in Light Scattering Spectra of Solids, edited by G. B. Wright (Springer-Verlag, New York, 1969), pp. 389–397.
- (54) H. Olijnyk, A. P. Jephcoat, and K. Refson, Europhys. Lett. 53, 504 (2001).
- (55) H. Olijnyk and A. Jephcoat, Solid State Commun. 115, 335 (2000).
- (56) J. Hlinka et al., Phys. Rev. B 64, 140503 (2001).
- (57) H. Martinho et al., cond-mat/0105204v4 (unpublished).
- (58) J. Kortus et al., Phys. Rev. Lett. 86, 4656 (2001).
- (59) J. M. An and W. E. Pickett, Phys. Rev. Lett. 86, 4366 (2001).
- (60) Y. Kong, O. V. Dolgov, O. Jepsen, and O. K. Andersen, Phys. Rev. B 64, 020501 (2001).
- (61) P. M. Rafailov, M. Dworzak, and C. Thomsen, Solid State Commun. 122, 455 (2002).
- (62) A. M. Prokhorov, N. P. Lyakishev, G. S. Burkhanov, and V. A. Dement’ev, Inorganic Materials 32, 1195 (1996), [Neoganicheskie Materialy 32, 1365 (1996)].
- (63) The electronic bandstructure and density of states were calculated using the full-potential linearized augmented-plane-wave method method as implemented in the WIEN97 code soft:WIEN97 . For the exchange-correlation potential we employed the generalized gradient approximation of Ref. PBE96, . Scalar-relativistic corrections were included. The Al states were treated as band states using the local orbital extension of the LAPW method soft:WIEN97 ; Sin91 . For -point sampling employing the tetrahedron method, 296 points were used in the irreducible wedge of the Brillouin zone (4536 in total); other parameters were ; and 1.4 for Al and B, respectively; ; .
- (64) M. V. Indenbom et al., JETP Letters 74, 274 (2001), [Pis’ma v Zhurnal Éksperimental’noĭ i Teoreticheskoĭ Fiziki 74, 304 (2001)].
- (65) L. Boeri, G. B. Bachelet, E. Cappelluti, and L. Pietronero, cond-mat/0112075v1 (unpublished).
- (66) B. Renker et al., Phys. Rev. Lett. 88, 067001 (2002).
- (67) S. Goedecker, SIAM J. on Scientific Computing 18, 1605 (1997).
- (68) M. Payne et al., Rev. Mod. Phys. 64, 1045 (1992).
- (69) X. Gonze, Phys. Rev. B 54, 4383 (1996).
- (70) P. Blaha, K. Schwarz, and J. Luitz, WIEN97, A Full Potential Linearized Augmented Plane Wave Package for Calculating Crystal Properties (Karlheinz Schwarz, Techn. Universit t Wien, Austria, 1999), ISBN 3-9501031-0-4.
- (71) J. P. Perdew, S. Burke, and M. Ernzerhof, Phys. Rev. Lett. 77, 3865 (1996).
- (72) D. Singh, Phys. Rev. B 43, 6388 (1991).