Heat Capacity of 3He in Aerogel
Abstract
The heat capacity of pure 3He in low density aerogel is measured at 22.5 bar. The superfluid response is simultaneously monitored with a torsional oscillator. A slightly rounded heat capacity peak, 65 K in width, is observed at the 3He-aerogel superfluid transition, . Subtracting the bulk 3He contribution, the heat capacity shows a Fermi-liquid form above . The heat capacity attributed to superfluid within the aerogel can be fit with a rounded BCS form, and accounts for 0.30 of the non-bulk fluid in the aerogel, indicating a substantial reduction in the superfluid order parameter consistent with earlier superfluid density measurements.
pacs:
PACS numbers: 67.57.Pq, 76.57.BcThe 1995 discovery of the superfluid transition of 3He in aerogel glass[1][2], has aroused wide interest. The 3He-aerogel system presents a unique opportunity for study of the influence of quenched impurities on the well-understood system of pure superfluid 3He. Earlier studies employing other porous media such as sintered silver or packed powders [3][4] were dominated by surface scattering and finite size effects[5]. Aerogel consists of a fractal structure of relatively uniform silica strands 30 Å in diameter. In the case of 97.6% open aerogel, employed in the present experiment, scattering due to the silica strands, though strong enough to introduce a significant quasiparticle density at T=0, is sufficiently weak so that superfluidity is not as strongly suppressed as it would be the case of more dense aerogel systems or packed powders. While previous measurements exposed the onset of superfluidity using torsional pendulem [1][6], NMR [2] [7] [8] [9] [10] and acoustic techniques[11] [12], they could not distinguish between a percolation transition, where the flow and the specific heat anomaly are distinct, and a suppressed superfluid transition[13].
In the work presented here, we examined the 3He B phase superfluid state in aerogel through heat capacity measurements at a pressure of 22.5 bar[8, 9]. Our chief result is the observation of a feature in the heat capacity coincident with the onset of superflow in the aerogel-3He system. This observation confirms that superflow onset corresponds to a true phase transition rather than to a possible dynamic effect associated with a percolation transition involving distributed superfluid regions. The analysis reveals a normal fermi liquid like contribution to the heat capacity down to the lowest temperatures, corresponding to the existence of a non-zero normal fraction down to absolute zero. In earlier work [14], we reported on measurements of the heat capacity employing a drift technique. Those measurements gave an indication of an anomaly at the aerogel superfluid transition; however, a definitive resolution of this peak has required the improvements of the present experiment.
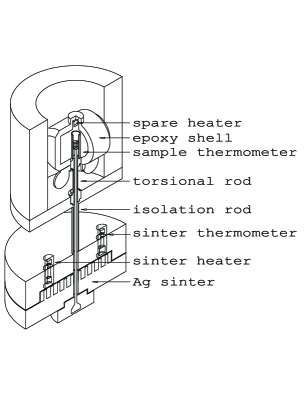
In Fig. 1, we show a cut-away diagram of the latest version of our heat capacity apparatus. The cell containing the 3He-aerogel sample also forms the inertial head of a torsional oscillator. We are thus able to correlate features in the heat capacity with the dynamic superfluid response. The liquid 3He within the apparatus is cooled by a silver sinter pad, which is thermally clamped to a PrNi5 nuclear cooling stage. There are two lanthanum diluted cerium magnesium nitrate (LCMN) thermometers; one inside the sample cell and the other located near the silver sinter. These are operated in a dc mode similar to that of the SQUID based thermometer developed by Lipa and Chui [15]. Thermometer calibration is provided by comparison to a melting curve thermometer mounted on the nuclear cooling stage[16]. Thermal contact between the heat capacity cell and the cooling stage is established via the 3He contained in the hollow torsion rod that connects the heat capacity cell to the stage. The time constant associated with this thermal contact path is designed to be at least an order of magnitude longer than the thermal relaxation time within the heat capacity cell itself. Heat pulses are applied to the sample by a non-inductive resistive heater wound around the aerogel sample. Care is taken that the heater is not close to the LCMN thermometer. In addition, a second spare heater, shown in Fig. 1, was placed in the cell.

Our measurement technique is illustrated in Fig. 2. After a demagnetization to our lowest temperatures, the cell warms slowly over several days. During this warming interval, a sequence of heat pulses is applied to the 3He within the cell and the heat capacity is determined as a function of temperature. Representative data are shown in Fig. 2, illustrating a series of heat pulses and the subsequent thermal relaxation of the sample cell temperature, . In this example, the stage temperature , is increasing at a steady rate of 15.6 K/hr and identical heat pulses are repeated at 1800 second intervals. Following each heat pulse, the cell temperature rises rapidly. Initially the temperature distribution within the cell is nonuniform. The internal equilibrium time is relatively short, so that over time the thermal distribution within the cell becomes nearly uniform. The cell temperature exhibits an exponential relaxation of the form, , where is the warming rate of the stage and is the relaxation time constant. Fits of this function to the relaxation portion of the thermal pulses are shown in the figure.
The temperature excursion during each heat pulse is relatively small, on the order of 40 to 50 K. Therefore, in our analysis we take the heat capacity, C, and thermal conductivity, , to be constant over the period of each relaxation. We proceed by calculating the net energy flow, Q, into or out of the cell during a time interval, to , restricting these times to the exponential portion of the thermal relaxation of the cell. During this period the LCMN thermometer gives a reliable value for the temperature throughout the cell. The energy flow from the cell, due to thermal conduction down the torsion rod to the stage, is obtained by numerical integration of the quantity , over the chosen time interval. If the time interval contains the heat pulse, we include the energy, , contributed by the heater. A possible choice for the first time interval would be to take , the time just before the heat pulse, and , the time at the end of the relaxation period just before the next heat pulse. The second interval, which will not include a heat pulse, might start at time (chosen in the exponential decay region) and ends at as for the first interval. Then we write two independent equations containing the heat capacity and the thermal conductivity.
| (1) |
| (2) |
These equations are then solved for C and with defined as and defined as .
| (3) |
| (4) |
One advantage of this approach is that one can vary , and check that the calculated values for C and are independent of . The thermal conductivity obtained from the above analysis is found to be a smoothly varying function of temperature except at the bulk superfluid transition where the conductivity drops by over a factor of two as the temperature rises through the transition temperature. A more detailed discussion of the data analysis and the cell construction will be found elsewhere [17] [18].
Throughout the discussion that follows the bulk contribution is taken to arise from an equivalent amount of superfluid in the absence of the aerogel.

In Fig. 3A, we have plotted the total heat capacity determined for temperatures between 0.6 to 3 mK. We also show the for the torsional oscillator. There are two conspicuous features in the heat capacity data. The first is the heat capacity anomaly associated with the superfluid transition in the 3He-aerogel sample, which coincides with the superfluid aerogel transition, , as marked by the torsional oscillator. The second feature is the sharp jump in the heat capacity due to bulk 3He within the cell. Above the bulk transition, , a linear temperature dependence is seen, as expected for a normal Fermi liquid. We also note that in addition to the linear term in this region there appears to be a small additional constant contribution to the heat capacity (J/K). Golov and Pobell suggest that this contribution may arise from ordering in the amorphous solid 3He layer [19].
Since our main interest is in the heat capacity associated with the 3He-aerogel superfluid transition, we shall subtract the bulk 3He heat capacity contribution. For this purpose we use the data of Greywall [16] and multiply by a suitable factor so as to produce a smooth continuation of the remaining heat capacity data across the temperature of the bulk transition. The magnitude of the subtracted heat capacity indicates that a fraction (0.295) of the sample has the heat capacity of bulk 3He. This fraction is more than we can reasonably account for in terms of cracks and small volumes outside of the aerogel itself. Therefore we conclude that our sample of aerogel must contain a number of macroscopic pores.
The heat capacity data remaining after the subtraction of the bulk are shown in Fig. 3B. The heat capacity anomaly associated with the aerogel transition shows rounding but is clearly separated from the bulk transition. The linear Fermi liquid region extends smoothly from temperatures above the bulk transition right to the transition in aerogel. In the region between the bulk transition and the aerogel we find no indications of the anomalous behavior suggested by recent Grenoble NMR experiments [10].
The 3He in aerogel effective mass, , can be determined from the slope of the heat capacity in the Fermi-liquid region [16] [20] after the fraction of bulk 3He has been subtracted. From the slope of the data of Fig. 3B above , we find , approximately 30% larger than the ratio for bulk superfluid 3He at this pressure. The apparent enhancement of cannot be ascribed to a miscounting of the number of 3He atoms in the cell, and we believe that it must reflect a change in the excitations induced in the normal state by the presence of aerogel.
The simplest theoretical approach to the problem of superfluid 3He in aerogel is that of the Homogeneous Scattering Model (HSM) [21], which treats the aerogel as homogeneous collection of scattering centers. The HSM predicts a reduction of the transition temperature comparable to that seen in our experiments, as well as suppression of the order parameter.
In order to assess the fraction of fluid contributing to the aerogel superfluid transition, we have fit the data to an interpolation of the BCS specific heat (Eq. 5)[22]. We take the weak coupling value of , a transition temperature, , of 1.65 mK, , the normal fermi liquid heat capacity contribution, , and the weak coupling value of .
| (5) | |||
| (6) |
The BCS specific heat is shown in figure 3B. Since the peak in the measured heat capacity is somewhat rounded, we fit it with a convolution of the BCS form with a gaussian distribution of critical temperatures, and display the residual heat capacity in figure 3C, along with the convolved BCS heat capacity. The best fit is from a gaussian of width , and the gaussian is displayed in figure 3B. The dashed line in figure 3C is a linear fit to the normal fermi liquid remaining above . The residual heat capacity below rises above this line, suggesting other contributions to the low temperature heat capacity. This might be expected as a consequence of the magnetic ordering of the solid 3He substrate atoms, but this contribution is expected to be on the order of the temperature independent constant at our lowest temperature [23]. Such an ordering of the solid layer is a feature observed in the earlier NMR aerogel experiments [2] [7] [8] [9]. As has been demonstrated by the NMR [7] [9], the influence of the magnetic solid 3He layer can be removed by the addition of a few layers of 4He on the substrate. This will be an interesting direction to pursue in future aerogel heat capacity experiments.
The implied normal fermi liquid fraction is unchanged by choice of , and remains at 0.30. If we apply the results of Lawes and Parpia for the reduction of the energy gap for our of 0.71 [24], we find . The residual heat capacity computed for this value is shown in figure 3D, and shows much less deviation from normal fermi liquid heat capacity (drawn as a dotted line) than that of weak coupling energy gap value. At lowest temperatures, the residual rises above the normal fermi liquid, still suggesting an extra heat capacity contribution, though much less than that implied from figure 3C.
Somewhat surprisingly, we find that the fraction of the fluid that appears to participate in the aerogel superfluid state is only a fraction, 0.30, of the total. Expressed in terms of the order parameter, one would conclude that there has been a reduction by a factor of over two under the conditions of our experiment. This result is in keeping with the order parameter reductions observed in the Cornell torsional oscillator experiments [1][24], and in agreement with the gapless superfluid model of Sharma and Sauls [25].
In conclusion, we find that the behavior of 3He confined to aerogel shows normal Fermi liquid characteristics above the superfluid transitions. The enhancement of the effective mass along with the low temperature excitations contribution in this region can be further studied as a function of pressure in future research. While a sizeable fraction of fluid in the cell exhibits bulk-like characteristics, a comparable fraction displays a BCS-like heat capacity centered at the reduced , in conformity with expectations of a suppressed phase transition. Thus there appears to be a significant contribution (30%) of “bulk like” gapped excitations, and evidence for a gapless contribution to the specific heat in conformity to observations in torsional pendulum measurements [1].
The authors are especially grateful to Prof. Norbert Mulders of the University of Delaware who supplied the aerogel sample used in this experiment. We also wish to recognize the contributions of A.L. Woodcraft and G.M. Zassenhaus to early development of this experiment, and also acknowledge valuable discussions with Prof’s M.H.W. Chan and T.L. Ho, and Dr. E.N. Smith. One of us, J.D.R. would like to acknowledge the Institute for Solid State Physics, University of Tokyo, for hospitality during the period this paper was prepared. The research has been funded by the NSF under grants DMR-0071630 and DMR-9971124.
REFERENCES
- [1] J.V. Porto and J.M. Parpia, Phys. Rev. Lett. 74, 4667 (1995).
- [2] D.T. Sprague, T.M. Haard, J.B. Kycia, M.R. Rand, Y. Lee, P.J. Hamot, and W.P. Halperin, Phys. Rev. Lett. 75, 661 (1995).
- [3] K. Ichikawa, S. Yamasaki, H. Akimoto, T. Kodama, T. Shigi, and H. Kojima, Phys. Rev. Lett. 58, 1949 (1987).
- [4] T. Hall, S.M. Tholen, K.R. Lane, V. Kotsubo, and J.M. Parpia, J. Low Temp. Phys. 89, 897 (1992).
- [5] V. Ambegaokar, P.G. de Gennes, and D. Rainer, Phys. Rev. A 9 2676 (1974).
- [6] K. Matsumoto, J.V. Porto, L. Pollack, E.N. Smith, T.L. Ho, and J.M. Parpia, Phys. Rev. Lett. 79, 253 (1997).
- [7] D.T. Sprague, T.M. Haard, J.B. Kycia, M.R. Rand, Y. Lee, P.J. Hamot, and W.P. Halperin, Phys. Rev. Lett. 77, 4568 (1996).
- [8] H. Alles, J.J. Kaplinsky, P.S. Wootton, J.D. Reppy, J.H. Naish, and J.R. Hook, Phys. Rev. Lett. 83, 1367 (1999).
- [9] B.I. Barker, Y. Lee, L. Polukhina, D.D. Osheroff, L.W. Hrubesh, and J.F. Poco, Phys. Rev. Lett. 85, 2148 (2000).
- [10] Y.M. Bunkov, A.S. Chen, D.J. Cousins, and H. Godfrin, Phys. Rev. Lett. 85, 3456 (2000).
- [11] A. Golov, D.A. Geller, J.M. Parpia, and N. Mulders, Phys. Rev. Lett. 82, 3492 (1999).
- [12] G. Gervais, K. Yawata, N. Mulders, and W.P. Halperin, cond-matt/0202323 unpublished.
- [13] C. Ebner, and D. Stroud, Phys. Rev. B 23 6164 (1981).
- [14] Jizhong He, A.D. Corwin, G.M. Zassenhaus, A.L. Woodcraft, N. Mulders, J.M. Parpia, J.D. Reppy, and M.H.W. Chan, J. Low Temp. Phys. 121, 561 (2000).
- [15] J.A. Lipa, B.C. Leslie, and T.C. Wallstrom. Proceedings of LT-16 in Physica 107B, 331 (1981); T.C.P. Chui and J.A. Lipa, Proc. LT-17, U. Eckern, A. Schmid, W. Weber, H. Wuhl eds., North-Holland Amsterdam, 931 (1984).
- [16] D.S. Greywall, Phys. Rev. B 33, 7520 (1986).
- [17] Jizhong He, A.D. Corwin, N. Mulders, J.M. Parpia, J.D. Reppy, and M.H.W. Chan, J. Low Temp. Phys. 126, 679 (2002).
- [18] A.D. Corwin, Cornell University Ph. D. Thesis, 2002 unpublished.
- [19] A. Golov, and F. Pobell, Phys. Rev. B 53, 12647 (1996).
- [20] J.C. Wheatley, Rev. Mod. Phys. 47, 415 (1975).
- [21] E.V. Thuneberg, S.K. Yip, M. Fogelstrom, and J.A Sauls, Phys. Rev. Lett. 80, 2861 (1998).
- [22] B. Muehlschlegel, Z. Phys. 155, 313 (1959).
- [23] D.S. Greywall, and P.A. Busch, Phys. Rev. Lett. 60, 1860 (1988).
- [24] G. Lawes, and J.M. Parpia, Phys. Rev. B 65, 092511 (2002).
- [25] P. Sharma, J.A. Sauls, J. Low Temp. Phys. 125, 115 (2001).