[
Fermi Surfaces of Diborides: MgB2 and ZrB2
Abstract
We provide a comparison of accurate full potential band calculations of the Fermi surfaces areas and masses of MgB2 and ZrB2 with the de Haas-van Alphen date of Yelland et al. and Tanaka et al. respectively. The discrepancies in areas in MgB2 can be removed by a shift of bands downward with respect to bands by 0.24 eV. Comparison of effective masses lead to orbit averaged electron-phonon coupling constants =1.3 (both orbits), =0.5. The required band shifts, which we interpret as an exchange attraction for states beyond local density band theory, reduces the number of holes from 0.15 to 0.11 holes per cell. This makes the occurrence of superconductivity in MgB2 a somewhat closer call than previously recognized, and increases the likelihood that additional holes can lead to an increased Tc.
]
I Introduction
The discovery of superconductivity in MgB2 near 40 K by Akimitsu’s group[1] and the subsequent intense experimental investigation of its properties and theoretical exposition of the underlying causes, has made it clear that MgB2 is the first member of a new class of superconductors. Although intermetallic like the best superconductors before 1986, it does not have electrons, it does not have a high density of states at the Fermi level EF, and it is strongly anisotropic in its crystal and electronic structures.[2, 3, 4, 5, 6, 7, 8] In another important way, it is distinct from the other intermetallic superconductors: it derives its high superconducting critical temperature Tc from extremely strong coupling from only a small fraction of the phonons to specifically a limited part of the Fermi surface (FS).[2, 4, 5, 6, 9, 10] Other diborides, at least so far, are disappointing with regard to their superconductivity – a study of TaB2 reveals that the presence of Ta electrons in the valence band region results in a completely different electronic structure,[11] especially the states at the Fermi level, and accounts for its lack of bulk superconductivity.
Although the properties of MgB2 appear to be described consistently, and reasonably accurately, by a Fermi liquid picture based on the band structure calculated in the local density approximation (LDA), there have been few opportunities to make detailed quantitative comparison with experimental data. Therefore there has been a broad range of alternative suggestions. Imada has suggested strong interband Coulomb exchange processes[12]. Furukawa has raised the possible importance of half-filled bands[13]. Hirsch and Marsiglio[14] suggest that hole-undressing by Coulomb interaction in nearly filled bands is responsible. Referring to optical data on oriented films, Marsiglio[15] has suggested that coupling via a high energy electronic mode is plausible. Baskaran[16] has revived the Pauling resonating-valence-bond picture of benzene as having possible application to the graphene layers of boron in MgB2. Nonadiabatic processes strongly affecting the occurrence of superconductivity have been put forward, by Alexandrov based on penetration depth data [17] and by Cappelluti et al. on the basis of several experimental results that are not readily understandable in terms of conventional (isotropic) Eliashberg theory.[18]
Although the crystal structure of MgB2 is quite simple, it is strongly layered and electronic characteristics are predicted to be strongly anisotropic. So far few single crystals have been obtained, so single crystal optical conductivity data is not available. In addition, the strong “anisotropies” mentioned above necessitate a two-band model[7, 9, 19, 20] or a fully anisotropic treatment[10] to account properly for the data, and such interpretations are only recently being carried out. Photoemission data on single crystals allow direct comparison, and the agreement between band theory and angle-resolved photoemission spectroscopy is good[21, 22] down to the scale of a few tenths of an eV.
The recently reported observation of de Haas-van Alphen (dHvA) oscillations on single crystals by Yelland et al.[23] is a crucial development that provides the opportunity for detailed evaluation of LDA predictions. These measurements detected three frequencies (extremal Fermi surface areas F) and information about the orbit-averaged electron-phonon effective mass and scattering time . Comparing to reports of Elgazzar et al.[24], who used the augmented spherical wave (ASW) method within the spherical potential approximation, Yelland et al. concluded that discrepancies with band theory are 40-80% in the FS areas. This discrepancy seems large enough to suggest the occurrence of important correlation effects beyond LDA. If this is true, our current understanding of the properties of MgB2 might need revision. Mazin and Kortus have presented orbital areas[25] that are close enough to the observed values to give confidence in the band picture.
In this paper we provide a comparison of careful calculations of extremal areas and band masses for MgB2. To provide comparison and contrast in a related diboride, we provide similar information for the isostructural refractory diboride ZrB2, which has recently been reported[26] to superconduct at Tc = 5.5 K whereas earlier searches observed no superconductivity.[27] The extensive dHvA data available for ZrB2 makes this a particularly useful system to study. We find, with one possible exception that we discuss, that LDA predictions seem to provide an excellent description for ZrB2. For MgB2 there is some disagreement in FS areas that can be accounted for by a shift of (B ) bands with respect to (B ) bands by 240 meV and readjustment of the “Fermi energies” of each of these bands by 120 meV. This result is roughly consistent with that of Mazin and Kortus.[25] Such shifts will lead to quantitative, but most likely not qualitative, corrections in the extent explanation of MgB2 superconductivity.
II Calculational Methods
The precision and consistency of the calculations using different methods is a concern, in light of the apparent discrepancy between the band structure results of Elgazzar et al. and the data of Yelland et al. Therefore we have applied two full potential, all-electron methods of calculation that have produced equivalent results for several other systems.[28, 29] One method is the full potential linearized augmented plane wave (FLAPW) method[30] as implemented in the WIEN97 code.[31] The other method is full potential local orbital code (FLPO) [32] based on local orbitals optimized to minimize the electronic energy.
There are two computational details that require attention, especially for MgB2, in order to obtain the precise predictions of band theory. Both are related to the existence of small volume Fermi surfaces [the smallest contains 3% of the Brillouin zone (BZ) volume], for which small shifts of the band edge make appreciable differences. The first issue is that the non-spherical nature of the charge density (related to the distinctly different contributions to the density from and states) and potential is important. Comparing the FPLO method with basis functions optimized as usual (to minimize the energy) with the FLAPW results revealed that the dispersion of the band along -A was slightly different for the two methods. The reason is that the extension parameter for the FPLO basis functions is optimized only with respect to the main quantum number and the angular momentum at a given site. Increasing the flexibility of the FPLO basis resulted in agreement with the FLAPW result. On the other hand, the standard FPLO-basis set resulted in agreement with the WIEN97 code for ZrB2, suggesting that the charge density for the latter compound is less anisotropic than in MgB2. This implies as well that the discrepancy of the results of Elgazzar et al.[24] is due to the spherical approximation of the potential they used.
The second item is the dense point sampling that is necessary to obtain the fraction of band holes accurately, and hence the charge density and potential, a point noted by Mazin and Kortus.[25] Increasing the number of inequivalent, equally spaced points in the irreducible BZ from 2000 (which already would be considered to be a fine mesh) to 16600 results in changes in area of the smallest orbits (see Table I) by 2-3%. Because of such sensitivities, we quote areas and masses only to 2+ significant digits. Unlike non-sphericity and k point sampling, the choice of exchange-correlation potential makes no physical difference. Using the LAPW code, we checked the eigenvalues of the unoccupied states at and A. Measured relative to the Fermi level, these differed by no more that 2.5 meV between the LDA of Perdew and Wang[33] and the generalized gradient approximation of Perdew, Burke, and Ernzerhof.[34]
III Results and Comparison with Experiment
A ZrB2
As in MgB2 (but for a different reason) it is not easy to prepare single crystals of ZrB2 due to its melting temperature above 3300 K. However, single crystal studies have been reported. dHvA data have been provided and analyzed for ZrB2 by Tanaka and Ishikawa,[35, 36] and the data are similar to those reported for the isostructural and isovalent sister compounds TiB2[36, 37] and HfB2.[38]
The band structure has been presented previously, based on a variety of computational methods,[39, 40, 41, 42, 43] each involving simplifications that we avoid. Our calculated band structure and density of states (DOS), calculated for =3.170 Å, =3.532 Å, are similar to those presented earlier, so we do not present them here. The Fermi energy lies in a “pseudogap,” which is due to relatively large velocities in the region of EF rather than any semimetallic overlapping of bands (where there would be small FSs and low velocities). The occupied B states are mostly in the -4 eV to -2 eV region (EF is taken as the zero of energy), while states are spread throughout the valence band region. Due to strong hybridization of the Zr states with the B states, the - distinction is not as clear in ZrB2 as it is in MgB2. The Zr DOS shows that considerably less than 40% of the DOS is occupied (which would be the case four of ten possible electrons) suggesting ZrB charge transfer.

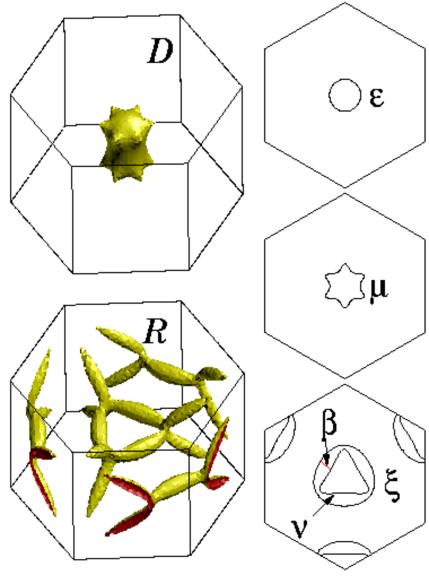
The Fermi surfaces, shown in Fig. 2, consist of a K-centered barbed ring with threefold symmetry, and an A-centered dumbbell with sixfold symmetry. We use the orbit designations of Tanaka and coworkers.[35, 36] For the field along (0001), the surface gives a rounded triangular orbit () encircled by a nearly circular orbit (), while the surface gives a circular orbit () around its waist and a smoothed-star orbit () at each end. These cross sections are also shown in Fig. 2. In addition, we consider the orbit for field along (), which is the cross section of the barbed ring in Fig. 2. These Fermi surfaces, which are broadly consistent with those used by Tanaka and coworkers to interpret their dHvA data. The Fermi surfaces presented by Shein and Ivanovskii (Fig. 1 in Ref. [43]) are quite different. The origin of this difference is unclear, since the full potential linear muffin-tin orbital method they use should give the same results as our methods. We note that their value N(EF) = 0.163 eV-1 differs considerably from our results and most of the previous calculations. [39, 40, 46]
The general shape of the density of states, and the low value of N(EF), was confirmed by xray photoemission spectroscopy measurements.[39] The most noteworthy feature, in light of a new report[26] of Tc = 5.5 K, is the small calculated value of N(EF) = 0.26 /eV-cell, corresponding to a bare linear specific heat coefficient = 0.61 mJ/mole-K2. [The value of N(EF) is somewhat sensitive to the quality of the calculation.] The reported experimental[44] value of = 0.47 mJ/mole-K2, which should include electron-phonon enhancement, is smaller than our bare band structure value.
The low value of N(EF) itself and the weak coupling[45] seem inconsistent with Tc = 5.5 K; it would require very large electron-phonon matrix elements which has been shown not to be the case in another transition metal diboride TaB2.[11] Since all information is consistent with the observed superconductivity arising from a minority phase in the sample, and the calculations seem to make make superconductivity unlikely, we conclude that ZrB2 itself is not superconducting. These facts, and results presented below, suggest that remeasurement of the heat capacity on additional samples may be called for. In any case, the occurrence (or not) of superconductivity in ZrB2 is peripheral to the intent of this paper.

The calculated and observed areas are given in Table I. Percentage discrepancy or even absolute differences do not give the most physical indication of the level of (dis)agreement, especially when areas get small (see MgB2, below). To indicate more clearly the implication of the discrepancy between theory and observation, in Fig. 3 the orbit areas F(E) versus energy are provided. The observed areas are shown as horizontal lines, which allows one to read off the shift in any given band to bring its area into agreement with the observed area. The band masses, proportional to the derivative , are also readily obtained from such curves.
For the orbits in the range 1.8 kT F 3 kT, the agreement is excellent, probably within the total numerical precision. For the orbit, the agreement is not good: the reported area is 10% smaller than we calculate (this amounts to 1.4% of the BZ basal plane area). Moreover, it is unlikely that even this relatively modest disagreement can be achieved by a shift of the band, because such a shift destroys agreement for the orbit and results in a change of topology of the constant energy surfaces. To investigate this discrepancy further, we have calculated the orbit around the surface, which passes through both the and orbits. This area is in excellent agreement with experiment (see Table I). It may be possible, but seems unlikely, that this disagreement could be reconciled by some non-rigid shift(s) of band(s). It is possible that this discrepancy is due to experimental conditions: the orbit is the largest, giving the fewest oscillations to fit to an oscillatory form, hence larger uncertainty in the result. An experimental reinvestigation of the dHvA frequencies is under way [47] to either confirm or resolve this discrepancy.
B MgB2
To facilitate understanding of notation, we identify the orbits by their B character ( or ) and by the point in the BZ around which they are centered. The Fermi surfaces, pictured in several previous publications,[3, 6] are two concentric fluted cylinders oriented along -A, which give rise to extremal orbits , , , for magnetic field along (0001). ( denotes small, large.) The bands give rise to and for field along (0001), for field along (100), and for field along (1000).
The calculated areas and band masses are given in Table II, with comparison to the three orbits of Yelland et al.[23] assuming the same correspondence of observed orbit and calculated orbit. For reference, an area of 1 kT corresponds to 2% of the area ABZ of the basal plane of the BZ. For the three observed orbits, the calculated areas are 0.300.04 kT larger than observed, i.e. a discrepancy equal to 0.6% of ABZ. Our calculated areas are in good agreement (usually close to significant digits) with those of Mazin and Kortus.[25] There are differences compared to the areas presented by Elgazzar et al.[24] (most of our areas are 20% smaller), presumably due to the approximations made in their augmented spherical wave method.
In Fig. 4 the orbit areas F(E) versus energy are provided. The band masses are seen to be insensitive to the position of the Fermi energy except for the two largest orbits. These values are in good, but not quite perfect, agreement with those of Mazin and Kortus. The observed areas (Table II) are shown as horizontal lines, which allows one to read off the shift in any given band to bring its area into agreement with the observed area. (Due to the difference in the and densities of states at EF, charge balance requires a readjustment of EF by 20 meV.) The required energy shift is -115 meV for both and , and +125 meV for , both of which reduce the sizes of the hole and electron Fermi surfaces. These required shifts imply: (1) there is a relative shift of the bands relative to the bands by 240 meV presumably due to correlation effects beyond LDA, and (2) the dispersion of the bands along the -A line is described correctly in band theory (the same band shift is required at and at A). The data give the areas for only a single tube (the smaller one), but since the two are degenerate along -A, both bands must shift together.

The observed effective masses include an enhancement due (primarily) to electron-phonon coupling, which is given in Table II and is obtained from ). For both orbits the enhancement thus derived is =1.3; for the orbit it is =0.5. These orbit enhancements are noticeably larger than the average values over each surface obtained from solution to the anisotropic Eliashberg equations with first principles band theory input by Choi et al.[10] The difference particularly for the bands might indicate there is some feature of strong coupling in MgB2 yet to be understood, or possibly that the band shift necessary to provide agreement with orbit areas, when taken into account in the calculations of electron-phonon coupling, will ameliorate this discrepancy. The disagreement is small enough that the general picture – the quasiparticle band structure and electron-phonon coupling determined within conventional (LDA) band theory, then Tc determined by Eliashberg theory – seems well justified.
IV Discussion
For ZrB2 the only discrepancy between calculated and observed areas occurs for the largest orbit that was observed, the overall agreement between the calculated and the observed frequencies is of the same order as the achievable numerical accuracy. Because of the strong hybridization between the Zr and the B states, ZrB2 has a much more isotropic electronic structure than does MgB2. As a result, any renormalization and shift of bands with respect to each other seems to be negligible for this compound, and the LDA single particle picture description is well justified.
While the observed dHvA areas of MgB2 are readily understood in terms of the calculated Fermi surfaces and the inferred electron-phonon coupling constants are reasonable, complete agreement of the FS areas with the data requires a shift of the bands by 115 meV downward, and a shift of the bands upward by 125 meV. The necessary shift results in band edges at and A that are reduced 0.38 eV 0.25 eV, 0.76 eV 0.63 eV, respectively. The volume of the tube, proportional to the average of the two areas in Table II, then is about 30% smaller than given by the band calculation, so the number of holes decreases proportionally (from 0.146 to 0.106).
We can suggest at least two possible causes of this “beyond LDA” correction to the band structure. One possibility is related to the observation that the charge in the bands is confined to the two dimensional B sheet of graphene structure, nearly filling those bonding states. Being of more localized character than the bands, the exchange potential in LDA may be less accurate than for the electrons; a better exchange potential would be larger in magnitude (and attractive), lowering the bands with respect to the bands. A related viewpoint of the same physics is that there is a larger (spurious) self-interaction for the states than for the states in LDA.
Another possible correction could arise from residual hole-hole Coulomb interactions in the -hole gas. There is some analogy with a related situation in metallic, ferromagnetic Ni, where there are 0.6 holes/Ni in the minority bands. Unlike in MgB2, in Ni there is presumably a relatively large value of the ratio (intra-atomic Coulomb interaction U, bandwidth W) making Hubbard-type correlations of some relevance. MgB2 has broad bands, so Hubbard-like correlations should not be the problem. The strong 2D character of the band holes may enhance many body corrections. It will require further work to determine whether it is one of these mechanisms, or perhaps some other, that is responsible for the band structure corrections.
V Summary
The rather close correspondence of the LDA Fermi surfaces of MgB2 supports the prevalent picture of superconductivity that is based on the LDA starting point: very strong electron-phonon coupling of band hole states to certain phonons (the E2g branch). Of the suggested alternatives cited in the Introduction, the comparison we have made tends to rule out several of them. Although the band Fermi energy requires some adjustment to account for the observed dHvA orbital areas, it remains around 0.5 eV, large enough to render non-adiabatic processes unimportant in superconducting pairing. The half-filled ideas and resonating valence bond state idea certainly get no support from the correspondence of dHvA data to the band theory results. Other experimental data (penetration depth, specific heat, isotope shift, superconducting gap and Tc itself) are being shown in many studies to require an anisotropic (two band) model, and that most data seem to be consistent with such models based in detail on band theory results. Single crystal data, of which the dHvA data[23] are some of the first, will serve to clarify these issues further.
VI Acknowledgment
We thank A. Carrington, J.R. Cooper, H. Eschrig, I. Mazin, K. Winzer, H. Uchiyama, P.M. Oppeneer, and S.V. Shulga for helpful discussions. This work was supported by National Science Foundation Grant DMR-0114818 (W.E.P.), and by the Deutscher Akademischer Austauschdienst (H.R.).
REFERENCES
- [1] J. Nagamatsu et al., Nature 410, 63 (2001).
- [2] J.M. An and W.E. Pickett, Phys. Rev. Lett. 86, 4366 (2001)
- [3] J. Kortus, I.I. Mazin, K.D. Belashchenko, V.P. Antropov and L. L. Boyer, Phys. Rev. Lett. 86, 4656 (2001).
- [4] Y. Kong, O.V. Dolgov, O. Jepsen, and O.K. Andersen, Phys. Rev. B 64, 20501 (2001).
- [5] K.-P. Bohnen, R. Heid, and B. Renker, Phys. Rev. Lett. 86, 5771 (2001).
- [6] T. Yildirim et al., Phys. Rev. Lett. 87, 037001 (2001).
- [7] S.V. Shulga, S.–L. Drechsler, H. Eschrig, H. Rosner, and W.E. Pickett, preprint cond-mat/0103154, 2001.
- [8] P. Ravindran et al., Phys. REv. B 64, 224509 (2001).
- [9] A. Y. Liu, I. I. Mazin, and J. Kortus, Phys. Rev. Lett. 87, 087005 (2001).
- [10] H. J. Choi, D. Roundy, H. Sun, M. L. Cohen, S. G. Louie, cond-mat/0111182,cond-mat/0111183 (2001).
- [11] H. Rosner et al., Phys. Rev. B 64, 144516 (2001).
- [12] T. Imada, J. Phys. Soc. Japan 70, 1218 (2001).
- [13] N. Furukawa, J. Phys. Soc. Japan 70, 1483 (2001).
- [14] J. E. Hirsch and F. Marsiglio, Phys. Rev. B 64, 144523 (2001).
- [15] F. Marsiglio, Phys. Rev. Lett. 87, 247001 (2001).
- [16] G. Baskaran, cond-mat/0103308.
- [17] A. S. Alexandrov, cond-mat/0104413.
- [18] E. Cappelluti, S. Ciuchi, C. Grimaldi, L. Pietronero, and S. Strässler, cond-mat/0105351.
- [19] A. A. Golubov it et al., cond-mat/0111262.
- [20] Y. Wang, T. Plackowski and A. Junod, Physics C 355, 179 (2001).
- [21] H. Uchiyama et al., cond-mat/0111152.
- [22] V.D.P. Servedio et al. cond-mat/0111434 .
- [23] E. A. Yelland, J. R. Cooper, A. Carrington, N. E. Hussey, P. J. Meeson, S. Lee, A. Yamamoto, and S. Tajima, cond-mat/0112392.
- [24] S. Elgazzar, P.M. Oppeneer, S.-L. Drechsler, R. Hayn and H. Rosner, Solid State Commun. 121, 99 (2001).
- [25] I. I. Mazin and J. Kortus, cond-mat/0201247.
- [26] V. A. Gasparov et al., Pis’ma Zh. Eksp. Teor. Fiz. 73, 604 (2001) [JETP Lett. 73, 532 (2001).
- [27] L. Leyarovska and E. Leyarovsku, J. Less-Common Metals 67, 249 (1979).
- [28] H. Rosner et al., Phys. Rev. Lett. 88, 027001 (2002).
- [29] H. Rosner, M. Diviš, S.-L. Drechsler, K. Koepernik and H. Eschrig, J. Phys.: Condens Matter, 12 5809 (2000).
- [30] D. J. Singh, Planewaves, Pseudopotentials, and the LAPW Method (Kluwer Academic, Boston, 1994).
- [31] P. Blaha, K. Schwarz, and J. Luitz, WIEN97, Vienna University of Technology, 1997. Improved and updated version of the original copyrighted WIEN code, which was published by P. Blaha, K. Schwarz, P. Sorantin, and S. B. Trickey, Comput. Phys. Commun. 59, 399 (1990).
- [32] K. Koepernik and H. Eschrig, Phys. Rev. B 59, 1743 (1999).
- [33] J. P. Perdew and Y. Wang, Phys. Rev. B45, 13244 (1992).
- [34] J. P. Perdew et al., Phys. Rev. B 46, 6671 (1992); J. P. Perdew, K. Burke, and M. Ernzerhof, Phys. Rev. Lett. 77, 3865 (1996).
- [35] T. Tanaka, Y. Ishikawa, E. Bannai and S. Kawai, Solid State Commun. 26, 879 (1978). See also W. Gordon and S. B. Soffer, J. Phys. Chem. Solids 36, 627 (1975).
- [36] Y. Ishizawa and T. Tanaka, Inst. Phys. Conf. Ser. No. 75, 29 (1986). Note that the branch of the dHvA data in Fig. 8 is plotted incorrectly, based on presentation of the same data in their Table 2 as well as in Ref.[35].
- [37] Y. Ishikawa and T. Tanaka, Inst. Phys. Conf. Ser. No. 75, 29 (1986).
- [38] T. Tanaka and Y. Ishikawa, AIP Conf. Proc. 231, 46 (1991).
- [39] H. Ihara, M. Hirabayashi, and H. Nakagawa, Phys. Rev. B 16, 726 (1977).
- [40] D. L. Johnson, B. N. Harmon, and S. H. Liu, J. Chem. Phys. 73, 1898 (1980).
- [41] V. M. Anishchik and N. N. Dorozhkin, Phys. Stat. Solidi B 160, 173 (1990).
- [42] A. C. Switendick, AIP Conf. Proc. No. 231, 54 (1991).
- [43] I. R. Shein and A. L. Ivanovskii, cond-mat/0109445.
- [44] Y. S. Tyan, L. E. Toth, and Y. A. Chang, J. Phys. Chem. Solids 30, 785 (1969).
- [45] H. Rosner et al., unpublished.
- [46] P. Vajeeston, P. Ravindran, C. Ravi, and R. Asokamani, Phys. Rev. B 63, 045115 (2001).
- [47] K. Winzer et al. (unpublished).
| Orbit | Fexp | Fcalc | |
|---|---|---|---|
| (0001) | 1.81 | 1.84 | -0.38 |
| (0001) | 2.46 | 2.43 | -0.60 |
| (0001) | 2.84 | 2.92 | -0.41 |
| (0001) | 6.09 | 6.78 | 0.51 |
| 0.300 | 0.305 | 0.103 |
| Orbit | Fcalc | Fexp | |||
|---|---|---|---|---|---|
| 0.78 (0.79) | 0.54 | -0.25 | 0.57 | 1.3 | |
| 1.65 (1.67) | -0.57 | ||||
| 34.5 | 1.87 | ||||
| 1.83 (1.81) | 1.53 | -0.31 | 0.70 | 1.3 | |
| 3.45 (3.46) | -0.64 | ||||
| 30.6 | -0.93 | ||||
| 0.45 | -0.25 | ||||
| 3.03 | 2.69 | 0.32 | 0.47 | 0.5 |