Defect structures and torque on an elongated colloidal particle immersed in a liquid crystal host
Abstract
Combining molecular dynamics and Monte Carlo simulation we study defect structures around an elongated colloidal particle embedded in a nematic liquid crystal host. By studying nematic ordering near the particle and the disclination core region we are able to examine the defect core structure and the difference between two simulation techniques. In addition, we also study the torque on a particle tilted with respect to the director, and modification of this torque when the particle is close to the cell wall.
pacs:
61.30.Cz, 61.30.Jf, 61.20.Ja, 07.05.TpI Introduction
Colloidal dispersions of small particles in nematic liquid crystals are a novel type of soft matter. Topological defects Lubensky et al. (1998); Stark (1999) and additional long-range forces between the colloidal particles Lev and Tomchuk (1999); Borštnik et al. (1999, 2000) are immediate consequences of the orientational ordering of the liquid crystal molecules. The nematic-induced interparticle interaction brings a new range of effects to the system: supermolecular structures Poulin et al. (1997); Poulin and Weitz (1998), cellular structures Anderson et al. (2001); Anderson and Terentjev (2001), and even a soft solid Meeker et al. (2000) can be observed. Colloidal dispersions in liquid crystals also have a wide variety of potential applications Russel et al. (1989).
The subject of this paper is the liquid crystal ordering and equilibrium orientation of an elongated solid particle inside a uniformly aligned nematic liquid crystal. On the list of problems one has to clarify are: (1) the nematic ordering around the particle (including possible topological defects); (2) the type and strength of the orientational coupling between the particle and its aligned molecular environment; (3) the effect of confinement on the orientational ordering of the particle, i.e. the equilibrium orientation of the particle close to the bounding surface. The solution to these problems is essential to understand the behavior of magnetic or nonmagnetic particles of colloidal size inherently present in biological liquid-crystalline tissues like cellular membranes. These problems also arise in ferroliquid crystals – the suspensions of single-domain ferroparticles in liquid crystals Brochard and de Gennes (1970).
The answer to the first question is known for spherical colloidal particles with homeotropic anchoring of the director at the particle surface Lubensky et al. (1998); Poulin et al. (1997); Poulin and Weitz (1998); Kuksenok et al. (1996); Shiyanovskii and Kuksenok (1998); Mondain-Monval et al. (1999); Ruhwandl and Terentjev (1997); Stark (1999, 2001). Isolated particles provide a spherical confining geometry for the liquid crystal. Sufficiently strong homeotropic anchoring induces a hedgehog defect with topological charge . The total topological charge of the whole system is zero, and an additional defect must be created to compensate the radial hedgehog. Two types of defect are possible: a hyperbolic hedgehog with a topological charge , called a dipolar or satellite defect; or a strength disclination ring that encircles the spherical particle, called a quadrupolar or Saturn-ring defect. The dipolar (satellite) defect is a point defect, while the quadrupolar (Saturn ring) is a line defect. Theoretical and numerical work based on elastic theory Ruhwandl and Terentjev (1997); Stark (1999), as well as computer simulation Billeter and Pelcovits (2000); Andrienko et al. (2001) , suggests that the dipole configuration is stable for micron-sized droplets. It is the one usually realized experimentally. The Saturn-ring defect appears if the droplet size is reduced or an external field is applied Gu and Abbott (2000); Loudet and Poulin (2001).
The same topological arguments are applicable for a non-spherical colloidal particle with homeotropic anchoring of the director at the particle surface. For an elongated particle with length and transverse size , and both and much greater than the dimensions of the molecules of the liquid crystal, one can have a disclination line of strength , a pair of disclination lines of strength , as well as the ‘escaped radial’ structure, in which the director bends over to become perpendicular to the particle surface Burylov and Raikher (1994).
However, from the energetic point of view, the situation is different from the case of the spherical particle. For the elongated particle, both defects are disclination lines. The elastic energy per unit length associated with a disclination of strength is , where is the size of the sample and is a lower cutoff radius (the core size) Stephen and Straley (1974). This means that the free energy of a pair of disclinations is always smaller than that of a single disclination. Therefore, one can expect that the pair of disclinations will always be a stable configuration. In principle, the defect can still form a metastable state.
The answer to the second question is not known even in the framework of phenomenological (continuum) theory Burylov and Raikher (1994). The results of the theory only indicate that, depending on the type and strength of anchoring, the equilibrium position of the particle may be either parallel or perpendicular to the liquid crystal director. The parameter governing the situation is the ratio of the particle radius to the extrapolation length of the nematic liquid crystal.
Obtaining an analytical expression for the torque (or elastic free energy) at arbitrary tilt angle seems to be hardly possible due to the loss of symmetry of the director distribution and the presence of defects. Qualitative analysis shows that the proper argument for the free energy should be since the problem is bilinear in both the unperturbed director orientation and the unit vector along the symmetry axis of the rod, . A simple form of the free energy angular dependence has been proposed in Ref. Burylov and Raikher (1994)
| (1) |
which gives a dependence for the torque and predicts that the director response has a maximum at and is absent at . However, it is clear that eqn (1) is oversimplified. The defect structure changes while the particle rotates. The nematic ordering evolves in a complicated way that can hardly be approximated with a dependence of the torque. At the same time, this dependence is vital for a macroscopic description of the system which treats coupling of colloidal particles with the nematic host via an effective potential.
Recently, the effect of confinement on the orientation of an anisotropic colloidal particle has been predicted Roth et al. (2002). It has been shown that there is an ‘entropic’ torque on a hard rod-like particle dissolved in a solution of hard spheres when the rod is positioned close to the hard wall. The torque appears because of the density modulation of spheres near the wall and depletion forces between the wall and the hard rod. This torque might play an important role in the ‘key-lock’ principle in biological systems and provide an understanding of how a non-spherical ‘key’ macromolecule can adjust its position and orientation near the ‘lock’ macromolecule. We, therefore, expect the torque on the particle close to the wall to be different from the bulk-induced torque because of the additional, entropic contribution.
In this paper, we present the results of molecular dynamics (MD) and Monte Carlo (MC) simulations of the topological defects that appear in the nematic mesophase around an elongated colloidal particle. Using the MD technique, we also study the force and the torque on the particle suspended in the bulk of the nematic mesophase and the modification of this torque when the particle is close to the cell substrate.
The paper is organized as follows. In section II we present the computational details and molecular models we use to simulate the liquid crystal mesophase and the interaction of the molecules with the particle surface and the cell substrates. Section III contains the results of the MD and MC simulations: density, director, order parameter maps, and order tensor profiles of the defects. Here we also present the results for the torque on the particle in the cell bulk and near the wall. Concluding remarks and comparison of the techniques are given in section IV.
II Molecular model and simulation methods
Figure 1 shows the geometry of a single particle in the cell. The rod shape is chosen to be a spherocylinder, i.e. a cylinder of length and diameter which has spherical caps of diameter . The particle is tilted in the plane. The orientation of the particle is specified by the angle between the axis and the symmetry axis of the cylinder.

II.1 Molecular dynamics
Molecular dynamics simulations were carried out using the soft repulsive potential, describing (approximately) ellipsoidal molecules
| (2) |
Here ; is the center-center separation, a size parameter, an energy parameter (both taken to be unity) and the orientation-dependent diameter is defined by
where , being the elongation. In this work we used throughout. The orientation dependence is written in terms of the direction of the center-center vector and the unit vectors , which specify the molecular symmetry axes. The potential (2) may be thought of as a variant of the standard Gay-Berne potential Berne and Pechukas (1972); Gay and Berne (1981) with exponents .
The systems consisted of particles. A reduced temperature was used throughout (for this model, the phase behavior is not sensitively dependent on temperature, as there are no attractive forces). The system size was chosen so that the number density of the liquid crystal far from the rod was . For this system, in the reduced units defined by , and , a timestep was found suitable. The molecular moment of inertia was fixed as . Periodic boundary conditions as well as slab geometry with walls confining the system in the direction were considered.
The interaction of molecule with the rod was given by a shifted Lennard-Jones repulsion potential having exactly the same form as eqn (2), but with replaced by . Here , where , is a unit vector along the symmetry axis of the rod, is the distance from the center of the rod to the center of the coordinates. In slab geometry the interaction with the walls was given by the same formula, eqn (2), replacing particle by the wall , setting and . represents an effective particle elongation as seen by the wall. We used which gives strong homeotropic orientation of the molecules at the wall Andrienko et al. (2001).
The radius and length of the rod were steadily increased from zero to the desired value during steps. Then the system was equilibrated for steps. During equilibration we scaled the velocities of the molecules to achieve .
The production run for every tilt angle of the rod was steps. The force and the torque on the rod were calculated using the repulsive force from the rod on the particle
| (3) |
II.2 Monte Carlo simulation
Monte Carlo simulations were based on the Lebwohl-Lasher (LL) lattice model Lebwohl and Lasher (1972). Within this model uniaxial nematic molecules (or, alternatively, close-packed molecular clusters Berggren et al. (1994)) are represented by ‘spins’ fixed on a cubic lattice of spacing . The spins are allowed to rotate freely, which reproduces the orientational behavior of the liquid crystal sufficiently well.
To define the topology of the colloidal particle, a ‘jagged’ cylinder of diameter was carved from the cubic lattice, with its long axis fixed along the axis of the coordinate system. The orientations of spins representing the particle were kept fixed during the simulation and were chosen in agreement with the desired boundary conditions at the particle surface, in our case homeotropic. At outer boundaries of the simulation box periodic boundary conditions were assumed. The total interaction energy for our model system consisting of nematic spins was calculated as
| (4) |
with and . Here denotes the unit vector giving the orientation of the spin located at the th lattice site. The sum in eqn (4) is taken over nearest neighbors only. The constants represent the interaction strengths and are denoted by and for nematic-nematic and nematic-solid particle interactions respectively.
The simulation box size was set to , which for the chosen cylinder diameter () amounts to 24600 nematic spins and to 840 spins representing the surface of the solid particle. Our simulations started from a configuration with a random orientation of nematic spins. The final results did not depend on the choice of the starting configuration.
The standard Metropolis scheme Metropolis and Ulam (1949) was then employed to update nematic spin orientations Fabbri and Zannoni (1986); Barker and Watts (1969), maintaining a rejection ratio close to 0.5. The system was equilibrated during MC cycles. After this successive spin configurations were accumulated and used as input for the calculation of order tensor.
In the simulation, temperature was set to , which ensures the existence of the nematic phase (note that for a bulk sample the LL model exhibits a nematic-isotropic transition at Fabbri and Zannoni (1986)). The strengths of nematic-nematic and nematic-solid particle interactions were set equal, , which corresponds to the strong anchoring regime with the extrapolation length of the order of a few lattice spacings Priezjev and Pelcovits (2000).
II.3 Order tensor
For both techniques, the local order tensor was calculated
| (5) |
where there are molecules present in each bin, is the Kronecker delta, denotes an ensemble average, . Note that in the MC case we have (bins correspond to lattice points) and that averaging is performed over MC cycles only. Diagonalizing the tensor, for each bin, gives three eigenvalues, , , and , plus the three corresponding eigenvectors. The eigenvalue with the largest absolute value defines the order parameter for each bin. The biaxiality is then calculated as the absolute value of the difference between the remaining two eigenvalues of the order tensor .
III Simulation results and discussion
III.1 Defect structure
We started our simulations with a rod of infinite length, , positioned along the axis, normal to the director. In this case the director rotates in the plane and we effectively have a two-dimensional situation.
III.1.1 MC results
Fig. 2 shows the director field and the order parameter map, in the plane perpendicular to the long axis of the colloidal particle.
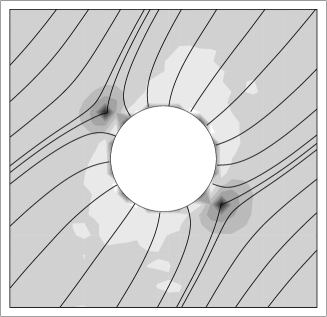
As concluded from topological considerations, either a strength disclination line or a pair of lines can form in the neighborhood of the particle. The line, however, does not seem to be stable and splits into a pair of lines during the MC evolution, even if it is taken as initial configuration in the simulation run. This behavior agrees with simple estimates of defect line free energies. Moreover, a stable ‘escaped radial’ structure was also not observed in our simulations. In MC simulations the pair of defect lines always forms close to one of the simulation box diagonals although the cross section of the colloidal particle is axially symmetric (ignoring its jagged shape); see the director field shown in Fig. 2. This symmetry breaking may be attributed to two effects of different origin. The first one (and, according to our tests, the more important one) is the repulsion between defects maximizing the defect-to-defect distance (recall the periodic boundary conditions), while the second one is a finite-size effect originating from collective fluctuations, resulting in a tendency to align the nematic along the simulation box diagonal Braun and Viney (2001). We believe, however, that these phenomena, as well as the presence of the colloidal particle, do not considerably affect any of the qualitative features characterizing the disclination line inner structure. Moreover, the presence of the colloidal particle is reflected only in an enhancement of the degree of nematic order in the immediate surroundings of the particle. The inner structure of a defect line is further characterized by variations in order tensor components, , , and , obtained after diagonalization of the order tensor , eqn (5). This is the most convenient way of describing the structure of the defect, because of the possible biaxiality and negative values of the uniaxial order parameter in the core region.
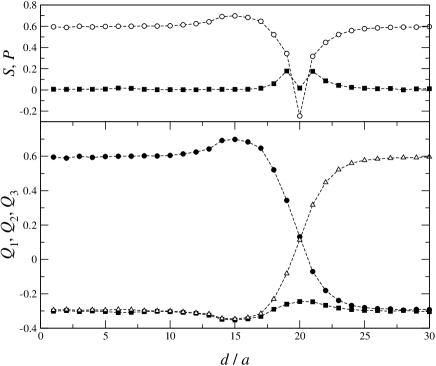
Fig. 3 shows the , , and profiles plotted along the axis through the left of the two disclinations shown in Fig. 2. In Fig. 3 the disclination is located at . Note that the left-right assymetry of the profiles with respect to the defect position is caused solely by the presence of the colloidal particle. As shown by Fig. 3, the component changes from its positive bulk value (), coinciding with the value of the order parameter ) to some negative value () after passing through the disclination. At the same time, the component increases from a negative value () to a large positive value (), which roughly equals twice the absolute value of the negative one. This behavior is attributed to the director rotation by approximately when we cross the defect along the axis; see Fig. 2. On the other hand, the value of the component does not change too much, indicating that the variation in the nematic ordering mostly occurs in the plane, perpendicular to the symmetry axis of the particle. Alternatively, , , and profiles can be interpreted also in terms of order parameters and (see Fig. 3, upper panel). When the defect line is approached, the uniaxial order parameter decreases from its temperature-defined bulk value and drops even below zero in the defect center. Note that there the nematic director, i.e., the eigenvector corresponding to the negative eigenvalue, is directed along the long axis of the solid particle. On the other hand, the biaxiality – close to zero far enough from the defect – increases when the defect line is approached, reaches a maximum and, finally, in the very center of the defect, again drops to a value which is close to zero. The characteristic length scales for these variations are of the order of a few () lattice spacings and agree with the estimates for the correlation length in the nematic phase Fabbri and Zannoni (1986).
Qualitatively, molecular ordering close to a disclination line can be summarized as follows. In the very center of the defect molecular ordering is uniaxial with and . Far enough from the defect line the nematic liquid crystal is uniaxial again, however, with and , as expected in a homogeneous or in a weakly distorted bulk sample. In the intermediate ring-like region, nematic ordering is biaxial with . These conclusions agree also with results from alignment tensor-based phenomenological analyses of topological defects both of half-integer Schopohl and Sluckin (1987) and integer strength Sonnet et al. (1995).
III.1.2 MD results
As has already been mentioned, the configuration with two disclination lines is more energetically favorable than a single strength disclination. We noticed this performing the molecular dynamics simulation: for all studied diameters of the rod () the strength disclination appears immediately after expanding the colloid particle in the nematic state. However, during the equilibration, it splits into two disclination lines which then move towards the equatorial plane. The evolution dynamics is quite slow, one needs about steps for the disclinations to reach the equator. We were not able to observe ‘escaped radial’ configuration, probably due to the small size of the colloidal particle.
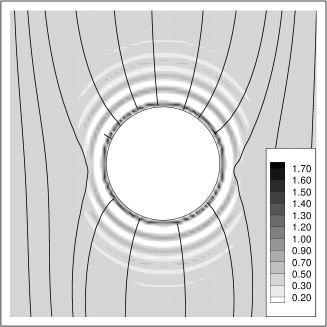
A typical director map together with the density map is shown in Fig. 4. The bulk density, , is slightly different from the number density, , because of the volume taken by the rod. In the direction of the disclinations the density modulation, typical for a nematic-wall interface, vanishes due to partial melting of the liquid crystal in the disclination core region. This melting damps the influence of the droplet surface on the interface region.
Two disclinations are located very close to the droplet surface and the director distortion vanishes very quickly in the liquid crystal bulk. The core region extends over a few molecular lengths. In MD simulations, the pair of defect lines forms perpendicular to the director. Since we use the director constraint algorithm Germano (2001), the director far from the particle is aligned along the axis, contrary to the situation with MC simulation results, where the director is along the box diagonal. The director constraint damps the effects of the defect repulsion and effective fluctuation of the director.
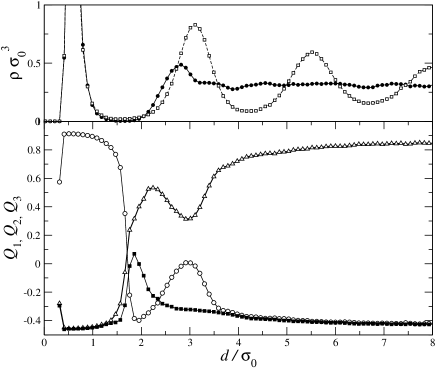
To emphasize the complex structure of the defect core we plot the order tensor components , , , after diagonalizing the local order tensor, eqn (5), in Fig. 5. Qualitatively, the order tensor has the same look as in MC simulations: the nematic phase is uniaxial far from the core and biaxial in the core region, with variation of the biaxiality across the core. However, MD results predict a more complicated structure of the core region, attributed to the liquid crystal density oscillation near the particle surface (see Fig. 4 and Fig. 5, upper panel). The variation of the order tensor components is given by the superposition of the nematic order variation due to the density modulation and intrinsic variation due to the presence of the defect.
III.2 Torque on the particle
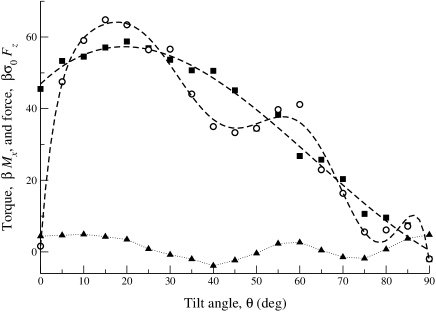
To measure the torque on the rod of finite length, we performed MD simulations in a box with periodic boundary conditions, applying a global constraint for the director along the axis Germano (2001). An independent measurement was performed in slab geometry. In the slab geometry, the director orientation far from the rod was fixed by the confining walls. The walls provided strong homeotropic (along the axis) anchoring of the director. The rod was fixed either in the center of the simulation box or at some distance from the bottom wall. () corresponds to a torque which tends to align the rod perpendicular (parallel) to the director far from the particle, .
The torque on the rod, calculated using eqn (3), is presented in Fig. 6. Results presented in Fig. 6 indicate that the dependence of the torque on the rod tilt angle is far from the , proposed in Burylov and Raikher (1994). Moreover, the torque is not equal to zero for , i.e. there is some symmetry breaking and the orientation of the rod along the director is not even metastable.
For better understanding, a slice in the plane is shown in Fig. 7, for different tilt angles of the rod. Fig. 7a shows that the director distribution around the rod is not axially symmetric. This is the reason for the non-zero torque for . Strong director variations near the rod are responsible for the large value of the torque. As the rod rotates, the director field becomes less and less frustrated, Fig. 7b, and finally we have a stable orientation of the rod perpendicular to the director, Fig. 7c.
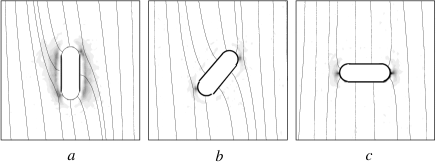
In principle, the configuration with axial symmetry is also possible, when the rod is along the axis. However, we were not able to observe it in our simulations even when disordered, isotropic configurations containing the colloidal particle were compressed to the ordered, nematic state. This method, in principle, gives the lowest free-energy configurations in an unbiased way.
In Fig. 6 we also present the torque and the force on the particle near the wall. Besides the torque on the particle because of the average molecular orientation of the liquid crystal host, there is an effective interaction between the particle and the wall. The presence of this depletion-like interaction can be understood as a result of interactions between the particle and the liquid crystal molecules which themselves interact with the wall. In other words, if the volume close to both the wall and the particle overlap, then the host liquid gains accessible volume and can increase its entropy. To show that the depletion force is responsible for this ‘entropic’ contribution to the torque, we plot the depletion force in Fig. 6. The correlation between the change in the depletion force and the change in the torque is evident. As the rod moves closer to the wall the value of the ‘entropic’ torque increases and can even affect the equilibrium position and orientation of the particle.
For the parameters used in our simulation, the contribution of the ‘entropic’ torque only modifies the dependence of the total torque on the particle tilt angle. However, this contribution can dominate, for example, when the system is close to the nematic-isotropic transition. Then the colloidal particle might have a tilted orientation when approaching the wall. Further work on these aspects is in progress.
IV Conclusions
We used molecular dynamics and Monte Carlo techniques to study a small elongated colloidal particle suspended in a nematic liquid crystal. Homeotropic boundary conditions and strong anchoring create a hedgehog defect on the particle surface. We have studied the defect structure around the particle that cancels this hedgehog defect.
Our simulation results show that, in the case of a very long particle, with transverse size much less than its length, a configuration with two defects is stable. An initial configuration with one strength disclination evolves spontaneously into two disclination lines. For a particle with transverse size of the order of its length, the ring defect encircling the particle was found to be stable. The orientation of the ring changes as the particle tilts with respect to the director. Using order tensor and density maps we are able to resolve the structure of the core of the defect: the nematic phase is strongly biaxial near the defect core.
Comparing the structure of the disclination core obtained using molecular dynamics and Monte Carlo simulation techniques we are able to study influence of the density modulation of the mesophase in the core region.
We have also studied the torque on a particle tilted with respect to the director at large distances from a wall, and modification of this torque when the particle is close to the wall. Our results show, that the dependence of the torque on the tilt angle is complex, and does not vanish even when the particle is along the director. Analysis of the director distribution around the particle shows that this is due to the broken axial symmetry of the director distribution around the particle. In addition, when the particle is close to the wall, the torque is modified because of the depletion-like interaction of the particle with the wall.
Acknowledgements.
This research was supported by EPSRC grants GR/L89990, GR/M16023, through INTAS grant 99-00312, and by the Ministry of Science and Technology of Slovenia (Grant No. J1-7470). MD simulations used the GBMEGA program of the ‘Complex Fluids Consortium’ with computer time allocated at the Edinburgh Parallel Computer Center and the CSAR facility. D.A. acknowledges the support of the Overseas Research Students Grant; M.P.A. is grateful to the Alexander von Humboldt foundation, the British Council ARC program, and the Leverhulme Trust. G.S. thanks P. Pasini, C. Zannoni, and C. Chiccoli for the training in MC simulation techniques.References
- Lubensky et al. (1998) T. C. Lubensky, D. Pettey, N. Currier, and H. Stark, Phys. Rev. E 57, 610 (1998).
- Stark (1999) H. Stark, Euro. Phys. J. B 10, 311 (1999).
- Lev and Tomchuk (1999) B. I. Lev and P. M. Tomchuk, Phys. Rev. E 59, 591 (1999).
- Borštnik et al. (1999) A. Borštnik, H. Stark, and S. Žumer, Phys. Rev. E 60, 4210 (1999).
- Borštnik et al. (2000) A. Borštnik, H. Stark, and S. Žumer, Phys. Rev. E 61, 2831 (2000).
- Poulin et al. (1997) P. Poulin, H. Stark, T. C. Lubensky, and D. A. Weitz, Science 275, 1770 (1997).
- Poulin and Weitz (1998) P. Poulin and D. A. Weitz, Phys. Rev. E 57, 626 (1998).
- Anderson et al. (2001) V. J. Anderson, E. M. Terentjev, S. P. Meeker, J. Crain, and W. C. K. Poon, Eur. Phys. J. 4, 11 (2001).
- Anderson and Terentjev (2001) V. J. Anderson and E. M. Terentjev, Eur. Phys. J. 4, 21 (2001).
- Meeker et al. (2000) S. P. Meeker, W. C. K. Poon, J. Crain, and E. M. Terentjev, Phys. Rev. E 61, R6083 (2000).
- Russel et al. (1989) W. Russel, D. Saville, and W. Schowalter, Colloidal dispersions (Cambridge University Press, Cambridge, 1989).
- Brochard and de Gennes (1970) F. Brochard and P. G. de Gennes, J. Phys 31, 6911 (1970).
- Kuksenok et al. (1996) O. V. Kuksenok, R. W. Ruhwandl, S. V. Shiyanovskii, and E. M. Terentjev, Phys. Rev. E 54, 5198 (1996).
- Shiyanovskii and Kuksenok (1998) S. V. Shiyanovskii and O. V. Kuksenok, Mol. Cryst. Liq. Cryst. 321, 489 (1998).
- Mondain-Monval et al. (1999) O. Mondain-Monval, J. C. Dedieu, T. Gulik-Krzywicki, and P. Poulin, Euro. Phys. J. B 12, 167 (1999).
- Ruhwandl and Terentjev (1997) R. W. Ruhwandl and E. M. Terentjev, Phys. Rev. E 56, 5561 (1997).
- Stark (2001) H. Stark, Physics Reports 351, 387 (2001).
- Billeter and Pelcovits (2000) J. L. Billeter and R. A. Pelcovits, Phys. Rev. E 62, 711 (2000).
- Andrienko et al. (2001) D. Andrienko, G. Germano, and M. P. Allen, Phys. Rev. E 63, 041701 (2001).
- Gu and Abbott (2000) Y. Gu and N. L. Abbott, Phys. Rev. Lett. 85, 4719 (2000).
- Loudet and Poulin (2001) J. C. Loudet and P. Poulin, Phys. Rev. Lett. 87, 165503 (2001).
- Burylov and Raikher (1994) S. V. Burylov and Y. L. Raikher, Phys. Rev. E 50, 358 (1994).
- Stephen and Straley (1974) M. Stephen and J. Straley, Rev. Mod. Phys. 46, 617 (1974).
- Roth et al. (2002) R. Roth, R. van Roij, D. Andrienko, K. R. Mecke, and S. Dietrich (2002), cond-mat/0202443.
- Berne and Pechukas (1972) B. J. Berne and P. Pechukas, J. Chem. Phys. 56, 4213 (1972).
- Gay and Berne (1981) J. G. Gay and B. J. Berne, J. Chem. Phys. 74, 3316 (1981).
- Lebwohl and Lasher (1972) P. A. Lebwohl and G. Lasher, Phys. Rev. A 6, 426 (1972).
- Berggren et al. (1994) E. Berggren, C. Zannoni, C. Chiccoli, P. Pasini, and F. Semeria, Phys. Rev. E 50, 2929 (1994).
- Metropolis and Ulam (1949) N. Metropolis and S. Ulam, J. Amer. Stat. Ass. 44, 335 (1949).
- Fabbri and Zannoni (1986) U. Fabbri and C. Zannoni, Molec. Phys. 58, 763 (1986).
- Barker and Watts (1969) J. A. Barker and R. O. Watts, Chem. Phys. Lett. 3, 144 (1969).
- Priezjev and Pelcovits (2000) N. Priezjev and R. A. Pelcovits, Phys. Rev. E 62, 6734 (2000).
- Braun and Viney (2001) F. Braun and C. Viney, Phys. Rev. E 63, 031708 (2001).
- Schopohl and Sluckin (1987) N. Schopohl and T. J. Sluckin, Phys. Rev. Lett. 59, 2582 (1987).
- Sonnet et al. (1995) A. Sonnet, A. Kilian, and S. Hess, Phys. Rev. E 52, 718 (1995).
- Germano (2001) G. Germano (2001), in preparation.