Simulational studies of axial granular segregation in a rotating cylinder
Abstract
Discrete particle simulation methods have been used to study axial segregation in a horizontal rotating cylinder that is partially filled with a mixture of two different kinds of granular particles. Under suitable conditions segregation was found to occur, with the particles separating into a series of bands perpendicular to the axis. In certain cases the band structure exhibited time-dependent behavior, including band formation, merging and motion along the axis, all corresponding to phenomena that arise experimentally. In order to examine how the many parameters specifying the problem affect the segregation process, simulation runs were carried out using a variety of parameter settings, including combinations of friction coefficients not realizable experimentally. Both segregation and desegregation (mixing) were investigated, and cylinders with both explicit end caps and periodic ends were used to help isolate the causes of segregation.
pacs:
45.70.Mg, 45.70.Qj, 64.75.+g, 02.70.NsI Introduction
The properties of granular media are often very different from systems governed by thermodynamics and statistical mechanics, and the intuition gained from these theories proves to be of little help in trying to understand the mechanisms responsible for granular behavior. The propensity of noncohesive granular mixtures to segregate into individual species is one of the more conspicuous of these properties, and the fact that segregation occurs even when then there is no apparent energetic or entropic advantage is what makes such behavior so fascinating. Since mixing and segregation are important processes, both in industry and in nature, considerable effort has been invested in exploring the underlying causes of these phenomena. In the absence of a general theory of granular matter, much of the work in this field Barker (1994); Herrmann (1995); Jaeger et al. (1996); Kadanoff (1999) has been, and continues to be based on computer simulation.
Segregation of polydisperse granular mixtures occurs in a variety of situations, including sheared flow Walton (1983); Hirshfeld and Rapaport (1997), vibration Rosato et al. (1987); Gallas et al. (1996), and rotation Cantelaube and Bideau (1995); Levine et al. (1994); in the most familiar form of rotation, involving a horizontal cylinder rotating about its longitudinal axis, there are two modes of segregation, one radial, the other axial. Although other forms of segregation have been explored using discrete-particle simulations, the case of axial segregation in a cylinder, with the exception of a very limited study Shoichi (1998), has not been a subject of detailed investigation.
The typical experiment employs a transparent horizontal cylinder with a circular cross section, partially filled with a mixture of two kinds of granular particles, and rotating at a constant rate. While the most direct observations focus on the composition of the visible surface layer Levine et al. (1994), more elaborate studies involve probing the interior using magnetic-resonance imaging (MRI) techniques Hill et al. (1997a, b). Under suitable conditions the system is observed to segregate into bands of alternating composition normal to the cylinder axis. Segregation, as seen from the outside, may be so thorough that each band is composed exclusively of a single particle species, with narrow transition regions separating the bands; segregation may also be only partial, in the sense that the bands are characterized by just a higher concentration of one species or the other. Beneath the surface, segregation in the radial direction is also possible; in certain instances the effects visible at the outer surface are in fact due to an axial core of one species whose shape undulates along the axis, and the observed bands are a consequence of this core intermittently extending to the outer surface Hill et al. (1997b). The band patterns can also exhibit time dependence; examples of such behavior involve coarsening, in which narrower bands merge (sometimes very slowly) to form broader patterns Frette and Stavans (1997), and the appearance of traveling wave patterns associated with band motion Choo et al. (1997, 1998). The foregoing, partial catalog of observations combines experimental results conducted under different conditions with a variety of granular materials; there is currently no single set of experiments providing systematic coverage of the dependence on the many parameters contributing to the definition of the system.
The goal of the simulations reported in this paper is a systematic analysis of certain aspects of the axial segregation problem, based on a molecular dynamics approach involving discrete-particle models, making reference to experiment where results are available. The model used here is of a kind routinely employed for simulating granular flow phenomena. The degree to which such models prove capable of reproducing the behavior of real granular media provides the ultimate validation of this approach.
II Background
Recent attempts at understanding axial segregation in a rotating horizontal cylinder began with a series of experimental studies Levine et al. (1994) that considered two types of mixtures, glass spheres and sand, and glass spheres of mixed sizes. In experiments that started with a homogeneous binary mixture, bands were observed to appear only for the glass-sand mixture, suggesting that different particle sizes alone is not enough to produce segregation, but that different degrees of roughness are required as well; it was also suggested that segregation required the rough particles to be smaller than the smooth. Bands of various widths typically developed after about 100 rotations; the narrowest bands subsequently disappeared, leading eventually to a steady state characterized by bands with a narrow distribution of widths. The importance of particle flow at the upper free surface was established by noting that segregation ceased when this flow was obstructed. Further conclusions were that segregation is not initiated at the cylinder ends but is in fact driven by concentration fluctuations, and the importance of the fact that the free surface has a characteristic curved shape rather than being flat. Other experiments Hill et al. (1997b) also considered glass sphere mixtures of different sizes and were able to achieve axial segregation; the discrepancy between these two experiments, presumably a consequence of other differences in the experimental conditions, has not been addressed. Further information concerning the early experimental history of this phenomenon is to be found in Refs. Hill et al. (1997b) and Stavans (1998).
The effects visible at the surface provide an incomplete description of the behavior. Use of MRI Hill et al. (1997a, b) facilitated examination of the interior, in terms of both axial and radial cross sections, allowing the possible role of subsurface dynamics to be examined. A mixture of plastic spheres and (smaller) MRI-sensitive pharmaceutical pills was used in these experiments. Even when segregation bands were observed at the surface, beneath the surface the small particles were found to be present along the entire length of the cylinder, and the appearance of bands of small particles at the surface merely corresponded to a thickening of this interior region; once the presence of the undulating axial core was discovered, band merging appears to be a less dramatic event than would otherwise be the case. Another MRI study Nakagawa et al. (1997), in which both particle sizes were visible, found the axial core of small particles to be a transient structure that eventually disappeared, resulting in a state of complete axial segregation. MRI has also been used in the study of the development of the interface between initially segregated species Ristow and Nakagawa (1999).
Another aspect of axial segregation, namely the appearance of patterns that travel along the cylinder in an axial direction, is described in Ref. Choo et al. (1997, 1998), using a mixture of sand and salt grains of different sizes. Only the behavior at the outer surface (both the free surface and the exterior surface in contact with the transparent cylinder wall) was examined, and a preferred wavelength was found that was almost independent of rotation rate. In these experiments, the particle sizes extended over broad, but nonoverlapping distributions, and the traveling waves were found to occur only for certain volume fractions; furthermore, if the salt grains were replaced by rounded sand particles of similar size no traveling waves appeared. Details of various types of band motion and coarsening in a mixture of sand and glass spheres are reported in Ref. Frette and Stavans (1997); the results suggest that avalanches play an important role, and that the surface transport consists mainly of the glass spheres moving across the sand, rather than the converse. Extensions of the basic problem have also been considered, for example, cylinders with axially modulated radius Levine et al. (1994), and cylinders with noncircular cross-section Hill et al. (2001).
Given the complexity of the experimental situation it is hardly surprising that theoretical progress has been limited. The experimental results in Ref. Levine et al. (1994) were accompanied by a simplified theory that dealt with the onset of instability produced by local concentration fluctuations, and the response to resulting changes in the angle of repose (as reflected, for example, in the appearance of a bump where the granular surface meets the ascending wall of the cylinder, and a depression at the opposite descending wall); homogeneity of the cross-sectional composition within each band was assumed, something subsequent MRI results failed to support. Continuum models have been developed based on one-dimensional systems Aranson and Tsimring (1999); Aranson et al. (1999) in which the dynamical variables are the local concentration difference and the slope of the free surface; while such models are able to describe the early phase of segregation with traveling bands and subsequent band merging, important three-dimensional aspects of the problem are absent and, contrary to experiment, the free surface profile is assumed linear. The problem has also been studied using a simplified cellular automata model Yanagita (1999), again assuming that the key to the behavior is what happens at the free surface.
There is just one existing molecular dynamics (MD) study of axial segregation Shoichi (1998). The system considered is small, only 1000 particles, and contained in a relatively short cylinder, with behavior dominated by the end walls, and no provision for rotation of the particles themselves. Partial segregation was observed (the formation of two bands in which one of the species had a higher concentration, separated by a single band dominated by the other), but only if the bigger particles were the rougher ones, the opposite of the criterion in Ref. Levine et al. (1994); different degrees of roughness but just a single particle size failed to produce segregation. There is another, related MD study Ristow (1999) that does not address segregation directly, but treats what amounts to the converse problem, namely axial diffusion at the interface between initially segregated species. Another kind of segregation can occur at comparatively low rotation rates, this time radially, in which small particles tend to migrate inwards leaving a higher concentration of big particles on the outside; this has been modeled in two dimensions Dury and Ristow (1997).
Despite the brevity of the above survey, it is abundantly clear that while significant results have been obtained that help explain some aspects of axial segregation, there is much that remains unresolved, both in regard to what actually occurs in the system and the mechanisms underlying the phenomenon, a conclusion also expressed in Ref. Stavans (1998). It has yet to be established whether there is just a single kind of axial segregation phenomenon, or whether different kinds of granular materials undergo segregation by invoking alternative mechanisms; it is indeed possible that a number of processes operate concurrently, with the dominant one being determined by the prevailing experimental conditions. It goes without saying that the current state of experiment limits the ability to determine how accurately simulation represents reality; further experimental evidence clearly needs to be obtained.
III Granular model
A variety of models have been employed in granular simulation, based on both soft Cundall and Strack (1979); Walton (1983); Haff and Werner (1986) and hard Campbell (1990) particles; though referred to as “soft”, this characterization applies more to the continuous nature of the potential function used to oppose particle overlap during collision than to the amount of overlap itself, which is minimal. Soft particles are used more widely (including here) because of the simpler nature of the computations involved. In addition to this excluded-volume repulsion force, the particles are also subject to dissipative forces. The interactions fall into two classes, those between pairs of particles, and those between the particles and the container walls, which, as will be shown below, can be treated as special cases of particle-particle interactions. The discussion of the model begins with the excluded-volume force.
Consider a pair of spherical granular particles and with diameters and , respectively. The repulsive force that acts between particles closer than a specified range Hirshfeld and Rapaport (2001) is
| (1) |
where is the particle separation, , and the effective diameter entering the interaction computations is . This force is derived from the functional form of the Lennard-Jones potential; it acts whenever and is continuous at the cutoff point (although its derivative is not). Alternatives to this form of overlap interaction that are also in routine use include functions that depend on the overlap either linearly or to the 3/2-power Schäfer et al. (1996), but the choice of function is of little consequence as far as the bulk behavior is concerned Rapaport (2001). Note that because of the slight degree of softness, particle diameter is not precisely defined.
What distinguishes the interactions used for granular media from those in MD studies of molecular systems is the presence of dissipative forces that act over the duration of each collision. The first of these is a normal (viscous) damping force
| (2) |
that depends on the component of the relative velocity of the particles in the direction between the particle centers. The factor is the normal damping coefficient, assumed to be the same for all particles. The total force parallel to is .
Frictional damping also acts in the transverse direction at the point of contact of the particles. The relative transverse velocity of the particle surfaces at this point, allowing for particle rotation, is
| (3) |
where is the angular velocity of particle . The sliding friction is then
| (4) |
Here, is the sliding friction coefficient, whose value depends on the species and of the particles involved. The static friction coefficient sets an upper bound to the sliding friction proportional to ; in models of this kind there is no true static friction (at best, e.g., Ref. Dury and Ristow (1997), it can be represented by a tangential restoring force that depends on the relative displacement occurring during contact, although it should be emphasized that this is not a strictly correct means for incorporating the effects of static friction).
The translational and rotational accelerations of the particles, and depend on sums of the above terms for all interacting pairs. Each such contribution is included by adding to the total , subtracting the same quantity from , and also subtracting from both and , where is the particle mass and the numerical factor in the moment of inertia (for a solid sphere ).
Similar considerations apply to the interactions between particles and container walls. While there are alternative methods for representing boundaries, for example, by constructing explicit rough boundaries out of (a large number of) constrained particles with properties similar to the mobile particles, or by treating them separately from the interactions by simply moving particles back inside if they are found to have crossed a boundary, the approach used here is based on walls represented by geometrically smooth surfaces with similar frictional properties to the particles themselves.
The curved cylinder wall is treated as follows, assuming the axis of the cylinder to be in the -direction. The value of associated with the wall is unity, so that replaces in the force calculations. To determine whether a particle lies within interaction range of the curved boundary evaluate ; the particle is in range if , where is the cylinder diameter. To evaluate the forces replace by and evaluate using Eq. (1). The velocity of the cylinder wall at the effective point of contact is , where is the cylinder angular velocity and is parallel to the direction of motion of the cylinder wall at the point of contact; thus the relative velocity corresponding to is . Evaluate using Eq. (2); the resulting contributes to . Evaluate the sliding velocity at the contact point, , and use this in an expression similar to Eq. (4) to compute the sliding friction,
| (5) |
which contributes to both and .
The cylinder ends can be periodic, if the goal is to avoid any spurious wall effects, or capped, using walls with the same frictional properties as the curved cylinder wall. In the latter case the wall contributions are computed as follows. First check whether the particle is in range of either of the end walls by evaluating , where is the cylinder length; if , where was defined above, then the particle is within range. In that case the calculation is as before, except that , whichever points towards the origin, and . Finally, the effect of gravity is included by subtracting from each , where is the gravitational acceleration.
Several friction coefficients appear in the model; some are fixed at a single value, while others are assigned a choice of values to examine their effect on the behavior. The normal damping coefficient is an example of the former, whereas the particle-particle (P-P) sliding friction coefficients for identical particles and , where and denote big and small particles, vary between runs, as do the particle-wall (P-W) coefficients and . For collisions involving mixed particle types, (an arithmetic or geometric average could also have been used). The relative values of the static friction coefficients and are set equal to the ratio of the corresponding values, with the larger of each pair having the fixed value 0.5. While the fact that the P-W friction coefficients are specified independently of the P-P coefficients allows situations that might be experimentally unrealizable, such flexibility might nevertheless contribute to learning more about the segregation mechanisms.
Other details of the simulation follow standard molecular dynamics procedure Rapaport (1995). Neighbor lists are used to organize the force computations efficiently. The translational and rotational equations of motion are integrated using the leapfrog method (there is no need to evaluate the rotational coordinates of the particles). Because of the heavy computations involved in some of the runs, parallel computing methods based on a spatial decomposition of the system were used to spread the workload across several coupled processors.
IV Simulation parameters
A substantial number of parameters are involved in specifying the system, and even after fixing some of them quite a few remain; in order to reduce the number of runs for different parameter combinations, typically just two values are considered for each parameter. What occurs for other parameter combinations will not be examined, but even the present selection offers a rich variety of phenomena; a more complete analysis of the multidimensional phase diagram will require substantial additional effort. Overall, there is a certain arbitrariness in many of the parameter settings, although well-separated pairs of values have been used; some parameters are of course constrained by the nature of the model and the demands of computational stability. Parameter combinations that hinted at more interesting behavior were studied in greater detail using larger systems and longer runs; with so many choices available, this is a reasonable criterion for an initial exploratory study.
The reduced units employed here are readily related to the corresponding physical units. If is the length unit (in m), then the corresponding time unit is s. For the value used here, the time unit becomes , where, for convenience, is now measured in mm. The real rotation frequency is Hz, so for 3 mm particles, the frequency in run #A would be 2 Hz, a reasonable experimental value. In addition, reduced units are implicit in Eq. (1) and in the definitions of the friction coefficients.
Most of the runs involve mixtures of particles with two diameters, nominally 1 and 1.3 (in reduced units), but a few treat particles of the same size. A size ratio of 1.3 is smaller than the ratios typically employed in experiment, usually in the range 2–4; the reason for this choice is computational convenience, since for a larger size ratio the number of particles in the simulation would have to be increased accordingly. In most cases the cylinder angular velocity is 0.5 (radian/unit-time), but a lower value of 0.1 is also used. Several values of cylinder length and diameter are included, with an aspect ratio (a number sometimes quoted in the experiments) ranging between 8:1 and 20:1. The initial state of each run consists of a cylinder uniformly filled with particles arranged as an FCC lattice with a specified number density ; varying allows the fill level of the cylinder to be adjusted. The initial particle velocities are random.
Several parameters are assigned a single value: the normal damping coefficient , gravitational acceleration , equal numbers of particles of either species, and a uniform random distribution of particle diameters in the narrow range , where is the nominal diameter of the species. The integration timestep is (in reduced units).
The initial state is either mixed or segregated, and the cylinder ends periodic or capped. The precise number of particles in the system (which determines the fill level for a given cylinder size) is determined by the packing density of the initial state (whose value in most cases is 0.3), and to a lesser degree by the boundary conditions and the nature of the initial state. The total number of particles in the runs reported here ranges from approximately 3,300 to 62,200, while the number of cylinder rotations covered by the simulation ranges from 500, adequate in some cases to establish that segregation (or mixing) occurs, to as many as 38,000 required for examining slow pattern evolution (since the number of integration timesteps per rotation is certain runs are quite long).
The selection of simulation runs described in the following section are listed in Table 1; the letter codes allow convenient referencing of the runs without the need to repeat the actual parameter settings. A variety of sliding friction coefficients are considered; the four separate coefficients are assigned values 2 or 10, but in different combinations, with no connection between the P-P and P-W values; the actual value combinations used appear in the table.
| Id111Runs are denoted in the text as, e.g., #A; runs shown in figures are starred. | Size222Cylinder length and diameter , initial filling density , total number of particles , big particle size , angular velocity . | Bdy333Cylinder end boundaries: periodic or capped. | Init444Initial state: mixed or segregated. | Friction555Values of for P-P and P-W interactions, for big and small particles. | Turns | Bands666Number of bands formed, if any (the space-time plots may lack the resolution to show rapidly changing transients, and not all transient features are regarded as bands). | ||||||||
| P,C | M,S | bb | ss | bw | sw | |||||||||
| A∗ | 128 | 16 | .3 | 4664 | 1.3 | .5 | P | M | 10 | 2 | 10 | 2 | 4.3 | 86 |
| B∗ | 128 | 16 | .3 | 4664 | 1.3 | .5 | P | M | 2 | 10 | 10 | 2 | 5.8 | 106 |
| C | 128 | 16 | .3 | 4664 | 1.3 | .5 | P | M | 2 | 2 | 10 | 2 | 0.5 | 8 |
| D | 128 | 16 | .3 | 4664 | 1.3 | .5 | P | M | 10 | 10 | 10 | 2 | 1.5 | 6 |
| E | 128 | 16 | .3 | 4664 | 1.3 | .5 | P | M | 10 | 2 | 10 | 10 | 1.1 | 8 |
| F | 128 | 16 | .3 | 4664 | 1.3 | .5 | P | M | 2 | 10 | 2 | 10 | 0.5 | - |
| G | 128 | 16 | .3 | 4664 | 1.3 | .5 | P | M | 2 | 2 | 2 | 10 | 0.6 | - |
| H | 128 | 16 | .3 | 4664 | 1.3 | .5 | P | M | 10 | 2 | 2 | 10 | 1.0 | - |
| I∗ | 256 | 16 | .3 | 9416 | 1.3 | .5 | P | M | 10 | 2 | 10 | 2 | 11.0 | 168 |
| J∗ | 256 | 24 | .3 | 27392 | 1.3 | .5 | P | M | 10 | 2 | 10 | 2 | 12.7 | 146 |
| K∗ | 256 | 24 | .3 | 27392 | 1.3 | .1 | P | M | 10 | 2 | 10 | 2 | 4.0 | 126 |
| L∗ | 128 | 16 | .3 | 4664 | 1.0 | .5 | P | M | 10 | 2 | 10 | 2 | 1.6 | 86 |
| M | 128 | 16 | .3 | 4664 | 1.0 | .5 | P | M | 2 | 2 | 10 | 2 | 3.5 | 2 |
| N | 128 | 16 | .3 | 4664 | 1.0 | .5 | P | M | 10 | 2 | 10 | 10 | 3.8 | 2 |
| P∗ | 128 | 16 | .4 | 7080 | 1.3 | .5 | P | M | 10 | 2 | 10 | 2 | 8.1 | 86 |
| Q | 128 | 16 | .5 | 9828 | 1.3 | .5 | P | M | 10 | 2 | 10 | 2 | 5.9 | 6 |
| R∗ | 128 | 16 | .3 | 4576 | 1.3 | .5 | C | M | 10 | 2 | 10 | 2 | 1.7 | 119 |
| S∗ | 320 | 16 | .3 | 11704 | 1.3 | .5 | C | M | 10 | 2 | 10 | 2 | 15.8 | 1911 |
| T | 320 | 32 | .3 | 62244 | 1.3 | .5 | C | M | 10 | 2 | 10 | 2 | 2.5 | 139 |
| U∗ | 320 | 16 | .3 | 11704 | 1.3 | .1 | C | M | 10 | 2 | 10 | 2 | 3.6 | 19 |
| V∗ | 128 | 16 | .3 | 3390 | 1.3 | .5 | P | S | 10 | 2 | 10 | 2 | 11.1 | 2 |
| W | 128 | 16 | .3 | 3390 | 1.3 | .5 | P | S | 10 | 10 | 10 | 10 | 3.9 | - |
| X | 128 | 16 | .3 | 3346 | 1.3 | .5 | C | S | 10 | 2 | 10 | 2 | 5.4 | 2 |
| Y∗ | 128 | 16 | .3 | 3346 | 1.3 | .5 | C | S | 10 | 2 | 10 | 10 | 38.0 | 2–6 |
V Analysis of results
V.1 Segregation in periodic containers
One of the advantages of the simulational approach is that it permits the realization of systems that are not readily constructed in the laboratory. In the present case, the use of periodic boundaries rather than hard caps at the cylinder ends can eliminate the possibility that segregation is due to end effects; if segregation is indeed a consequence of fluctuations that can appear anywhere, then axial periodicity provides the means of establishing this fact. Similarly, the available choices of friction coefficients provide flexibility unavailable experimentally.
The first system considered here, #A in Table 1, has , , and a total of particles; the aspect ratio . The sloping free surface that rapidly forms crosses the centerline of the tube approximately midway between the axis and the boundary (surface profile plots are shown later, in Fig. 9, for similar but larger systems). The ratio of big and small particle diameters is , the angular velocity is , the cylinder ends are periodic, and initially the two species are randomly mixed. The sliding friction coefficients are , , which means that the big particles are rougher than the small, both in their interactions with each other and with the curved cylinder wall. All this information is contained in Table 1 and will not be detailed in subsequent cases.
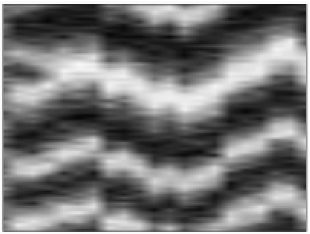
A condensed summary of the observed behavior over the entire run is most conveniently presented using a “space-time” plot showing local relative concentrations of the two species, in which the horizontal scale measures elapsed time and the vertical scale shows the position along the cylinder axis. The plot is an accumulation of snapshots taken at regular intervals (roughly every 80th rotation for this run); each such snapshot is represented by a narrow vertical strip in the figure and shows the relative concentration (weighted by particle volume) in a series of thin slices perpendicular to the rotation axis, with the shading indicating the actual value, ranging from dark for a pure band of small particles, to light for a band of big particles; gray values (not many appear here because the results focus on cases with successful segregation) indicate mixtures (without revealing any information about what occurs in the radial direction). All plots are of the same size, regardless of run duration and cylinder length; the size of a single “pixel” in each plot is inversely proportional to these two quantities. The space-time plots used here, though visually similar to those in experimental studies Hill et al. (1997b); Frette and Stavans (1997); Choo et al. (1998), do not provide exactly the same information as the latter, which are obtained from video signals that record concentrations in the upper free surface of the material. In the case of near-complete axial segregation, both convey the same information, but if the particle distribution in the interior differs from the surface the images will have very different meanings.
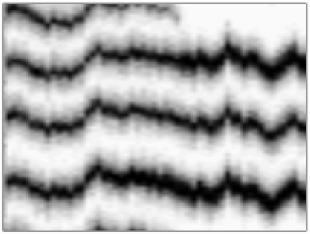
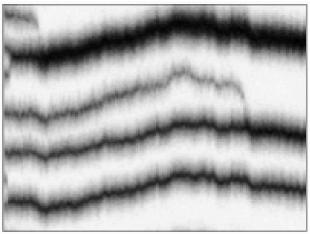
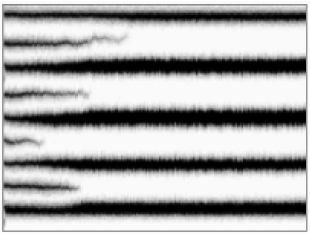
The space-time plot for run #A, which extends over 4300 cylinder rotations, is shown in Fig. 1. Eight bands, four each of big and small particles, appear very shortly after the start of the run, just as in experiment, within the first 50 rotations. Note that due to periodic wraparound, bands extend across the top and bottom ends of the plot. Midway through the run one of the dark (small-particle) bands disappears and the adjacent light bands merge. The resulting pattern persists for the remainder of the run. While the spacing of the bands tends to be fairly constant (aside from the effect of merging), the band pattern as a whole exhibits apparently random oscillatory motion in the axial direction, although the fluctuations tend to be less than the spacing between alternate bands. The immediate conclusion from Fig. 1 is that the simulations are indeed capable of producing axial segregation, and since the boundaries are periodic the effect is a result of spontaneous symmetry breaking in the initially homogeneous, axial direction (rather than being initiated by processes at the cylinder ends).
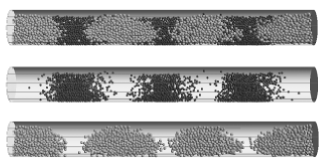
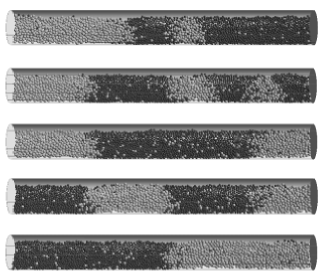
Since space-time plots provide only partial characterization of the behavior, more detailed information is extracted by examination of actual configurations occurring during the run. Figure 2 shows three simultaneous views of #A, as seen from above, at an angle approximately normal to the sloping upper surface. The first image corresponds to what would be seen experimentally; it is followed by two images showing the small and big particles separately (analogous to MRI imaging). These images are taken from an animated sequence that allows detailed examination of the particle motion. Segregation is now seen to be essentially complete, even at the band centers, a result reminiscent of experiment Nakagawa et al. (1997).
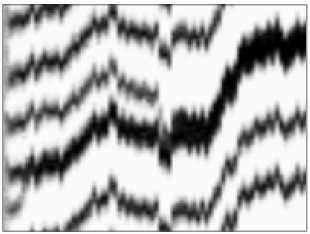
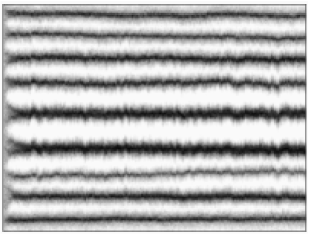
Run #B, shown in Fig. 3, treats a system similar to #A but with the wall friction coefficients reversed, so that the rougher, big particles experience a smoother wall and vice versa. This run begins by forming ten bands, which quickly merge to eight, and midway through the run an additional merger leaves just six bands. The dark bands appear somewhat sharper here; this reflects the fact that the boundaries between species are better defined than before, with even fewer small particles to be found in among the big particles.
A series of additional runs #C–#H, for systems similar to #A but with different choices of sliding friction coefficients (in which there is no relation between the P-P and P-W coefficients) leads to the following observations: if , segregation occurs irrespective of the relation between and ; if , segregation requires ; if , there is no segregation. While these observations apply only to the parameter sets examined, they do suggest that if the cylinder wall exerts a stronger drag on the big particles, thereby raising their preferred surface slope relative to the small, then segregation occurs, but not in the converse case. The result from the earlier MD study Shoichi (1998) is consistent with this statement. If the wall affects both sizes of particle equally, so that the difference in the surface profiles of the species is limited to a slightly altered shape rather than any marked change in the overall slope, then segregation is only seen if the big particles are rougher.
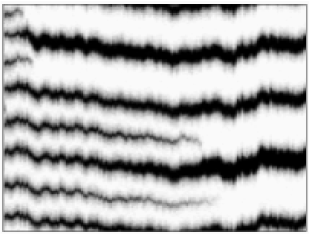
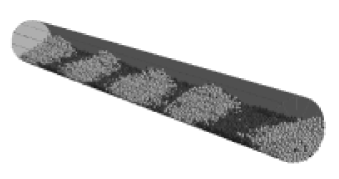
The systems studied so far have been fairly small; by considering larger systems it is possible to encounter richer, more interesting behavior, although without any change in the conclusions as to the dependence on the relative friction values. The first case #I, shown in Fig. 4, is similar to #A but with a longer cylinder; here the initial 16 bands gradually contract to eight, with the changes occurring at various times. The second example #J in Fig. 5 involves a wider cylinder, where, after merging, only six bands remain. Here the bands are less sharply defined, hinting at the possibility of interesting behavior within; when viewed from outside (both the upper surface and the material in contact with the transparent cylinder wall) the bands suggest complete segregation, with just a few particles in the wrong regions, but examination of the interior reveals that while small particles are mostly confined to their bands, big particles are separated by at best narrow gaps (see also run #K below). The tendency of the big particle region not to fragment is confined to an axial core that is invisible from outside; this is reminiscent of behavior noted in studies using MRI (although experimentally Hill et al. (1997a, b) it is the MRI-visible small particles that appear to concentrate near the axis). Figure 6 is an oblique view of the full system, with a container whose forward faces have been removed; heaping of the rougher big particles at the upward moving rear boundary is clearly visible.
The rotation rate is another of the parameters that can affect behavior; surface slopes will be changed, and that in itself is enough to alter the particle flow, but in addition the motion in the interior could be different. The system in Fig. 7, run #K, corresponds to a reduced , but is otherwise identical to #J (but with fewer rotations). The initial uniformly gray region represents the mixed state, out of which the bands emerge at similar, although not identical times. Figure 8 shows four simultaneous views of the system, first as seen from above and below, corresponding to what would be visible in a typical experiment, and then images of just the small and big particles that provide some indication of the interior organization; the ability to look inside reveals that there is a clear asymmetry between big and small particles (more so than in run #A), with the big particles appearing throughout the core region, although on the outside there is little hint of this behavior.
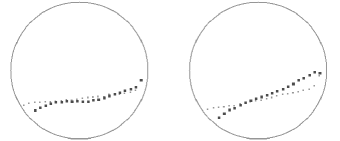
The cylinder diameter in runs #J and #K is sufficiently large for much of the free surface to be reasonably far away from the curved wall, allowing meaningful examination of the surface profiles (profiles for smaller diameters are more strongly affected by wall proximity). Figure 9 shows plots of the axially averaged surface heights across the system (each is averaged over 10 configurations separated by several turns) towards the ends of the runs. The profiles in the two cases are very different; for lower (#K) the principal difference between the big and small particles (the former are rougher) appears near the boundaries, whereas for higher (#J) there is a significant difference across the entire profile. In each case the detailed surface shape is too complex (they are neither planar nor even “S”-shaped) to be characterized just by a dynamic angle of repose; furthermore, since the results represent axial averages they do not reveal surface variation along this direction, as can be seen in Fig. 6.
Rough estimates of the angles associated with these slopes (based on a visual straight-line fit) lie in the approximate range –, less than typical granular media where, for example, values in the range – are found Levine et al. (1994). This is just one consequence of the absence of static friction, the other is that the static angle of repose is essentially zero, so that if rotation stops the surface returns to the horizontal, a situation very different from experiment; on the other hand, the frictional forces that are present in the model do produce a slope adequate for achieving segregation, so that static friction may not play an essential role here.
In the model under study, segregation is also found to occur for particles of identical size, provided the frictional properties differ in a particular way. Run #L, in Fig. 10, shows an example of this behavior; here the particles labeled big and small have the same nominal diameter, but the other details are identical to #A (the shading just distinguishes the species). The bands are not as sharp as before, but segregation still occurs, even if it no longer results in total exclusion of each species from the bands of the other. This observation, with further results from runs #M and #N as to which sets of friction coefficients lead to segregation, is consistent with the earlier observations based on particles of different sizes; if one particle species has both its P-P and P-W sliding friction coefficients larger than the other (or if either one of these coefficients is the same for both species) then segregation occurs. If, on the other hand, the friction coefficients are the same, no axial segregation occurs even for particles of different sizes; indeed an initially segregated system of this type, run #W, mixes (see later), so that at least some difference in frictional properties is essential.
Run #P in Fig. 11 shows what happens when more particles are added, in this case almost half-filling the cylinder. Segregation still occurs, although the band edges are starting to blur, reflecting reduced sharpness of the interfaces between bands. Further filling, run #Q, reduces the thoroughness of the segregation even more and increases the time required for the bands to appear.
V.2 Segregation in capped containers
The periodic systems treated so far are useful for eliminating the potential role of end caps as nucleation regions for segregation. However, periodic systems tend to lack longitudinal stability, as a result of which the entire band pattern is free to translate along the axis, making detailed analysis of the interface regions between bands more difficult. The next series of runs demonstrates the kind of segregation effects that can be seen when end caps are in place; the frictional coefficients for the end walls are the same as for the curved wall.
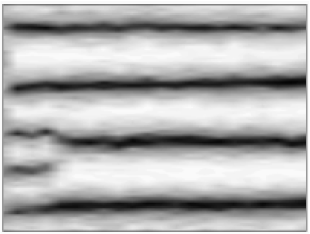
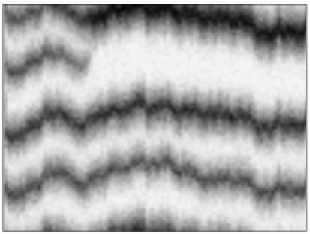
The first example, #R, is shown in Fig. 12. This run is fairly short, allowing the initial band formation to be resolved; subsequently, one pair of dark bands merges. What is different here is the absence of random movement of the band pattern as a whole. The total number of bands has an odd value (in the periodic systems it was of course always even), and it is the big particles with the larger friction coefficients that occupy the end bands. The second example #S, shown in Fig. 13, is for a longer cylinder. Here light bands are seen merging at different times and there is an accompanying broadening of the remaining dark bands; the bands corresponding to the big particles are wider, and again there is no overall motion of the band pattern. Run #T is an example of a system with double the diameter; as in other cases with a larger interior cross-section, the bands are not as sharp.
The lower of run #U, shown in Fig. 14, produces an even richer band structure. This is not such a long run (in terms of the number of rotations, although not in terms of timesteps), and there is a hint that further band merging might have occurred if the run had been longer. Overall, apart from stabilizing the band pattern, there is no evidence to suggest that the end caps alter the behavior in any way, and since band formation begins almost simultaneously at several distinct locations, the ends do not function as nucleation sites.
V.3 Absence of mixing in segregated systems
The behavior of systems that are initially segregated is important for two reasons. One is to establish whether the conditions under which the initially segregated state persists or disappears are consistent with the previous conclusions based on mixed systems. The other is to allow examination of whether, if the system showed evidence of a preferred segregated state organized differently from the initial state, it is capable of transforming itself from one state to another.
The first example, #V, involves a system similar to #A with periodic boundaries, but now with an initial state in which all the small particles are located in a band filling the central region of the cylinder. As shown in Fig. 15, this segregated band persists throughout the run, and only its position changes. Other sets of friction coefficients, corresponding to values for which segregation was found to occur, show similar behavior, and for friction coefficients that do not produce segregation, such as in #W, the initial bands rapidly vanish as the species mix. Since the periodic boundaries permit excessive motion of the pattern as a whole, this run was repeated using a capped cylinder, run #X, with the initially segregated regions each occupying half the cylinder. Due to the stabilizing influence of the end caps the pattern is completely stationary; again there is no hint of mixing, and particles that do escape across the interface promptly return to their own region. The evidence suggests that if the bands are sharply delineated there is no tendency for any change to occur in the pattern, and the multiple-band states that developed in initially mixed systems, such as #S and #U, are not necessarily accessible to systems that are initially segregated; memory of the initial state can apparently influence the long-term outcome of the pattern evolution process.
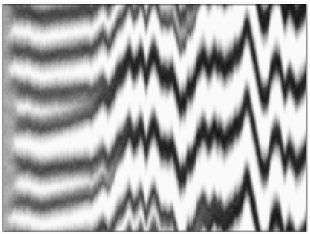
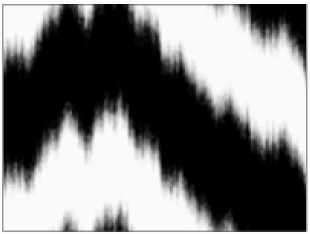
Modification of the friction coefficients makes it possible to reduce the stability of the initial band pattern. Band splitting occurs as a result, and an example of what happens, run #Y (also with end caps), is shown in Fig. 16. The initial state has a single band boundary at the center of the cylinder, as in #X, and the run duration has been increased considerably to allow long-term behavior to be monitored. The appearance of a new light region in the space-time plot corresponds to the emergence of a band of big particles in the midst of a small-particle region, and its disappearance corresponds to the vanishing of the band (there are no new small-particle bands that form during this run). Multiple band formation and disappearance events occur, reminiscent of Ref. Frette and Stavans (1997) to some extent, and at one point in the run the segregated regions can be seen to have exchanged positions relative to the initial state; whether this system ever settles into a steady state is a matter for speculation.
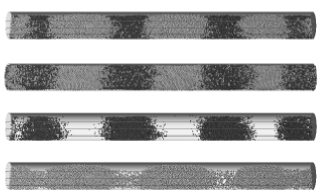
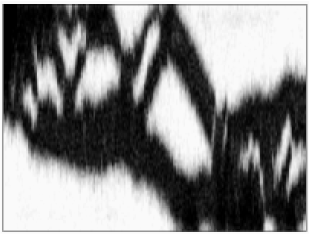
In the corresponding initially mixed case, run #E (a relatively short run), the system segregated into eight bands; in #Y there are intermediate states consisting of four and six bands. The space-time plot is unable to convey an adequate impression of this fascinating behavior, which may be analogous in some sense to the waves observed experimentally Choo et al. (1997, 1998). (A rough estimate of the speed at which the bands move during the central portion of the run can be derived from the gradient of the dark segment just to the right of the middle of Fig. 16. The result is approximately 1% of the small particle diameter per revolution; this is an order of magnitude less than in Ref. Choo et al. (1998) although it is not obvious that the effects are the same.) Figure 17 shows several snapshots from the run, including the reversed band state. Runs such as this, with complex temporal evolution, are extremely sensitive to the initial conditions, and when repeated using modified starting states are likely to exhibit different, though (probably) statistically similar behavior; even those runs that resulted in steady segregation patterns can have initial transient states that depend on the initial conditions.
VI Conclusions
The simulations described in this paper have displayed a variety of phenomena that largely correspond to what is observed experimentally. The formation of axially segregated bands is the most basic of the effects, and the fact that segregation occurs under a variety of conditions is a measure of the success of the model. More complex aspects of the behavior have also been addressed briefly, including behavior in the interior, traveling patterns, and memory effects. Even if not all the parameter combinations examined correspond to physically realizable systems, the fascinating pattern development observed here merits examination in its own right, since corresponding effects do appear in real granular systems. No attempt has been made to probe the actual mechanisms involved, leaving this aspect of the problem for future detailed study; clearly, as is evident from actually watching the simulations in progress, both avalanches and diffusion play a significant role in much of what occurs, but it has yet to be established whether these processes alone are sufficient to account for all aspects of the behavior.
Although the simulations have succeeded in qualitatively reproducing features observed experimentally it is important to reiterate possible discrepancies, the resolution of which may help in understanding the successes and limitations of the models used for granular simulation, as well as suggesting where additional experiments could be helpful. Two such issues were mentioned previously; the first is the relative roughness of the big and small particles, and which species should have the higher friction coefficients, a subject on which experiment Levine et al. (1994); Hill et al. (1997b) has yet to provide an unequivocal answer; the second is the question of which particle species tends to congregate near the cylinder axis, since the MRI experiments were able to show the locations of just one of the species Hill et al. (1997a, b). In addition, as is the case with other granular simulations, the degree to which the omission of static friction from the model adversely affects the results can only be determined empirically. Hopefully, further experimental and simulational effort will help resolve these issues.
It must be emphasized that the conclusions concerning the conditions under which segregation occurs in the model apply only to the specific parameter values considered here; crossover from segregating to non-segregating behavior occurs at intermediate parameter settings, and more extensive exploration of the phase diagram is needed to fill in the gaps. Furthermore, because some slowly-evolving aspects of the behavior can be seen only over comparatively long time intervals, the question of whether the patterns observed here represent true final states, or whether the bands are long-lived but only metastable (in other words, whether or not the system is in dynamic equilibrium) also requires further study, although often the band patterns and the actual particle dynamics provided no hint that further changes ought to be anticipated.
The analysis has focused on overall axial segregation, but there are many other aspects that await future investigation, some of which are likely to entail more extensive computations than employed here. Beyond what can be seen in some of the images showing internal particle organization, the issue of radial behavior, especially radial segregation, has not been addressed; cylinders with a larger diameter may be needed to properly analyze this behavior. In order to learn more about wavelength selection in the segregation bands, if such preferences really exist, repeated long runs with larger systems are needed. The full three-dimensional organization of the particle flows can also be studied; this would provide information on the way interfaces form and decay, the nature of the internal axial and radial flows, and the different kinds of behavior occurring in regions near the center of the layer and close to the free surface; the ability of simulation to probe the interior, in a conceptually similar manner to MRI, is a major advantage of this kind of modeling approach.
Acknowledgements.
This work was partially supported by the Israel Science Foundation.References
- Barker (1994) G. C. Barker, in Granular Matter: An Interdisciplinary Approach, edited by A. Mehta (Springer, Heidelberg, 1994), p. 35.
- Herrmann (1995) H. J. Herrmann, in 3rd Granada Lectures in Computational Physics, edited by P. L. Garrido and J. Marro (Springer, Heidelberg, 1995), p. 67.
- Jaeger et al. (1996) H. M. Jaeger, S. R. Nagel, and R. P. Behringer, Rev. Mod. Phys. 68, 1259 (1996).
- Kadanoff (1999) L. P. Kadanoff, Rev. Mod. Phys. 71, 435 (1999).
- Walton (1983) O. R. Walton, in Mechanics of Granular Materials, edited by J. T. Jenkins and M. Satake (Elsevier, Amsterdam, 1983), p. 327.
- Hirshfeld and Rapaport (1997) D. Hirshfeld and D. C. Rapaport, Phys. Rev. E 56, 2012 (1997).
- Rosato et al. (1987) A. D. Rosato, K. J. Strandburg, F. Prinz, and R. H. Swendsen, Phys. Rev. Lett. 58, 1038 (1987).
- Gallas et al. (1996) J. A. C. Gallas, H. J. Herrmann, T. Pöschel, and S. Sokolowski, J. Stat. Phys. 82, 443 (1996).
- Levine et al. (1994) D. Levine, S. G. Lipson, S. Shtrikman, and J. Stavans, Phys. Rev. Lett. 73, 644 (1994).
- Cantelaube and Bideau (1995) F. Cantelaube and D. Bideau, Europhys. Lett. 30, 133 (1995).
- Shoichi (1998) S. Shoichi, Mod. Phys. Lett. B 12, 115 (1998).
- Hill et al. (1997a) K. M. Hill, A. Caprihan, and J. Kakalios, Phys. Rev. Lett. 78, 50 (1997a).
- Hill et al. (1997b) K. M. Hill, A. Caprihan, and J. Kakalios, Phys. Rev. E 56, 4386 (1997b).
- Frette and Stavans (1997) V. Frette and J. Stavans, Phys. Rev. E 56, 6981 (1997).
- Choo et al. (1997) K. Choo, T. C. A. Molteno, and S. W. Morris, Phys. Rev. Lett. 79, 2975 (1997).
- Choo et al. (1998) K. Choo, M. W. Baker, T. C. A. Molteno, and S. W. Morris, Phys. Rev. E 58, 6115 (1998).
- Stavans (1998) J. Stavans, J. Stat. Phys. 93, 467 (1998).
- Nakagawa et al. (1997) M. Nakagawa, S. A. Altobelli, A. Caprihan, and E. Fukushima, Chem. Eng. Sci. 52, 4423 (1997).
- Ristow and Nakagawa (1999) G. H. Ristow and M. Nakagawa, Phys. Rev. E 59, 2044 (1999).
- Hill et al. (2001) K. M. Hill, N. Jain, and J. M. Ottino, Phys. Rev. E 64, 011302 (2001).
- Aranson and Tsimring (1999) I. S. Aranson and L. S. Tsimring, Phys. Rev. Lett. 82, 4643 (1999).
- Aranson et al. (1999) I. S. Aranson, L. S. Tsimring, and V. M. Vinokur, Phys. Rev. E 60, 1975 (1999).
- Yanagita (1999) T. Yanagita, Phys. Rev. Lett. 82, 3488 (1999).
- Ristow (1999) G. H. Ristow, Gran. Matter 1, 151 (1999).
- Dury and Ristow (1997) C. M. Dury and G. H. Ristow, J. Phys. I (France) 7, 737 (1997).
- Cundall and Strack (1979) P. A. Cundall and O. D. L. Strack, Géotechnique 29, 47 (1979).
- Haff and Werner (1986) P. K. Haff and B. T. Werner, Powder Tech. 48, 239 (1986).
- Campbell (1990) C. S. Campbell, Ann. Rev. Fluid Mech. 22, 57 (1990).
- Hirshfeld and Rapaport (2001) D. Hirshfeld and D. C. Rapaport, Eur. Phys. J. E 4, 193 (2001).
- Schäfer et al. (1996) J. Schäfer, S. Dippel, and D. E. Wolf, J. Phys. I (France) 6, 5 (1996).
- Rapaport (2001) D. C. Rapaport, Phys. Rev. E 64, 061304 (2001).
- Rapaport (1995) D. C. Rapaport, The Art of Molecular Dynamics Simulation (Cambridge University Press, Cambridge, 1995).