Transitions between Inherent Structures in Water
Abstract
The energy landscape approach has been useful to help understand the dynamic properties of supercooled liquids and the connection between these properties and thermodynamics. The analysis in numerical models of the inherent structure (IS) trajectories — the set of local minima visited by the liquid — offers the possibility of filtering out the vibrational component of the motion of the system on the potential energy surface and thereby resolving the slow structural component more efficiently. Here we report an analysis of an IS trajectory for a widely-studied water model, focusing on the changes in hydrogen bond connectivity that give rise to many IS separated by relatively small energy barriers. We find that while the system travels through these IS, the structure of the bond network continuously modifies, exchanging linear bonds for bifurcated bonds and usually reversing the exchange to return to nearly the same initial configuration. For the 216 molecule system we investigate, the time scale of these transitions is as small as the simulation time scale ( fs). Hence for water, the transitions between each of these IS is relatively small and eventual relaxation of the system occurs only by many of these transitions. We find that during IS changes, the molecules with the greatest displacements move in small “clusters” of 1-10 molecules with displacements of nm, not unlike simpler liquids. However, for water these clusters appear to be somewhat more branched than the linear “string-like” clusters formed in a supercooled Lennard-Jones system found by Glotzer and her collaborators.
I Introduction
It is believed that the properties of liquids can be understood as motion of the system in a high-dimensional complex potential energy surface (PES) [1, 2, 3, 4, 5, 6]. As a liquid is cooled toward the glassy state, the system is increasingly found near local potential energy minima, called inherent structure (IS) configurations [2]. As temperature decreases, the description of the dynamics in terms of motion on the PES becomes increasingly appropriate. In this description, in the glassy state, the system is localized in one of the potential energy basins [7, 8, 9, 10].
While such a picture of liquid dynamics is difficult to verify experimentally, computer simulation offers an excellent opportunity to explore these ideas. For a pre-defined liquid potential, a liquid trajectory can be generated via molecular dynamics simulation and the local potential energy minima can be evaluated by an energy minimization method [2]. With this procedure, the motion in phase space is converted into a minimum-to-minimum trajectory, or IS trajectory. A general picture of the system moving among a set of basins surrounding the multitude of local minima has evolved. More specifically, simulations have shown that both the depth of the minima sampled by the system, as well as the number of these minima, decrease on cooling [5, 10, 11]. Simulations have also shown that below a crossover temperature , only rare fluctuations bring the system to a saddle point and hence activated processes become important for relaxation of the liquid [7, 9, 12, 13, 14]. For the system we study, coincides numerically [9, 14, 15, 16, 17] with the critical temperature identified by mode coupling theory (MCT), which has been widely used to understand the dynamics of liquids on “weak” supercooling (the range where characteristic relaxation times approach s) [18].
The description of the real motion of the system as an IS trajectory becomes a powerful way of separating the vibrational contribution, responsible for the thermal broadening of instantaneous measurements from the slow structural component[19]. Such an approach becomes even more powerful below , since most of the instantaneous configurations are far from saddles, making correlation functions calculated from the IS trajectory fully account for the -relaxation dynamics[7].
Here we study the IS trajectory below for the extended simple point charge (SPC/E) potential[20], a well-studied model for water. The dynamics of the SPC/E model have been shown to be consistent with the predictions of MCT [21, 22]. Additionally, the PES of SPC/E has been studied in detail above and a thermodynamic description of the supercooled states based on the PES has been presented[11, 23]. Here we focus on the geometrical properties of the motion, once the vibrational component is subtracted. The possibility of performing such a study below , with a very fine time coarse graining, allows us to examine the structural changes that accompany the basin transitions and to describe an elementary step of the diffusive process in terms of hydrogen bond network rearrangement.
II Simulation
Our results are based on molecular dynamics simulations of the SPC/E model [20] of water for 216 molecules, at fixed density g/cm3 . The numerical procedure is described in Ref.[22]. The integration time step is fs. The mode coupling temperature for this density is [22]. We analyze trajectories at K, so that the system is in the deep supercooled liquid state. At this temperature, the diffusion coefficient is more than four orders of magnitude smaller than its value at K and only a few molecules move significantly (with displacements larger than nm) at each simulation time step[24]. Our system is started from equilibrated configurations at K, which relax for nearly 920 ns at K before we record and analyze the trajectory. At such a low temperature, a slow aging in the trajectory could be present, however, the aging should not affect the qualitative picture we present.
We have generated one trajectory of ns, sampling configurations at each ps. For each configuration we find the corresponding IS using conjugate gradient minimization. In this way, we obtain configurations with the corresponding IS. Since we could miss some IS transitions with ps sampling, we also ran four independent ps simulations sampling the IS at fs. In this way, we obtain another 20,000 configurations with the corresponding IS.
III Inherent Structure Trajectories
Figure 1 shows an example of the potential energy of the IS, , and the mean square displacement of the oxygen atoms starting from a single arbitrary starting time. At K, the slowest collective relaxation time ns [22]. The IS trajectory in Fig. 1 has a mesh of ps and covers a total time of ns. In this time interval, is about , i.e. much less than the corresponding value of the average nearest neighbor distance of . Figure 2 shows an enlargement of the IS trajectory using a much smaller time mesh ( fs, two times the simulation time step). Fig. 2 shows that changes occur via discrete transitions, with an average duration of ps. The transitions are characterized by an energy change of kJ/mol and an oxygen atom square displacement of the order of ; they appear to constitute the elementary step underlying the diffusional process in the system.
We note that it is impossible to identify the transition unless the quenching time step is of the order of the simulation time step. This is in distinct contrast to a Lennard-Jones liquid, where such small continuous changes are not present [7]. The difference, we will show, is attributable to the hydrogen bonds. This time scale for IS transitions is in accord with other work on the TIPS2 water model, at K [19].
In Fig. 2, we see the sharp changes in coincide with the sharp changes in . This confirms that the system is repeatedly visiting specific configurations, since and take on discrete values. The results shown in Fig. 2 imply that the system often returns to the original basin because of both the difference in energy and the displacement approach zero at the end of the time interval.
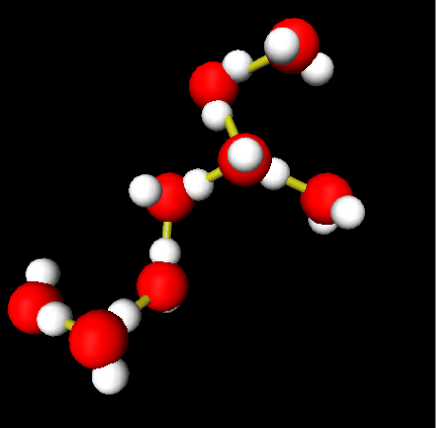
To aid in understanding the distribution of the displacements during the IS changes (such as those between the two IS labeled A and B in Fig. 2(b)), Fig. 3 shows the displacements of all 216 individual molecules from IS-A to IS-B. We see that there is a relatively small set of molecules with a large displacement. A snapshot of the eight molecules with the largest displacement is shown in Fig. 4. Interestingly, we find that this set of molecules forms a cluster of bonded molecules. Indeed, for all cases studied, we found that the set of molecules which displace most form a cluster of bonded molecules. The observed clustering phenomenon characterizes the IS transitions in water and can be interpreted as the analog of the string-like motion observed in simple atomistic liquids [7] and connected to the presence of dynamical heterogeneities[25]. Similar results were found by Ohmine et al. using the TIP4P and TIPS2 models for water [26].
To characterize the distribution of individual molecular displacements between different IS more carefully, we show the distribution of displacements of the oxygen atoms in Fig. 5. The time difference is two times the integration time step[27]. We collected data from all transitions in four independent ps trajectories for the results reported in Fig. 5. Note that was previously studied by Schrøder et al. for a binary Lennard-Jones (LJ) mixture [7].
We find that the distribution of displacements is monotonic and does not allow us to detect a characteristic length which could help in distinguishing between diffusive and non-diffusive basin changes. for shows an apparent power-law with a negative slope of about , followed by an exponential tail. To highlight the exponential tail, we present the data in a linear-log plot Fig. 5 (upper panel), showing that the tail in is mostly due to these highly “mobile molecules”. The characteristic length of the exponential tail is , about 15 times smaller than the nearest neighbor oxygen distance of and in agreement with the finding of Schrøder et al. for the LJ case, where the characteristic length was about of the nearest neighbor distance.
Schrøder et al. interpreted the power-law contribution to as a response of the system to the diffusing molecules. In elasticity theory[28], a local displacement at the origin produces a distribution of displacements which scales with the distance from the origin as . Hence the distribution of displacements scales as [28]. In contrast with the LJ case, the exponent we find is slightly larger than , a discrepancy which may be related to the application of a continuum theory at a length scale where molecular details are still relevant. In the spirit of elasticity theory, the deviation of the distribution at small values from the power law arises from the cutoff introduced by the finite size of the simulation. Indeed, small values are produced at large and hence are missing in a finite simulation box.
Although a subset of “highly mobile” molecules is identifiable using a pre-defined threshold value in a single basin change, there is no unambiguous general criterion for identifying the molecules responsible for a single basin transition.
An important open question is the relation between the displacement distribution functions for (Fig. 5) and the same distribution evaluated for an arbitrary time interval . A full knowledge of such relation may shed light on the elementary stochastic process which better describes the dynamics of the deep supercooled state. This calculation requires a significant computational investment due to the very large number of IS configurations which need to be evaluated. Despite such difficulties, it is a promising research line for the near future.
IV HB network restructuring
Liquid water is an interesting system for studying the physical processes that accompany basin transitions. The unusual dynamic and thermodynamic properties of water are believed to be connected to the microscopic behavior of hydrogen bonding. Many experiments suggest that this tetrahedral HB network has defects, such as an extra (fifth) molecule in the first coordination shell[29, 30]. Indeed, such 5-coordinated molecules have been directly identified in simulations and the defects were found to be a catalyst for motion in the system[31], making an obvious possible connection between network defects promoting diffusion and the basin transitions that give rise to diffusive motion of that system.
To obtain a physical picture of the IS transitions for water and to hopefully better understand the source of these transitions, we focus on the small changes in the HB network along a minimum to minimum trajectory. Analysis of the HB network based on IS configurations has shown that local PES minima are characterized by both linear bonds (LB) and bifurcated bonds (BB) [31] whose fraction is both temperature and density dependent. The HB network tends toward a perfect random tetrahedral network on cooling, or on lowering the pressure[23]. Here we emphasize the changes in the network associated with IS-transitions.
To quantify the bonding changes, it is necessary to employ an arbitrary bond definition. Previous works have indicated that several definitions provide physically reasonable results. Here we use the definition that two molecules are bonded if their oxygen-oxygen distance is less than 3.5Å and their mutual potential energy is negative [31]. Using this definition, we obtain the equilibrium distribution of the potential energy for the LB and BB, shown in Fig. 6.
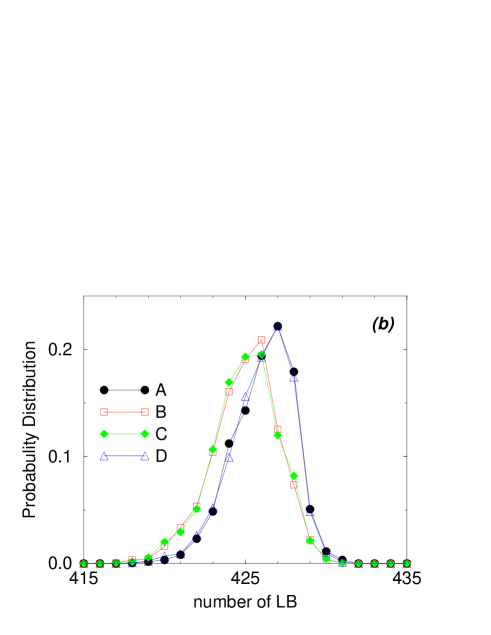
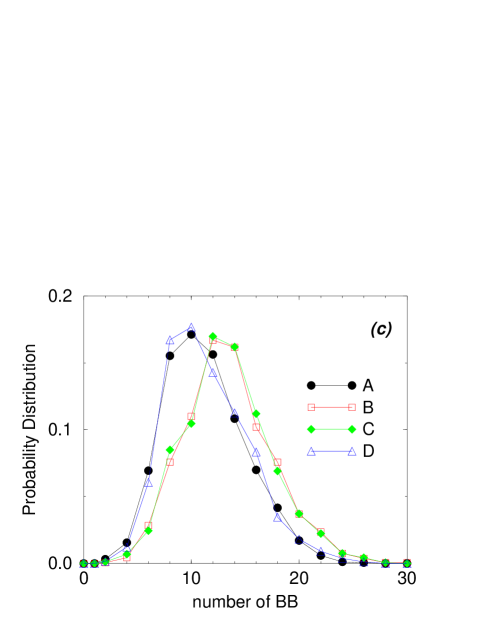
These results agree with previous findings, based on different models[32, 33, 34]. The distribution of BB energies is bimodal with peaks at roughly kJ/mol or kJ/mol, while the LB energy distribution is unimodal with a peak at roughly kJ/mol. Therefore, the energy associated with a change in the HB network due to losing one LB and creating two BB ranges roughly from kJ/mol to kJ/mol, depending on which of the two possible BB are created. The relative intensities of the peaks of the BB energy distribution suggest that such a mechanism would more likely lead to an increase in the overall energy. The comparison of the HB-energy changes with those found in Fig. 1 suggest that interchanges between LB and BB can explain the existence of a multitude of IS separated by very small energy barriers. More specifically, we hypothetize that changes increasing found in Fig. 1 are due to processes LBBB, while the changes decreasing are due to the processes BBLB. To confirm or reject this hypothesis, we study the distributions of LB and BB for IS just before and just after positive and negative “jumps” in the potential energy (Fig. 1b) with energy larger than 9 kJ/mol [35]. These IS are schematically shown in Fig. 7(a). The corresponding distributions for LB and BB are shown in Fig. 7(b) and 7(c). We see that during PE increases, the average number of LB decreases while the number of BB increases; the opposite situation occurs when the potential energy decreases. The distribution for BB has peaks at even numbers of BB, which we expect since for each LB lost, two BB appear, also implying that the distribution should be zero for odd numbers of BB [36]. The anti-correlation of the BB and LB changes is a strong indicator that a mechanism whereby the system accesses higher energy states is via LBBB transitions.
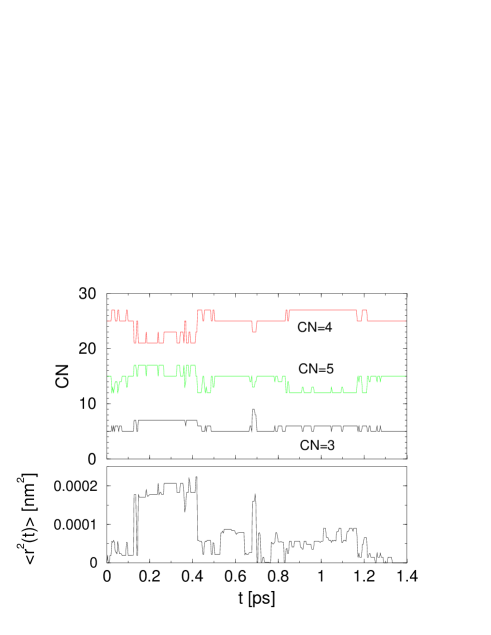
To reinforce the hypothesis that the basin change is associated with a restructuring of the local connectivity, Fig. 8 shows the number of molecules with a coordination number equal to 3, 4 or 5 as a function of time for a characteristic time interval and contrasts this data with the time dependence of . A clear anti-correlation is observed between the time dependence of the number of 3 and 5-coordinated molecules compared to the time dependence of the 4-coordinated molecules, supporting the proposed interchange mechanism. The fact that increases in the fraction of BB coincides with changes in supports the expectation that motion is a result of network imperfections.
V Summary
We have presented a detailed analysis of the motion on the PES of a 216 water molecule system interacting via the SPC/E potential in a deeply supercooled state, below the MCT temperature. At this temperature, the system populates basins of the local minima. At these conditions, the analysis of the IS trajectories provides a very clean description of the slow alpha relaxation process filtering nearly all vibrational motions.
We have shown that an inherent structure transition is observed about every 0.2 ps. It is the collection of these numerous small transitions that gives rise to the structural relaxation of the system. These fast transitions are characterized by a broad distribution of individual molecule displacements, without a clear characteristic length. Future work must address the issue of the prediction of from the knowledge of .
We perform an analysis of the geometry of the individual event and find that the most mobile molecules are clustered. The analysis of the changes in HB connectivity associated with IS changes reveals that these transitions are associated with the breaking and reformation of HB. This result is in accord with work of Ohmine and colleagues [19, 26] for TIP4P. We have shown that the transitions associated with an increase in the energy correspond to the breaking of linear bonds and to the simultaneous formation of bifurcated bonds. Similarly, the transitions associated with a decrease in the energy correspond to the breaking of bifurcated bonds and to the simultaneous formation of linear bonds.
This result supports the hypothesis that the linear to bifurcated transition can be considered as an elementary step in the rearrangement of the HB network.
VI Acknowledgments
We thank T.B. Schrøder, S. Sastry and S.C. Glotzer for interesting discussions. N.G. wants to thanks I. Ohmine for fruitful discussions and suggestions. F.S. acknowledges support from INFM-PRA-HOP and Initiaziva Calcolo Parallelo and MURST COFIN2000. This work was supported by the NSF Chemistry Program.
REFERENCES
- [1] M. Goldstein, J. Chem. Phys. 51, 3728 (1969).
- [2] F.H. Stillinger, and T.A. Weber, Phys. Rev. A 28, 2408 (1983).
- [3] F.H. Stillinger, Science 267, 1935 (1995).
- [4] C.A. Angell, Science 267, 1924 (1995).
- [5] S. Sastry, P.G. Debenedetti, and F.H. Stillinger, Nature 393, 554 (1998).
- [6] P.G. Debenedetti, and F.H. Stillinger, Nature 410, 259 (2001).
- [7] T.B. Schrøder, S. Sastry, J.C. Dyre,and S.C. Glotzer, J. Chem. Phys. 112, 9834 (2000).
- [8] A. Heuer, Phys. Rev. Lett. 78, 4051 (1997); S. Buchner, and A. Heuer, Phys. Rev. E 60, 6507 (1999).
- [9] L. Angelani, G. Parisi, G. Ruocco, G. Viliani, Phys. Rev. Lett. 81, 4648 (1998).
- [10] F. Sciortino, W. Kob, and P. Tartaglia, Phys. Rev. Lett. 83, 3214 (1999).
- [11] A. Scala, F.W. Starr, E. La Nave, F. Sciortino, and H.E. Stanley, Nature 406, 166 (2000).
- [12] J.P.K. Doye, and D. Wales, Phys. Rev. Lett. 86, 5719 (2001).
- [13] T. Keyes, J. Phys. Chem. A 101, 2921 (1997).
- [14] E. La Nave, A. Scala, F. W. Starr, F. Sciortino, and H.E. Stanley, Phys. Rev. Lett. 84, 4605 (2000); E. La Nave, A. Scala, F. W. Starr, H.E. Stanley, and F. Sciortino, Phys. Rev. E 64, 36102 (2001).
- [15] F. Sciortino, and P. Tartaglia, Phys. Rev. Lett. 78 2385 (1997).
- [16] C. Donati, F. Sciortino, and P. Tartaglia, Phys. Rev. Lett. 85, 1464 (2000).
- [17] E. La Nave, F. Sciortino, and H.E. Stanley, Phys. Rev. Lett. 88, 035501 (2002).
- [18] W. Götze, and L. Sjøgren, Rep. Prog. Phys. 55, 241 (1992).
- [19] I. Ohmine, and H. Tanaka, Chem. Rev. 93, 2545 (1993) and references therein.
- [20] H.J. Berendsen, J.R. Grigera, and T.P. Stroatsma, J. Phys. Chem. 91, 6269 (1987).
- [21] F. Sciortino, P. Gallo, P. Tartaglia, and S-H. Chen, Phys. Rev. E 54, 6331 (1996); P. Gallo, F. Sciortino, P. Tartaglia, and S.H. Chen Phys. Rev. Letts 76 2730 (1996); F. Sciortino, L. Fabbian, S-H. Chen, and P. Tartaglia, Phys. Rev. E 56, 5397 (1997); L. Fabbian, A. Latz, R. Schilling, F. Sciortino, P. Tartaglia, and C. Theis Phys. Rev. E. 60 5768 (1999); ibid. Phys. Rev. E. 62, 2388 (2000); C. Theis, A. Latz, R. Schilling, F. Sciortino, P. Tartaglia Phys. Rev. E. 62, 1856 (2000).
- [22] F. W. Starr, F. Sciortino, H.E. Stanley, Phys. Rev. E 60, 6757 (1999).
- [23] F. W. Starr, S. Sastry, E. La Nave, A. Scala, H. E. Stanley, and F. Sciortino, Phys. Rev. E 63, 041201 (2001).
- [24] The Adam and Gibbs hypothesis [37] states that flow in a supercooled fluid involves cooperative motion of molecules. For recent experimental work on cooperative motions see Ref.[38].
- [25] M. Hurley, and P. Harrowell, Phys. Rev. E 52, 1694 (1995); W.Kob, C. Donati, S.J. Plimpton, P.H. Poole, and S.C. Glotzer, Phys. Rev. Lett. 79, 2827 (1997); C. Donati, J.F. Douglas, W. Kob, S.J. Plimpton, P.H. Poole, and S.C. Glotzer, Phys. Rev. Lett. 80, 2338 (1998); B. Doliwa, and A. Heuer, Phys. Rev. Lett. 80, 4915 (1998).
- [26] M. Matsumoto and I. Ohmine, J. Chem. Phys. 104, 2705 (1996); I. Ohmine and S. Saito, Acc. Chem. Res. 32, 741 (1999), and references therein.
- [27] If during the time interval the system does not change IS, the contribution to appears only for and hence does not modify the shape of the distribution.
- [28] J.C. Dyre, Phys. Rev. E 59, 2458 (1999); ibid. 59, 7243 (1999).
- [29] J. Dore and J. Texeira (eds.), Hydrogen Bonded Liquids (Kluwer, Dordrecht), (1991), pp 171-183.
- [30] E. Grünwald, J. Am. Chem. Soc. 108, 5719 (1986); A.H. Narten and H.A. Levy, Science 165, 447 (1969); P.A. Giguere, J. Chem. Phys 87, 4835 (1987); G.E. Walrafen, M.S. Hokmabadi, W.H. Yang,Y.C. Chu and B. Monosmith, J. Phys. Chem. 93, 2909 (1989).
- [31] F. Sciortino, A. Geiger, and H.E. Stanley, Phys. Rev. Lett. 56, 3452 (1990); Nature 354, 218 (1991); J. Chem. Phys. 96, 3857 (1992).
- [32] F.H. Stillinger and A. Rahman, J. Chem. Phys. 60, 1545 (1974).
- [33] H.J.C. Berendsen, J.C.M. Postma, W.F. Von Gunsteren, and J. Hermans in Intermolecular Forces edited by B. Pullman (Reidel, Dordrecht, 1981). p.331.
- [34] W.L. Jorgensen, J.Chandrasekhar, J.D. Madura, R.W. Impey, and M.L. Klein, J. Chem. Phys. 79, 926, (1983).
- [35] We find from Fig. 1 that most of the “jumps” in potential energy correspond to changes in larger than 9kJ/mol. We found similar results for a lower cutoff in energy of 1kJ/mol.
- [36] We find that the distribution is not exactly zero for odd numbers of BB, which is a consequence of the bond definition. Using the definition that two molecules are bonded if their oxygen-oxygen distance is less than nm and their interaction energy is less than a fixed value , we find that there exist few cases in which one hydrogen atom is “shared” by 3 oxygens (instead of 2 as in the case of a BB). We try different values for and we find that these “tri-furcated” bonds (TB) disappear if is reduced to -10kJ/mol. These TB can also contribute to the presence of an even number of BB appearing in the distribution. The ratio of BB:TB for , kJ/mol is 20:1 and 24:1. We also check that the distribution for BB at kJ/mol is zero for odd numbers of molecules.
- [37] G. Adam and J.H. Gibbs, J. Chem. Phys. 43, 139 (1965).
- [38] M.T. Cicerone, F.R. Blackburn and M.D. Ediger, J. Chem. Phys. 102 471 (1995); E.R. Weeks, J.C. Crocker, A.C. Levitt, A. Schofield, D.A. Weitz, Science 287 627 (2000); K. Schmidt-Rohr and H.W. Spiess, Phys. Rev. Lett. 66 3020 (1991); A. Heuer, M. Wihelm, H. Zimmermann and H.W. Spiess, Phys. Rev. Lett. 75 2851 (1995).